

Abstract
Produced water is the largest waste stream associated with oil and gas operations. This complex fluid contains petroleum hydrocarbons, heavy metals, salts, naturally occurring radioactive materials and any remaining chemical additives. In the United States, west of the 98th meridian, the federal National Pollutant Discharge Elimination System (NPDES) exemption allows release of produced water for agricultural beneficial reuse. The goal of this study was to quantify mutagenicity of a produced water NPDES release and discharge stream. We used four mutation assays in budding yeast cells that provide rate estimates for copy number variation (CNV) duplications and deletions, as well as forward and reversion point mutations. Higher mutation rates were observed at the discharge and decreased with distance downstream, which correlated with the concentrations of known carcinogens detected in the stream (e.g., benzene, radium), described in a companion study. Mutation rate increases were most prominent for CNV duplications and were higher than mutations observed in mixtures of known toxic compounds. Additionally, the samples were evaluated for acute toxicity in Daphnia magna and developmental toxicity in zebrafish. Acute toxicity was minimal, and no developmental toxicity was observed. This study illustrates that chemical analysis alone (McLaughlin et al., 2020) is insufficient for characterizing the risk of produced water NPDES releases and that a thorough evaluation of chronic toxicity is necessary to fully assess produced water for beneficial reuse.
Keywords: Energy-water-food nexus, Produced water, Oil and gas, Emerging pollutants, Ecotoxicology, Whole effluent toxicity
GRAPHICAL ABSTRACT

1. Introduction
Produced water (PW) is one of the largest waste streams associated with oil and gas (O&G), with trillions of liters generated each year in the United States (Clark et al., 2013). Because of its origins in the O&G producing formation, PW contains elevated levels of hydrocarbons, salts, metals and naturally occurring radioactive materials (NORMs) (Guerra et al., 2011). It also contains any remaining drilling, stimulation or well-maintenance chemicals as well as their transformation products. Nearly 80% of PW in the U.S. is generated in the West (Guerra et al., 2011). Under the Clean Water Act, it is illegal to discharge pollutants from a point source into a water of the United States unless the entity obtains a National Pollutant Discharge Elimination System (NPDES) permit. The Oil and Gas Extraction Point Source Category of this regulation excludes “produced water, drilling muds, drill cuttings, and produced sand” from point sources that can be discharged into navigable waters. In areas west of the 98th meridian, however, the exemption in 40 CFR § 435 Subpart E allows release of PW for livestock watering, irrigation and other agricultural purposes if it is “of good enough quality” (see map in Fig. S1; McLaughlin et al., 2020). The only federally defined effluent limit for these permits pertains to oil and grease (<35 mg/L). All other effluent limits are determined by U.S. Environmental Protection Agency (EPA) regulators in the region. PW contents vary by time, location, geologic formation and variations in chemical use (Orem et al., 2007; Clark and Veil, 2009; Rosenblum et al., 2017; Oetjen et al., 2018). Treatment of these complex chemical mixtures varies based on composition and by the well operator. As a result, the composition of NPDES O&G PW releases is poorly characterized.
Many of the O&G formations in the western U.S. are located in water-scarce, arid regions (Guerra et al., 2011). The amount of PW generated varies by location, age of the well, hydrocarbon extracted, and drilling technique. In some areas, the volume of PW is substantial enough to serve as a water resource for agriculture or industry (Clark and Veil, 2009; Guerra et al., 2011; Bai et al., 2013; Dolan et al., 2018). For example, in California, Wyoming and Montana, treated PW is currently being reused to irrigate crops (Dolan et al., 2018). PW for crop irrigation is also occurring in the Middle East (Hirayama et al., 2002). Reuse of PW within the O&G industry is also common and, in some states, produced water is reused for other purposes, such as road-spreading (Dolan et al., 2018; Tasker et al., 2018). Due to increased water scarcity stresses and issues associated with other PW management techniques (e.g. earthquakes) (Weingarten et al., 2015), operators, municipalities and the U.S. federal government are increasingly interested in beneficial reuse of PW. This is exemplified by the ongoing U.S. Environmental Protection Agency “Study of Oil and Gas Extraction Wastewater Management” which aims “to understand any potential need for, and any concerns over, additional discharge options for on-shore oil and gas wastewater” and the U.S. Department of Energy’s Water Security Grand Challenge which aims to find a cost-effective PW treatment approach for both agricultural and industrial reuse (US DOE, 2020; US EPA, 2020). Additionally, in 2018, the state of New Mexico entered into a memorandum of understanding (MOU) with the U.S. EPA to investigate reuse, recycling and beneficial reuse of PW in the state (US EPA, 2018).
Understanding of the impact of PW beneficial reuse on livestock, plant and human health is limited, however, research into this area is increasing. A few studies have assessed environmental impacts associated with reuse of coal bed methane PW, which is usually less contaminated than O&G PW (Jackson and Reddy, 2007; Bern et al., 2013). Additionally, a recent study assessed physiological and morphological responses in wheat crops irrigated with diluted O&G PW (Sedlacko et al., 2019). This study demonstrated that irrigating with diluted PW resulted in a range of negative effects as compared to controls including decreases in biomass, photosynthetic efficiency, reproductive growth and grain yield. Results showed that while salt contributed to these morpho-physiological effects, other constituents in the PW also contributed to these outcomes. A related study concluded that plant disease resistance was reduced after irrigation with reused PW (Miller et al., 2019). From these studies, it is clear that negative consequences are a possible outcome of PW reuse and more research is needed to determine if and when this practice can be sustainable.
As a first step towards this goal, in a companion study, a chemical analysis was conducted on water samples collected from a NPDES PW release point and subsequent sites downstream (McLaughlin et al., 2020). This site is located in Wyoming, USA, an arid state west of the 98th meridian where water scarcity is a concern (Fig. S1). Chemical analysis alone, however, is not sufficient to provide an accurate environmental risk assessment of this discharge. Firstly, toxicological information and regulatory health thresholds for downstream users are unavailable or unknown for many of the detected chemicals (Colborn et al., 2011; Elliott et al., 2016; McLaughlin et al., 2020). Secondly, many analytes may go undetected because they are not screened for or their concentrations are below instrumental detection limits (Oetjen et al., 2017). This is especially concerning for transformation intermediates that are potentially more toxic than their parent compounds and therefore remain toxic at low concentrations. Thirdly, the behavior of chemicals in complex mixtures strongly depends on their mode of toxic action (Escher and Hermens, 2002). While mixtures of chemicals with a common target site and the same mode of action often act according to concentration/dose additivity, antagonistic or synergistic effects may arise if mixture components interact with each other (Plackett and Hewlett, 1952). Thus, an integrated chemical and toxicological assessment of these waters is needed to support a comprehensive evaluation of the risks and impacts associated with current NPDES PW discharge practices.
The acute Whole Effluent Toxicity (WET) test is a requirement for most NPDES PW discharges. While acute toxicity is important, analysis of chronic toxicity is imperative as well. Numerous studies have shown that both acute and chronic toxicity (e.g. endocrine disruption, mutagenicity, etc.) are elevated in surface water downstream of partially treated industrial discharges and wastewater treatment plant (WWTP) effluents (Ohe et al., 2004; Blackwell et al., 2019). Additionally, studies have demonstrated both acute and chronic toxicity in organisms exposed to PW and its constituents (Blewett et al., 2017; Cozzarelli et al., 2017; Folkerts et al., 2017a, 2017b; He et al., 2017a, 2017b; Kassotis et al., 2014, 2015, 2016a). To date, toxicological studies have focused on inadvertent releases of PW, PW prior to treatment or known mixtures of PW constituents. To our knowledge, a toxicological assessment of minimally treated PW for agricultural beneficial reuse (i.e. NPDES release) has not been conducted. Additionally, most laboratory studies have focused on hormonal impacts, with some analysis of developmental outcomes (Kassotis et al., 2014, 2015, 2016a, 2016b; Blewett et al., 2017; Folkerts et al., 2017a, 2017b).
A thorough study on increased cancer risk potential is also needed, including an analysis of increased mutagenesis following PW exposure. The Salmonella Ames test is the most widely used assay system to detect mutagenicity in a broad range of samples, including surface waters and complex mixtures (Ohe et al., 2004; Claxton et al., 2010). This assay detects primarily point mutations in the DNA nucleotide sequence leading to reversion of a selectable marker. While point mutations have long been established as having a broad role in human disease, particularly in cancer development, studies in the last 10–15 years have uncovered a previously underappreciated role for alterations in chromosome structure leading to gene copy-number variation (CNV) in these same processes. CNVs are now conclusively linked to a wide range of human diseases, including neurodevelopmental disorders (e.g. autism, schizophrenia) and cancer (Stratton et al., 2009; Krepischi et al., 2012). Thus, in order to gain a broad understanding of the health risks associated with environmental mutagenesis, it is important to integrate the use of mutagenicity assays that can detect both nucleotide and structural genetic variation (Conover and Argueso, 2016).
In this study we took such an integrated approach through the assessment of mutagenicity in a strain of the Saccharomyces cerevisiae budding yeast that was built specifically to support the parallel measurement of four classes of mutations in a single exposure experiment. These included reversion point mutations directly analogous to those covered by the Ames test, and also forward point mutations, CNV deletions, and disease-relevant low-order gene duplications. The CNV duplication assay used in this study and developed by our group is able to detect a simple doubling in copy number of a reporter cassette, whereas most previous gene amplification assays had lower sensitivity and can detect only high order amplification (Zhang et al., 2013; Klein et al., 2019). It was hypothesized that increased toxicity would be observed for some endpoints and not others. Thus, in addition to these parallel mutagenicity assays, we also assessed the samples for acute toxicity using Daphnia magna and developmental toxicity in Danio rerio (zebrafish). The results of these assays were combined to assess chronic and acute toxicity of O&G PW intended for agricultural beneficial reuse. The goal of the present study was to quantify toxicity, with a focus on mutagenic activity, of a NPDES PW release.
2. Materials and methods
2.1. Site description
The field site for this study is an undisclosed well field in Wyoming (Fig. 1). On average, 4.5 million L of minimally treated PW are released from the NPDES discharge per day into an ephemeral stream bed. There is little precipitation in the region (average 230 mm/year) (NOAA, 2018) and no additional tributaries. A previous study conducted at this site analyzed 228Ra/226Ra in water samples which indicated that the discharge was sourced from oil and gas reservoirs and that additional sources of water had minimal to no impact on inorganic chemistry downstream (McDevitt et al., 2019). Additionally, during sampling, no other sources of surface water were observed entering the stream. As a result, the majority of the flow in the discharge stream is composed of O&G PW unless there has been a recent precipitation or snowmelt event. About 2 km from the NPDES release, a dam separates the discharge into two equal streams. One continues southeast for about 2 km before emptying into a playa lake that is used by cattle, horses, waterfowl and other wildlife for drinking. Playa lakes are shallow, ephemeral lakes, commonly found in the U.S. High Plains region (Osterkamp and Wood, 1987). The other stream flows 30 km until finally connecting with a larger perennial river. During the sampling events discussed in this study, the discharge and perennial streams were not connected via surface water. As recently as 2014, these streams were connected. In October 2016 the flow rate of the discharge stream and perennial river were 0.03 m3 s−1 (at site D1.4) and 8.5 m3 s−1 (near site P-2.6) (USGS, 2018), respectively. The flow rate in the perennial river was an estimated 6.7 m3 s−1 (USGS, 2018) in February 2018. Flow measurements were not taken in the discharge stream in 2018. Details on the treatment and NPDES effluent limits at this site are provided in the Supporting Information (Table S1).
Fig. 1.
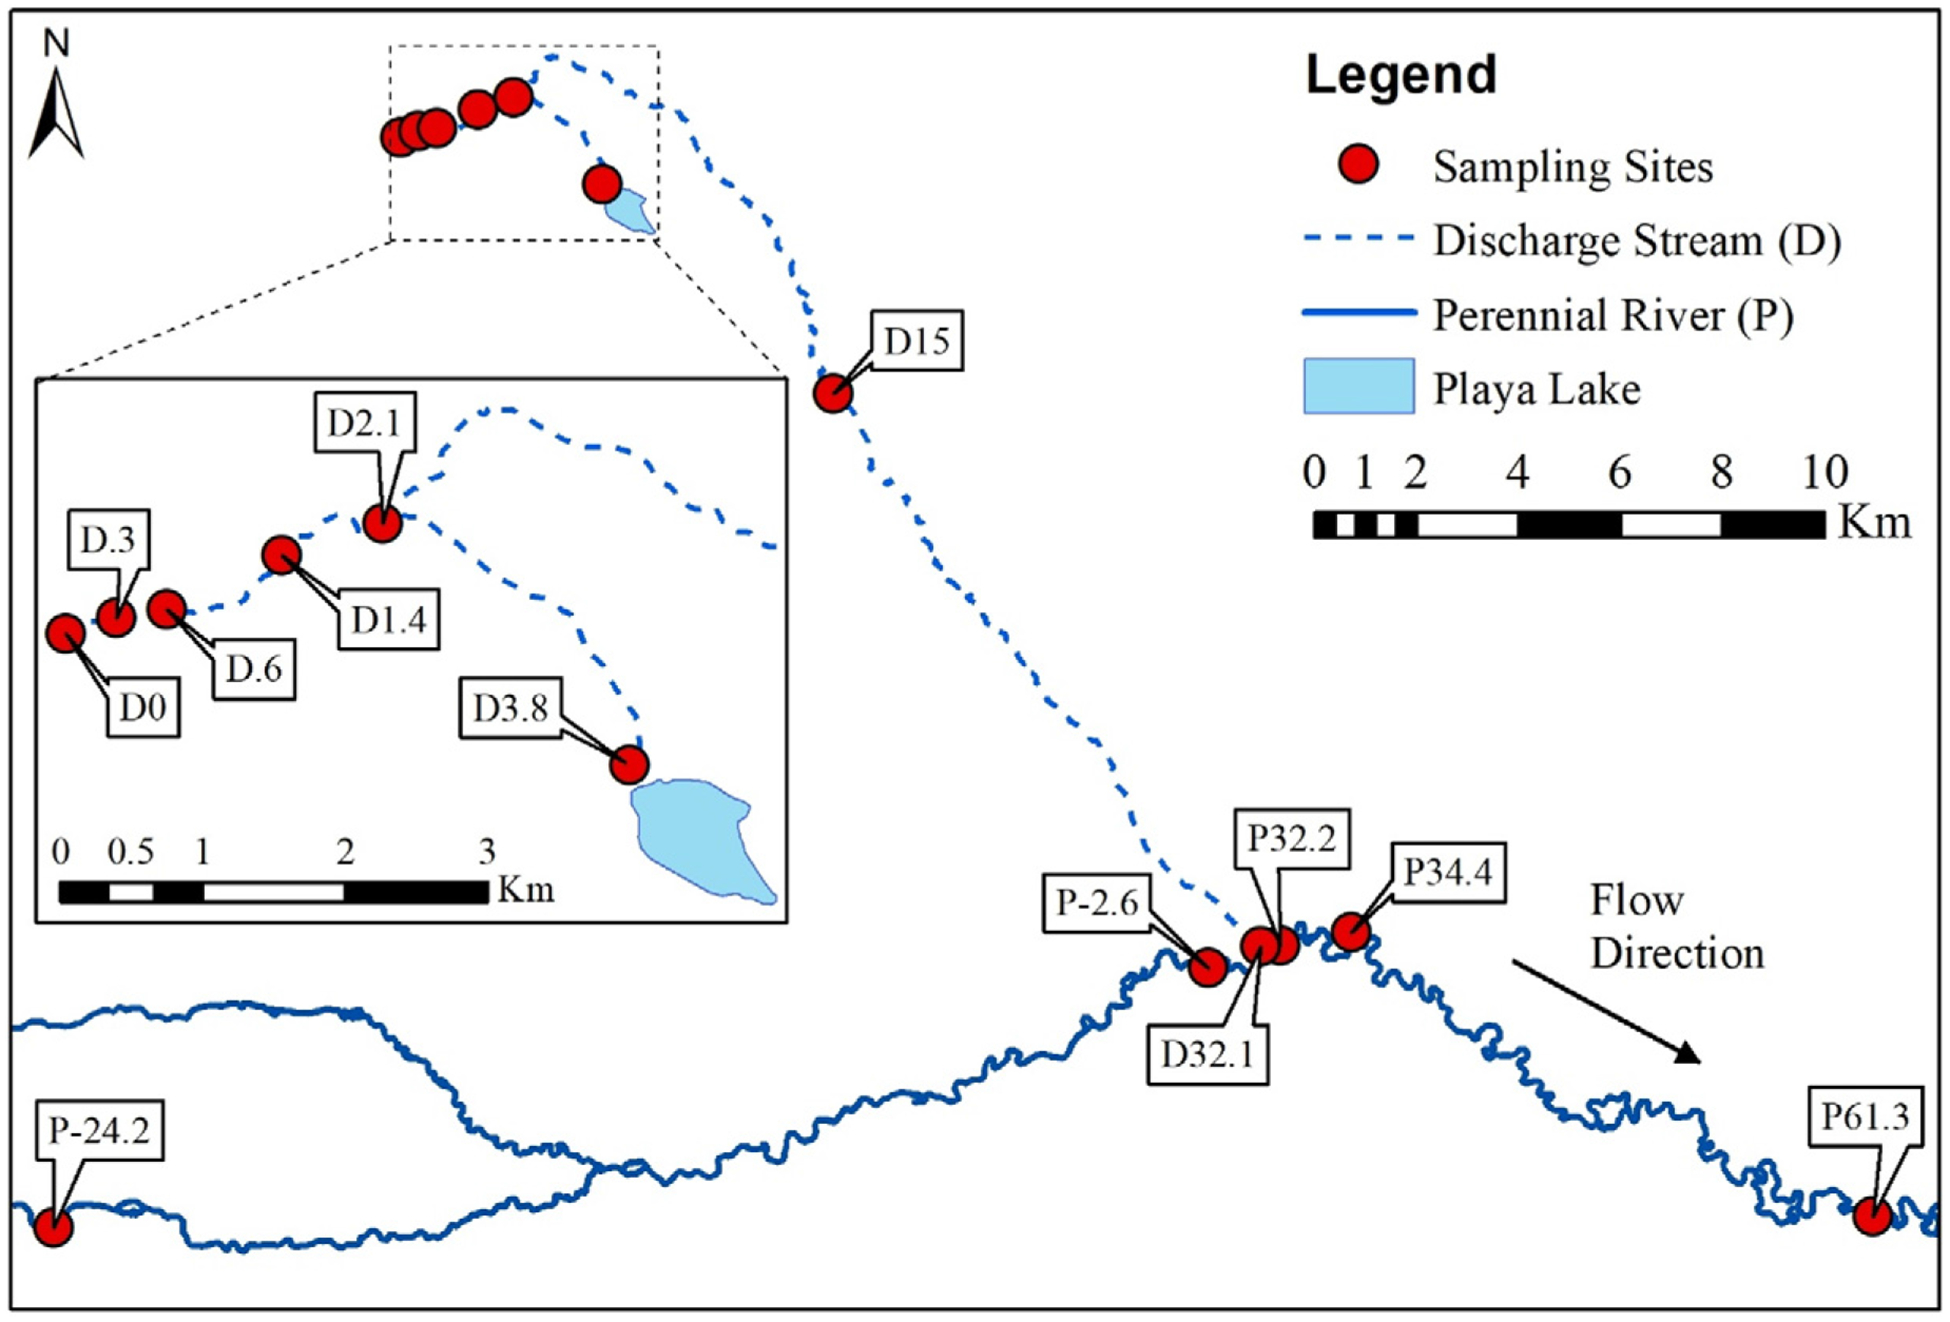
Map of sampling locations at an undisclosed well field in Wyoming. Surface water samples were collected in October 2016 and February 2018 from the discharge (ephemeral) stream (D) and perennial river (P). Site D0 was collected directly from the discharge culvert before entering the stream. All other sites were collected at the indicated distance from the discharge (e.g. D.3 was collected 0.3 km downstream). Sites prefaced with a P were collected on the perennial river, with positive values indicating samples collected downstream of the confluence between the two water bodies (e.g. P32.2 is collected on the perennial river, 32.2 km downstream of the discharge) and negative values indicating samples collected upstream of the confluence (e.g. P-2.6 is collected on the perennial river, 2.6 km upstream of the confluence).
2.2. Site sampling
Water samples were collected 11 times between 2013 and 2018 including May and November 2013, July and October 2014, July and October 2015, June, August and October 2016 and February 2018. Chronic toxicity assays were conducted in October 2016 and February 2018 and therefore this study focuses on surface water samples collected from the discharge stream (D) and perennial river (P) during those two events. Site D0 was collected directly from the discharge culvert before entering the stream. All other sites were collected at the indicated distance from the discharge (e.g. D.3 was collected 0.3 km downstream, see Table S2). Sites prefaced with a P were collected from the perennial river, with positive values indicating samples collected downstream of the confluence between the discharge stream and perennial river and negative values indicating samples collected upstream of the confluence. Chemical analysis in 2016 revealed that many carcinogenic organic chemicals were removed by site D1.4 (McLaughlin et al., 2020). As a result, samples were collected at additional locations between the discharge and the playa lake during the 2018 sampling event. Chemical composition at the discharge was relatively consistent between the two sampling events. Results of chemical analysis are provided in the Supporting Information (Tables S3 and S4). During the 2018 sampling event, one of the downstream samples (D15) was not accessible and was not sampled. Also, the control site was different between the two sampling events (P-2.6 in 2016 vs. P-24.2 in 2018). Both control sites were located upstream of the confluence between the discharge stream and perennial river and were not impacted by PW discharges. The control site in 2016 may have been impacted by anthropogenic activity in the nearby town. Therefore, in 2018, the control site was moved to a location upstream of most human activity in the region. In addition to the Wyoming field site, a water sample was collected directly from the discharge of a Fort Collins, CO wastewater treatment plant (WWTP) for the mutagenicity assays to allow for a comparison between two different types of discharge.
All samples were collected in glass bottles with Teflon-lined caps. Glassware was pre-cleaned by washing with deionized water (3×), Milli-Q water (3×) and methanol (1×) followed by baking in a furnace (400 °C for 8 h). Bottles were rinsed three times with sample water prior to collection. In the PW discharge stream, water samples were collected in the center of the stream. In the larger perennial river, samples were collected where the water was flowing freely. Samples were stored on ice in the field and refrigerated at 4 °C in the lab until analysis. Additional details on sampling locations, sampling methods and quality control can be found in the companion study (McLaughlin et al., 2020).
2.3. Daphnia magna acute toxicity assays
Acute toxicity tests were conducted with Daphnia magna. This species is also used in the acute WET tests which are required every 6 months at this NPDES site. LC50 parameters were performed approximately to standard OECD guidelines with some slight alterations (OECD, 2013). All lethality assays were static in nature. Four samples collected in both 2016 (D0, D1.4, P-2.6 and P32.2) and 2018 (D0, D1.4, P-24.2, P34.4) were assayed for lethality using a serial dilution exposure regime of concentrations 0 (control, dechlorinated City of Edmonton tap water, moderately hard), 1, 2, 5, 10, 20, and 100% of raw sample in 30 mL of solution (total). A total of 5 neonate daphnia were used per treatment dilution. In total, 3 replicates per exposure series per sample type were employed to determine neonate daphnid lethality. Daphnia survival/mortality was confirmed by observation under a Leica Zoom 2000 stereomicroscope (Leica Camera CO., GER). All ambient room conditions during exposures were identical to conditions during Daphnia magna culturing and housing, details of which can be found in the Supporting Information.
2.4. Copy number variation and point mutation assays
2.4.1. Yeast strain
Saccharomyces cerevisiae haploid strain JAY2087 (MATα ade5-1 his7-2 leu2-3,112 Leu+ ura3-52 trp1-289 CAN1 cup1Δ RSC30 sfa1Δ::hisG PLM2::SFA1-V208I-CUP1-KlURA3-ScURA3-5’SFA1-BglII-KanMX4) was engineered to measure four different types of mutations in parallel, specifically: 1) CNV amplifications, which are measured via acquisition of resistance to copper plus formaldehyde following amplification (primarily duplication) of the cassette containing the SFA1-V208I and CUP1 genes; 2) CNV deletions, which are measured via acquisition of resistance to 5-fluoroorotic acid (5-FOA) through loss of the cassette containing two diverged but functional copies of the URA3 gene; 3) forward mutations, measured via acquisition of resistance to canavanine through inactivation of the CAN1 gene through point mutation or rarely deletion; and 4) reversion point mutations, measured via acquisition of tryptophan prototrophy through reversion of a non-sense mutation present in the trp1–289 allele, or via acquisition of a non-sense suppressor in a tRNA gene also through point mutation (Zhang et al., 2013; Klein et al., 2019). The trp1–289 reversion assay is analogous to the ly-sine prototrophy reversion point mutations detected using the Ames Salmonella assay. Fig. 2 shows a schematic representation of the three chromosomes where the reporters for these assays are present.
Fig. 2.

Schematic of a portion of the chromosomal regions from the haploid yeast strain JAY2087. In the top line, a view of the region from chromosome IV where CNV reporters were inserted. The HR substrates represent direct repeats that can mediate homologous recombination leading to amplification and/or deletion of the region containing the copy number reporter genes SFA1, CUP1, KlURA3 and ScURA3. The intervening sequence present in the HR substrate on the right side is very small (6 bp BglII site), therefore is not expected to significantly influence recombination between the two substrates. This strain also contained the trp1–289 mutation, also on chromosome IV, which can revert to a functional Trp+ allele of the TRP1 gene, and was wild type for the CAN1 gene on chromosome V, which following a forward inactivating mutation can lead to resistance to canavanine.
2.4.2. Yeast assay procedure
As a first step in the mutation assays, acute toxicity assays were conducted to determine the lowest concentration of water sample, if any, that inhibited yeast growth. Recipes, chemical supplier information for liquid media and agar plates, and details of this method are provided in the Supporting Information. Sterile techniques were used throughout the study. All samples, including those collected from the field, mixtures of known composition and controls were filter sterilized using a 0.22 μm polyethersulfone (PES) filter (sterilized, low protein binding, Corning Incorporated, Corning, NY). YPD (yeast-peptone-dextrose media) was also filter sterilized using PES filters. All other media and materials were purchased sterile and/or autoclaved.
Yeast mutation assays were conducted with water samples at the highest concentration that did not visibly inhibit yeast growth, as determined in the yeast acute toxicity assays. In most cases, a second and lower concentration was also used. For 2016 samples, two concentrations were selected for all 2016 samples (50% and 25%). This included the highest concentration that did not visibly inhibit yeast growth (50%) and a lower concentration (25%). For the 2018 samples, growth inhibition was observed in the discharge sample (D0) at concentrations above 10%. As a result, all 2018 assays were conducted with 10% sample. In downstream samples where growth was not visibly inhibited at any concentration, assays were conducted with 80%.
For the yeast mutation assays, a patch JAY2087 YPD plate was made as described in the acute toxicity assays and allowed to incubate for 1–2 days. Yeast was streaked from the patch plate to single colonies on a YPD plate and incubated at 30 °C for 18 h. Following the incubation period, single colonies from the YPD plate were inoculated into 4 mL liquid YPD cultures with two different concentrations of each water sample, when appropriate. The culture tubes were placed on a rotating drum at 30 °C, until saturation was reached as determined on a spectrophotometer (~22 h). Once the cultures reached saturation, a 1 mL aliquot was removed from each culture and washed twice with sterile double-distilled water. Aliquots of the washed yeast were then plated on non-selective (YPD) and each of selective plates required for the individual mutation assays using autoclaved glass beads at the volumes and dilutions shown in Table 1. Plates were incubated at 30 °C for the time listed in Table 1. In total, there were 11 independent culture replicates of each sample at each concentration. Negative control (YPD and double-distilled water) and positive control cultures (YPD, double-distilled water and 10 mg/L methyl methanesulfonate (MMS)) were also included. The concentration of MMS (10 mg/L) was determined following the yeast acute toxicity assay procedure.
Table 1.
Volume, dilution and incubation time for non-selective (YPD) and selective plates used in yeast mutation bioassay.
| Plate | Volume plated (|iL) | Dilution | Incubation time (d) |
|---|---|---|---|
| YPD | 150 | 10−5 | 2 |
| Copper formaldehyde | 150 | 10−1 | 5 |
| 5-FOA | 150 | 10−1 | 3 |
| Canavanine | 200 | undiluted | 3 |
| Tryptophan drop out | 600 | undiluted | 4 |
In addition to samples collected from the field site, a municipal waste water treatment plant (WWTP) effluent sample from Fort Collins, CO was also analyzed. This sample was included because WWTP effluent is a discharge that people are more familiar with and therefore will help put these findings in perspective. Additionally, similar to NPDES PW discharges, the exact composition of the WWTP effluent is unknown. Previous studies have shown that treatment methods are often ineffective at removing emerging contaminants from these discharges (e.g. pharmaceuticals) and WWTP effluents have been linked with increased mutagenicity downstream, along with other chronic toxicity endpoints (Ohe et al., 2004; Buckley, 2010). Mutation assays are commonly used to assess chronic toxicity in WWTP and therefore are a reasonable way to compare these two effluents.
2.4.3. Toxic mixtures of known composition
Toxic mixtures of known composition were analyzed with the yeast mutation assay to investigate the specific source of any mutation rate changes at the NPDES PW discharge. Chemical mixtures included a benzene, toluene, ethylbenzene and xylenes (BTEX) mixture; a mixture that contained all organic chemicals defined by International Agency for Research on Cancer (IARC) and U.S. EPA to be known, probable and possible carcinogens (Table 3); and a salt control. These mixtures were chosen because negative health effects associated with PW have been attributed to both the organic fraction and salts (Folkerts et al., 2017a; He et al., 2017a, 2017b). Chemical concentrations were equivalent to concentrations measured at the NPDES PW discharge in 2016. Chemical analysis of the water samples was conducted in a companion study (McLaughlin et al., 2020) and data is provided in the Supporting Information (Tables S3 and S4). During the 2016 sampling event, a duplicate sample was collected at the discharge, so the average value between the two samples was used to create the mixture of known composition. Additionally, in some cases, multiple methods were used to analyze the same species (e.g. naphthalene) and these results were averaged where applicable. The BTEX mixture contained 14.6 μg/L benzene, 6.5 μg/L toluene, 6.6 μg/L ethylbenzene, 8.4 μg/L m,p-xylene, and 8.2 μg/L o-xylene. The organic carcinogen mixture contained 0.56 μg/L 1,2-dichloroethane, 2.4 μg/L 2-methylphenol, 0.93 μg/L 4-methyl-2-pentanone, 14.6 μg/L benzene, 6.6 μg/L ethylbenzene, 0.63 μg/L isopropylbenzene, and 11.4 μg/L naphthalene. At the time of analysis, methyl acrylate was listed by the IARC as “not classifiable as to its carcinogenicity to humans” and was not included in the mixture. It has since been designated “possibly carcinogenic to humans.” The salt control was made by mixing a 2016 NPDES discharge sample with 5 g/L activated carbon overnight (He et al., 2017a). Benzene, toluene, ethylbenzene, m-xylene, o-xylene, p-xylene, 1,2-dichloroethane and 2-methylphenol were purchased from Fisher Scientific. Isopropylbenzene and 2-methyl-2-pentanone were purchased from Sigma Aldrich. All chemicals were >98% purity. Assays were conducted in cultures containing 25% and 50% concentration of these mixtures to reflect 2016 assay procedures.
Table 3.
Toxicological data for organic chemicals detected in the discharge stream.
| Chemical species | Highest conc. Observed (μ g/L) | SL/MCL (μg/L)b | RfDc (mg/kg-day) | Evidence for toxicityd | Carcinogenic evaluation | CCLg | |
|---|---|---|---|---|---|---|---|
| IARCe | EPAf | ||||||
| 1,2,4-Trimethylbenzene | 6.45 | 56/– | 0.01 | RT, CT, SCT, DT, AT | - | - | 1,2 |
| 1,2-Dichloroethane | 0.56 | 0.17/5 | 0.006 | RT, CT, SCT, AT, NT | 2B | B2 | - |
| 1,3,5-Trimethylbenzene | 1.07 | 60/– | 0.01 | RT, CT, SCT, DT, AT, NT | - | - | - |
| 1-Methylnaphthalene | 6.92 | 1.1/– | 0.07 | RT, CT, SCT, AT, NT | - | - | - |
| 2,4-Dimethylphenol | 6.57 | 360/– | 0.02 | RT, CT, SCT, AT | - | - | - |
| 2-Butanone | 13.4 | 5600/– | 0.6 | RT, CT, SCT, AT | - | - | - |
| 2-Butoxyethanol | 1.28 | 2000/– | 0.1 | RT, CT, SCT, DT, AT, SAT | 3 | - | - |
| 2-Methylnaphthalene | 5.96 | 36/– | 0.004 | RT, CT, SCT, AT, NT | - | - | - |
| 2-Methylphenol | 2.41 | 930/– | 0.05 | RT, CT, SCT, DT, AT | - | C | 1,2 |
| 4-Methyl-2-pentanone | 0.93 | 6300/– | - | RT, CT, SCT, AT | 2B | - | - |
| Acetone | 49.8 | 14,000/– | 0.9 | RT, CT, SCT, AT | - | - | - |
| Benzene | 14.6 | 0.46/5 | 0.004 | RT, CT, SCT, AT | 1 | A | - |
| Bis(2-ethylhexyl) phthalate | 5.13a | 5.6/6 | 0.02 | RT, CT, SCT, DT, AT, SAT | 2B | B2 | - |
| Carbazole | 3.03 | –/– | - | CT, SCT, AT | 2B | - | - |
| Carbon disulfide | 50.9a | 810/– | 0.1 | RT, CT, SCT, AT | - | - | - |
| Diesel range organics | 1555 | –/– | - | - | - | - | - |
| Ethylbenzene | 6.6 | 1.5/700 | 0.1 | RT, CT, SCT, AT, SAT, NT | 2B | D | - |
| Isopropylbenzene | 0.63 | 450/– | 0.1 | CT, SCT, DT, AT | 2B | D | - |
| Methyl Acrylate | 0.92 | 42/– | - | CT, SCT, AT | 2B | D | - |
| Naphthalene | 11.4 | 0.17/– | 0.02 | RT, CT, SCT, DT, AT, SAT | 2B | C | 1 |
| Nonylphenol Ethoxylates | 12h | - | - | RT, CT, SCT, AT | - | - | - |
| n-Propylbenzene | 0.8 | 660/- | 0.1 | CT, SCT, AT, NT | - | - | 3,4 |
| Phenanthrene | 1.34 | –/– | - | RT, CT, SCT, AT | 3 | D | - |
| Phenol | 1.03 | 5800/– | 0.3 | RT, CT, SCT, DT, AT, NT | 3 | - | - |
| Polyethylene Glycols | 9h | - | - | CT, SCT, AT | - | - | - |
| Polypropylene Glycols | 9h | - | - | CT, SCT, AT | - | - | - |
| Toluene | 6.49 | 1100/1000 | 0.08 | RT, CT, SCT, AT, NT | 3 | - | - |
| TPH as Gasoline | 155.5 | –/– | - | - | - | - | - |
| Xylenes | 20.35 | 190/10,000 | 0.2 | RT, CT, SCT, AT | 3 | − | − |
Maximum concentration was observed at a sampling site other than the discharge.
Screening level (SL) for tap water and maximum contaminant level (MCL). SLs are reported with Target Hazard Quotient (THQ) = 1 (Williams et al., 2017).
RfDo = Reference Dose for Oral Exposure (Williams et al., 2017).
Evidence for toxicity obtained from EPA CompTox, (RT = reproductive toxicology; CT = chronic toxicology; SCT = subchronic toxicology; DT = developmental toxicology; AT = acute toxicology; SAT = subacute toxicology; NT = nuerotoxicology) (Williams et al., 2017).
IARC = International Agency for Research on Cancer (1 = carcinogenic to humans; 2A = probably carcinogenic to humans; 2B = possibly carcinogenic to humans; 3 = not classifiable as to its carcinogenicity to humans; 4 = probably not carcinogenic to humans).
EPA (A = carcinogenic to humans; B = probably carcinogenic to humans; C = Possibly carcinogenic to humans; D = not classifiable as to human carcinogenicity; E = evidence of noncarcinogenicity).
CCL = Contaminant Candidate List. Estimated concentrations.
2.4.4. Estimation of mutation rates
An Interscience Scan 300 was used for automated colony counting toensure consistency between plates. The total number of viable cells (Nt) in each culture was calculated from the number of colonies that grew on the nutrient rich, permissive YPD plates, with a correction for plating volume and dilution (Table 1). The number of mutant cells (r) was calculated from the number of colonies on each of the four different selective plates, with appropriate correction for the respective plating volume and dilution for each mutation (Table 1). Median mutation rates and 95% confidence intervals were calculated using the Lea-Coulson (LC) method of the median, with minor modifications detailed in Hall et al. (2009) (Lea and Coulson, 1949; Hall et al., 2009). The 95% confidence intervals around the median are displayed in the figures to indicate the width of the distribution of mutation rates for all cultures for each condition, but not for determination of statistical significance between samples and concentrations (see below). Mutation assays are inherently variable because of the stochastic nature of mutation accumulation in cultures over time, therefore for the same treatment, some cultures typically experience few mutations while others experience many. This is normal and explains why the median rate is used to represent the overall results. It is routine and expected to have relatively wide 95% confidence intervals for these types of measurements. Finally, a relative mutation rate was calculated for each mutation type at each site by dividing the median mutation rate (M) at each site by the median mutation rate for the respective negative control (e.g. (relative median mutation rate for CNV duplications at site D0) = (median mutation rate for CNV duplications at site D0)/(median mutation rate for CNV duplications in the negative controls)). Relative mutation rate analyses permit convenient comparison between concentrations and sampling distances for each the four types of mutation classes measured. The absolute rates vary by orders of magnitude between assays. The mutation rate changes are only comparable within assays, not between.
Statistical analysis for mutation rates was conducted using the Kruskal-Wallis test, a non-parametric test, with the Benjamini-Hochberg adjustment for multiple comparisons. All data for each sampling event were analyzed at once (2016: sampling sites, negative control, mixtures and WWTP; 2018: sampling sites). With the Benjamini-Hochberg adjustment, samples with p < 0.025 are considered statistically different. Results of the statistical analysis are presented in the figures as letters above each bar. In these figures, samples with different letters are statistically different from each other. When comparing the mutation rates associated with two different treatments, the statistical call is made based on the differences in the distribution of all measurements (Kruskal-Wallis test), not based on overlap between 95% confidence intervals. It is entirely possible (and typical for mild mutagenic stimulations of 2–3 fold, like those found here) to conclude that there is a significant difference in mutation induction between treatments, even though the 95% CI distributions may overlap. To determine if there was a trend with decreasing mutagenicity with increasing distance from the discharge point, we ran a simple linear regression on the 2016 samples at 50% concentration. We included the discharge (D0) and three sites downstream of the discharge (D1.4, D15, and P32.2). Slopes with significant p-values (p < 0.05) were considered to be significantly different from data having no slope, and therefore showing a trend.
2.5. Zebrafish developmental toxicity assays
A Danio rerio (zebrafish) developmental toxicity assay was used to evaluate four samples collected in 2016 (D0, D15, P-2.6 and P32.2) to assess potential adverse developmental and neuro-behavioral impacts of the water samples (Truong et al., 2014). Analyses included mortality and morphology effects (from 6 to 120 h post-fertilization; hpf), a 24 hpf embryo photometer response behavior (EPR), 120 hpf larval photometer response behavior (LPR) (Truong et al., 2011; Reif et al., 2016). Detailed methods for these analyses can be found in the Supporting Information. Table S7 lists the three different assays used in this study including samples and concentrations that were analyzed using each assay.
3. Results and discussion
3.1. Daphnia magna acute toxicity studies
The NPDES permit requires acute WET tests to be conducted with Daphnia magna and Pimephales promelas every 6 months at this site. Four of the samples collected in 2016 (D0, D1.4, P-2.6, P32.2) and 2018 (D0, D1.4, P-24.2, P34.4) were assayed for lethality using Daphnia magna and a serial dilution exposure regime of concentrations 0, 1, 2, 5, 10, 20, and 100% of each water sample in 30 mL of solution (total). In the analyses conducted with samples from 2016, all daphnia were alive after the 48-hour exposure and no lethality could be determined (Table S8). For the samples collected in 2018, lethality was low and calculations of a LC50 for each individual field-collected sample were unable to be performed (Table 2). Sample D1.4 (1.4 km downstream of the NPDES discharge, located on the discharge stream) had on average 60% mortality in undiluted conditions, while variable, low-level toxicity was observed across dilutions in sample P34.4 (34.4 km downstream of the NPDES discharge, located on the perennial stream). In general, however, undiluted samples had negligible effects on acute toxicity (Table 2). The results from the discharge samples (D0) agree with acute WET tests conducted by the operators, which reported no violations during these sampling events. Previous studies have shown that acute exposure of PW to aquatic organisms, such as rainbow trout and zebrafish, can result in chronic toxicity (e.g. oxidative stress and gill morphology) in organisms where lethality is not observed (Blewett et al., 2017; Folkerts et al., 2017a). Thus, the low lethality observed in this assay does not rule out that Daphnia magna may have experienced chronic impacts from PW exposure (Blewett et al., 2018).
Table 2.
Daphnia magna neonate lethality results in 2018 discharge stream (D) and perennial river (P) samples following 48 h exposures.
| Site | D0 | D1.4 | P-24.2 | P34.4 | ||||
|---|---|---|---|---|---|---|---|---|
| Exposure dilution | mortality (%) | σ (%) | mortality (%) | σ (%) | mortality (%) | σ (%) | mortality (%) | σ (%) |
| 0% | 0 | 0 | 0 | 0 | 0 | 0 | 0 | 0 |
| 1% | 0 | 0 | 0 | 0 | 0 | 0 | 6.66 | 11.55 |
| 2% | 0 | 0 | 0 | 0 | 0 | 0 | 0 | 0 |
| 5% | 0 | 0 | 0 | 0 | 0 | 0 | 6.66 | 11.55 |
| 10% | 0 | 0 | 0 | 0 | 0 | 0 | 0 | 0 |
| 20% | 0 | 0 | 0 | 0 | 0 | 0 | 6.66 | 11.55 |
| 100% | 0 | 0 | 60 | 0 | 0 | 0 | 6.66 | 11.55 |
3.2. Yeast copy number variation and point mutation assays
3.2.1. October 2016 samples
Mutagenicity assays were conducted in yeast cells exposed to samples collected at the NPDES discharge and downstream. For samples collected in October 2016, mutation assays for all sites were conducted with both 50% and 25% sample concentration and the results of all four yeast assays conducted with 50% water samples are presented (Fig. 3). Additional data for the 25% cultures are presented in the Supporting Information (Fig. S3). Similar trends were observed in experiments conducted with 25% sample. Mutation rates and differences between sites were generally lower in 25% cultures, most likely due to lower chemical concentrations.
Fig. 3.

Relative median mutation rate for Copy Number Variation (CNV) duplications, CNV deletions, forward point mutations, and reversion point mutations in 2016 discharge stream (D) and perennial river (P) samples. Experiments were conducted with 50% water sample. Median mutation rates are displayed relative to the negative control (NC) set as a 1× reference. Error bars show 95% confidence intervals. Letters show the statistical groupings. Samples that do not share letters are significantly different (p < 0.025).
The results of the CNV duplication, CNV deletion assay, forward point mutation and reversion point mutation assays conducted at 50% sample concentration are shown in Fig. 3. In assays conducted with sample from the NPDES discharge, a robust increase in CNV duplication rate was observed, which was significantly increased as compared to the negative control (NC) (5.6-fold, p < 0.0000). Mutation rate decreased with distance downstream but remained elevated in samples D1.4 and D15 as compared to the negative control (3.4- and 2.0-fold; p = 0.0001 and 0.0162, respectively). Furthermore, when considering sites D0, D1.4, D15, and P32.2, the data show a slope of −0.122 (p = 0.0102) from a simple linear regression of mutagenicity on distance from NPDES discharge (Table S9). CNV duplication rate for the positive control (10 mg/L MMS) was 3.3-fold increase as compared to the negative control (NC) (data not shown).
In the remaining three assays (CNV deletions, forward point mutation and reversion point mutation), a significant increase in mutation rate was observed at the discharge, however, this increase was more modest (Fig. 3; CNV deletion: 2.3-fold, p = 0.0015; forward point mutation: 1.3-fold, p = 0.0102; reversion point mutations: 2.4-fold, p =0.0024). For all three assays, linear regression of mutagenicity on distance from NPDES discharge (0, 1.4, 15, and 32.2 km) show significant negative slopes (slope = −0.828, p = 0.0188; slope = −0.0909, p =0.00191; slope = −0.0284, p = 0.0264. respectively; Table S9), suggesting a trend of mutation rate decreasing with distance from the discharge point. Despite the statistical significance, we remain cautious about interpretation of results at D1.4 and D15 for these assays since the range of mutagenicity stimulation between D0 and NC was small. For the positive control (10 mg/L MMS), CNV deletion rate was 1.8-fold, forward point mutation rate was 2.1-fold and, reversion point mutation rate was 2.3-fold increase as compared to the NC (data not shown). Preliminary tests were also conducted using the Salmonella Ames test, which is analogous to the trp1–289 reversion point mutation yeast assay conducted in this study. A minimal increase in mutation rate was observed at the discharge point (D0: 1.2-fold increase; data not shown), agreeing with the results of the yeast assay.
Significant differences in mutation rate were not observed between the upstream (control site) and downstream sites on the perennial river (P-2.6 and P32.2), with the exception of reversion point mutations (Fig. 3). Differences were not expected since the two streams were not connected via surface water at the time of sampling and suggest that the discharge stream did not significantly impact mutation rate in the perennial river. It was important to assess, however, since the two streams connect during times of increased discharge and decreased evaporation. Chemicals found in the discharge can sorb to sediments (e.g. nonylphenol ethoxylates), which may increase toxicity even when flow rates are lower (Burgos et al., 2017).
Mutation rates generally followed the trend observed for organic chemicals in the discharge stream. As shown in the companion study, concentrations of organic chemicals were highest at the NPDES PW discharge and decreased with distance downstream (McLaughlin et al., 2020). Table 3 lists organic chemicals detected in the discharge stream, including 8 detected at the discharge in 2016 that have been determined by the U.S. EPA and IARC to be known, probable or possible carcinogens. Since most mutagens are likely carcinogens, it is reasonable to compare mutation rate trends over distance to the environmental fate of carcinogens detected at the discharge. Of the 8 carcinogens detected in the 2016 NPDES PW discharge, 6 were below detection limit by site D1.4, including 1,2-dichloroethane, 4-methyl-2-pentanone, benzene, ethylbenzene, isopropylbenzene and methyl acrylate (Table S3; McLaughlin et al., 2020). Both 2-methylphenol and naphthalene persisted farther and were present at D1.4 but below detection limit by site D15. At the discharge (D0), four of the carcinogenic organic chemicals were present above the maximum contaminant level (MCL) and/or screening level for tap water including 1,2-dichloroethane, benzene, ethylbenzene and naphthalene. It should be noted that the holding time for these samples was six months. Over this time some of the organic contaminants were likely degraded, which may have affected the results of these assays. As discussed in the section regarding the February 2018 samples, however, the impacts of this holding time on the mutagenicity assay is hard to elucidate.
Five of the inorganic chemicals detected in the NPDES discharge are IARC or EPA known, probable or possible carcinogens including arsenic, cadmium, lead, silica (inhalation route) and radium (Table 4). Only radium concentrations decreased with distance downstream, thereby following the trend observed in mutation rates (Table S4; McLaughlin et al., 2020). Radium was also present above the MCL at the discharge (McDevitt et al., 2019). Arsenic, cadmium and lead were not detected at the NPDES discharge but were detected downstream, suggesting that these species were already present in the soil or were concentrated due to evaporation downstream (Table S4; McLaughlin et al., 2020).
Table 4.
Toxicological data for inorganic chemicals detected in the discharge stream.
| Chemical species | Highestconc. observed (μg/L) (location)a | MCLb (μg/L) | RFDd (mg/kg-day) | Evidence for toxicitye | Carcinogenic evaluation | CCLh | |
|---|---|---|---|---|---|---|---|
| IARCf | EPAg | ||||||
| Aluminum | 1860 (D2.1) | 50c | 1 | RT, CT, SCT, AT | - | - | 1,2 |
| Ammonia as N | 364.5 | - | - | RT, CT, SCT, AT | - | - | - |
| Antimony | 0.5 (D2.1) | 6 | 0.0004 | CT, SCT, AT | - | - | - |
| Arsenic | 3.6 (D3.8) | 10 | 0.0003 | RT, CT, SCT, AT | 1 | A | - |
| Barium | 140 | 2000 | 0.2 | CT, SCT, AT | - | D, E | - |
| Boron | 1310 (D15) | - | 0.2 | RT, CT, SCT, AT, SAT | - | - | 1,2 |
| Cadmium | 0.2 (D2.1) | 5 | 0.0005 | RT, CT, SCT, AT | 1 | B1 | - |
| Calcium | 75,700 (D15) | - | - | CT, SCT, AT | - | - | - |
| Chloride | 251,000 (D15) | 250,000c | - | CT, SCT, AT | - | - | - |
| Fluoride | 2910 (D2.1) | 2000c | 0.04 | CT, SCT, AT | 3 | - | - |
| Iron | 2620 (d2.1) | 300c | 0.7 | CT, SCT, AT | - | - | - |
| Lead | 3.2 (D2.1) | 15 | - | RT, CT, SCT, AT | 2B, 2A | B2 | - |
| Magnesium | 51,800 (D15) | - | - | CT, SCT, AT | - | - | - |
| Manganese | 229 (D3.8) | 50c | 0.14 | RT, CT, SCT, AT | - | D | 1,4 |
| Molybdenum | 84.9 (P34.4) | - | 0.005 | CT, SCT, AT | - | - | 3,4 |
| Potassium | 30,300 (D15) | - | - | CT, SCT, AT | - | - | - |
| Selenium | 12.8 (D15) | 50 | 0.005 | CT, SCT, AT | 3 | D | - |
| Silica | 39,900 (D2.1) | - | - | RT, CT, SCT, DT, AT, SAT | 1,3 | - | - |
| Sodium | 454,000 (D15) | - | - | RT, CT, SCT, AT | - | - | 1 |
| Strontium | 4805 | - | 0.6 | CT, SCT, AT | - | - | 3 |
| Sulfate | 939,000 (D15) | 250,000c | - | CT, SCT, AT | - | - | 1 |
| Total dissolved solids | 500,000 | - | - | - | - | ||
| Uranium | 5.2 (P61.3) | 30 | - | CT, SCT, AT | - | - | - |
| Vanadium | 24.3 (D15) | - | 0.005 | CT, SCT, AT | - | - | 1,2,3,4 |
| Zinc | 67.3 (P34.4) | 5000c | 0.3 | RT, CT, SCT, AT | - | - | - |
| Radium-226 & Radium-228 | 0.503 Bq/L | 0.185 Bq/L | CT | 1 | − | − | |
Location if other than discharge.
Maximum Contaminant Level (MCL) (Williams et al., 2017).
National Secondary Drinking Water Regulation.
RfDo = Reference Dose for Oral Exposure (Williams et al., 2017).
Evidence for toxicity obtained from EPA CompTox, (RT = reproductive toxicology; CT = chronic toxicology; SCT = subchronic toxicology; DT = developmental toxicology; AT = acute toxicology; SAT = subacute toxicology; NT = nuerotoxicology) (Williams et al., 2017).
IARC = International Agency for Research on Cancer (1 = carcinogenic to humans; 2A = probably carcinogenic to humans; 2B = possibly carcinogenic to humans; 3 = not classifiable as to its carcinogenicity to humans; 4 = probably not carcinogenic to humans).
EPA (A = carcinogenic to humans; B = probably carcinogenic to humans; C = possibly carcinogenic to humans; D = not classifiable as to human carcinogenicity; E = evidence of non-carcinogenicity).
CCL = Contaminant Candidate List.
In an effort to put the PW discharge results into perspective, a WWTP effluent sample from Fort Collins, CO was analyzed. In all four mutation assays, the rate of mutation in the WWTP sample was not significantly increased as compared to the NC (Table S10). This contrasts with the PW discharge, which showed a significant increase in all four mutation rates as compared to the NC.
3.2.2. Toxic mixtures of known composition
Assays were conducted with mixtures of known composition to in vestigate the specific compounds responsible for the detected increase in mutation rates, focusing particularly on the CNV duplications, due to the robust increase in this mutation in the discharge samples. Results for the other three assays were also collected in parallel given the design of this yeast strain. The three known mixtures tested included a BTEX mixture; IARC and U.S. EPA organic carcinogens (Table 3); and a salt control. The discussion below focuses on assays conducted with chemical concentrations equal to 50% of that detected at the discharge in 2016 (Fig. 4). Experiments were also conducted at 25% concentration (Fig. S5) and showed similar trends.
Fig. 4.

Relative mutation rate for copy number variation (CNV) duplications, CNV deletions, forward point mutations, and reversion point mutations of discharge sample (D0), BTEX mixture, carcinogen mixture (Carc) and salt control relative to the negative control (NC). Experiments were conducted with 50% water sample. Median mutation rates are displayed relative to the negative control (NC) set as a 1× reference. Error bars show 95% confidence intervals. Letters show the statistical groupings. Samples that do not share letters are significantly different (p < 0.025).
The rates of CNV duplication in cells exposed to the known mixtures were not significantly altered relative to the negative control, while mutation rate in the discharge sample was elevated by 5.6-fold (Fig. 4). These results suggested that either the chemical(s) responsible for the increase CNV duplication rate was absent in the mixtures, or that these chemical groups must act through a synergistic mechanism. Similar to the results from the CNV duplication assays, CNV deletion, forward point mutation and reversion point mutation rates in the mixtures were low and generally showed no significant difference as compared to the NC (Fig. 4).
The toxicity of many organic chemicals in PW is unknown and therefore, it is possible that some of the chemicals detected at the discharge are mutagens but were not included in the carcinogen mixture. One potential source of mutagenicity is other organic chemicals in the mixture including diesel range organics and organic well maintenance chemicals (e.g. nonylphenol ethoxylates). Previous studies have attributed increases in chronic toxicity to the organic fraction of PW, however the present study chose to focus on more specific chemicals (Folkerts et al., 2017b). Additionally, due to the complex nature of PW, mutagenic chemicals may be present in the water, but not identified during analysis. This includes chemicals that are below detection limit due to low concentration or matrix effects in the fluid (Oetjen et al., 2017). It also includes chemical additives that are not disclosed in the permits and therefore are more challenging to identify. These issues are further compounded by mixture effects. Studies have shown synergistic toxic effects in mixtures of PW chemicals (Kassotis et al., 2015). Synergistic toxicity has also been observed in mixtures containing more than two polycyclic aromatic hydrocarbons (PAHs) (Alnafisi et al., 2007), which is true for the discharge sample. It is also possible that a mixture containing the carcinogens and salts would have resulted in higher mutation rates.
3.2.3. February 2018 samples
Yeast mutation assays were conducted with samples collected in 2018 to determine if toxicity changed over time (Fig. S4). In 2018, growth inhibition at the NPDES discharge (D0) was observed at concentrations above 10%. As a result, all studies were conducted with 10% water sample in each yeast culture. In all four assays, there were no major trends in mutation rate over distance. For some sites, mutation rate was significantly increased as compared to the negative control only, however, even in these instances the mutation rate increases were mild. Due to a lack of trend in the mutation data, there is no clear relationship that can be made to the chemical data.
Increases in mutation rate were lower in 2018 than in the 2016 samples conducted at 50% and 25% concentration. This was expected since a lower concentration of sample (10%) was used in the 2018 yeast cultures. For example, in the CNV duplication assays conducted with 10% sample, mutation rate increases ranged between 1.6-fold (D0) and 2.7-fold (D1.4) as compared to the negative control (Fig. S4). This is lower than what was observed at the NPDES discharge in assays conducted with 50% sample (5.6-fold increase) and 25% sample (4.5-fold increase) in 2016. It is possible that similar trends and rates of mutation would have been observed in the 2018 samples if acute growth inhibition did not prevent assays from being conducted at higher concentrations. It also suggests that growth inhibition and mutagenicity are likely caused by different agents in the complex mixtures.
No major differences in chemical composition at the discharge between 2016 and 2018 were observed that could explain this difference in acute toxicity (Tables S3 and S4; McLaughlin et al., 2020). It is possible that the differences are seasonal and therefore temperature dependent. Daytime air temperatures in October 2016 ranged from 4.5 °C to 13 °C, while daytime air temperatures in February 2018 ranged between −12 °C to −4 °C. Solubility of hydrogen sulfide and other gases increases at lower temperatures. Although it was not quantified, H2S was detected in the air by meters worn during sampling. Due to the lower temperatures, it was likely present at higher concentrations in the 2018 water samples. H2S is a deadly gas and known yeast growth inhibitor, but has not been defined as a carcinogen by either EPA or IARC (Spiropoulos and Bisson, 2000; ATSDR, 2016). Therefore, it is possible that in order to dilute the H2S below acute toxicity levels, the chronic toxins were no longer present at concentrations high enough to result in significant increases in mutation rate. Another explanation for this result is that the holding time for the 2016 samples was longer than for the 2018 samples (6 months vs. 1.5 months). All chemical analyses were conducted within standard EPA holding times so it is possible that concentrations of chemicals, many of which can exhibit acute toxicity (Tables 3 and 4), were lower in the 2016 samples at the time of analysis. This is true for H2S as well as other volatile organic compounds. Finally, it is possible that the standard chemical analysis does not reveal all toxic chemicals present at the discharge. No conclusions can be made on how consistent concentrations of undetected chemicals were over time. Overall, however, this shows that acute toxicity of the NPDES discharge and stream may change with time.
3.3. Zebrafish developmental toxicity assays
Zebrafish assays were conducted on these water samples to assess developmental toxicity. These assays analyzed for early stage developmental toxicity by quantifying a 24-hour post-fertilization (hpf) Embryo Photomotor Response (EPR) behavior and 120 hpf Larval Photomotor Response (LPR) behavior as well as mortality and morphology effects. No significant impacts were observed in the behavior studies. Additionally, there were no significant incidences of mortality or malformation observed in any of the water samples (Fig. S6 and Table S11). The lack of responses may be because holding time before toxicity testing was 10 months. Due to the extended holding time, it is likely that concentrations of organic chemicals decreased during this time. Previous studies have observed significant changes in LPR when zebrafish are exposed to PAHs, including carbazole, naphthalene, 1-methylnaphthalene and 2-methylnaphthalene, which were all present in the PW discharge (Geier et al., 2018). Thus, it is possible that different results would have been observed if holding time was decreased. Previous studies have observed developmental toxicity in zebrafish exposed to metals, including arsenic, cadmium and aluminum, all of which were detected in the PW discharge stream (Beaver et al., 2017; Dipp et al., 2018; Capriello et al., 2019). This indicates that concentrations of these species were not high enough in the samples analyzed to increase EPR and LPR in zebrafish.
4. Conclusion
A toxicological analysis was conducted on a NPDES PW discharge and stream released for agricultural beneficial reuse. In addition to permit effluent limits based on chemical concentrations, NPDES PW releases in Wyoming require acute toxicity testing once every 6 months, but no chronic toxicity testing. In this study, acute toxicity was assessed using Daphnia magna. Lethality was low in all samples, however, it appeared higher in 2018 versus 2016 samples. A yeast-based mutation assay was used to analyze four different types of mutation – CNV duplications, CNV deletions, forward point mutations and reversion point mutations. In all mutation assays, higher rates of mutation were observed at the discharge (D0) and decreased with distance downstream. This was most prominent for CNV duplications. A similar trend was observed for the concentrations of IARC and EPA known, probable and possible carcinogens detected in the stream (e.g. benzene, naphthalene, radium). Mixture studies showed that untested chemical(s) or chemical mixtures were responsible for increased rates of CNV duplication; thus, the best treatment strategy to decrease this toxicity remains unknown. Finally, zebrafish assays revealed no increase in developmental toxicity in the water samples.
This study is the first attempt to evaluate the toxicity of NPDES PW releases for beneficial reuse. It is important to note that most chemicals at this site were present at relatively low concentrations compared to other PWs in the western U.S. Therefore, the results of this study cannot be applied to all NPDES PW discharges. NPDES PW releases in other geologic formations need to be analyzed to understand toxicological differences. During preparation of this manuscript, access was granted to two additional NPDES PW discharges in the area, one of which has failed the acute WET test multiple times in the past 3 years. Preliminary chemical analysis at the site revealed that volatile organic compounds (VOCs) are present at concentrations 2 orders of magnitude higher than at the focus discharge in this study (Table S12). It is expected that increased concentrations of VOCs would increase both acute and chronic toxicity.
Federal agencies, including the U.S. Department of Energy, are interested in developing treatment strategies to increase beneficial reuse. To assess the efficacy of these treatment strategies, however, the composition and downstream impacts of PW must be better understood. This study, in conjunction with the companion study on chemical analysis, lays out a framework for what is needed to properly characterize NPDES PW releases. Chemical analysis and acute toxicity analysis alone are insufficient, and a thorough assessment of chronic toxicity is necessary. The state of Colorado requires chronic toxicity testing of NPDES PW releases and Wyoming, as well as other states, should follow suit (CDPHE, 2009). Furthermore, a range of toxicological endpoints must be assayed including some, such as endocrine disruption, that remain to be analyzed at this site (Ohe et al., 2004). This could be achieved with a high-throughput assay that assesses a range of toxicological endpoints (Danforth et al., 2019). Many PW treatment studies have focused on a “treat for use” approach. As such, assay trigger values should be defined for different downstream users (Blackwell et al., 2019).
Bioassays are just a first step. Additional research at this site should focus on the health of livestock, aquatic species, crops and humans who consume these products. If these waters can be reused safely and economically, many stakeholders stand to benefit. If this practice is expanded prematurely, the quality and health of water, soil, crops and downstream users could be negatively impacted (Miller et al., 2019). This would result in thousands of legacy sites that must be remediated, and oil and gas operators may be subject to liability and clean-up costs.
Supplementary Material
HIGHLIGHTS.
Mutagenicity elevated at produced water discharge as compared to un-impacted sites.
Mutation rates decreased downstream, following trends in organic chemistry.
Mutation rate increases most prominent for copy number variation duplications.
Chemical analysis and acute toxicity testing are insufficient to characterize risk.
Detailed assessment of chronic toxicity needed to assess produced water for reuse.
Acknowledgements
This research was funded by the Environmental Defense Fund and Colorado State University Water Center. A portion of the research reported here was supported by an NIH grant to JLA (R35GM119788). GGG and TAB were supported by a Natural Sciences and Engineering Research Council of Canada Collaborative Research and Development grant (CRDPJ 469308-14). We would also like to acknowledge our oil and gas collaborators who assisted with this research and without whom this study would not have been possible.
Footnotes
Declaration of competing interest
The authors declare that they have no known competing financial interests or personal relationships that could have appeared to influence the work reported in this paper.
Appendix A. Supplementary data
Supplementary data to this article can be found online at https://doi.org/10.1016/j.scitotenv.2020.136944.
References
- Agency for Toxic Substances and Disease Registry (ATSDR), 2016. Toxicological Profile for Hydrogen Sulfide and Carbonyl Sulfide. U.S. Department of Health and Human Services, Public Health Service, Atlanta, GA. [PubMed] [Google Scholar]
- Alnafisi A, Hughes J, Wang G, Miller CA, 2007. Evaluating polycyclic aromatic hydrocarbons using a yeast bioassay. Environ. Toxicol. Chem 26 (7), 1333–1339. 10.1897/06-433R.1. [DOI] [PubMed] [Google Scholar]
- Bai B, Goodwin S, Carlson K, 2013. Modeling of frac flowback and produced water volume from Wattenberg oil and gas field. J. Pet. Sci. Eng 108, 383–392. 10.1016/j.petrol.2013.05.003. [DOI] [Google Scholar]
- Beaver LM, Truong L, Barton CL, Chase TT, Gonnerman GD, Wong CP, Tanguay RL, Ho E, 2017. Combinatorial effects of zinc deficiency and arsenic exposure on zebrafish (danio rerio) development. PLoS One 12 (8), e0183831 10.1371/journal.pone.0183831. [DOI] [PMC free article] [PubMed] [Google Scholar]
- Bern CR, Boehlke AR, Engle MA, Geboy NJ, Schroeder KT, Zupancic JW, 2013. Shallow groundwater and soil chemistry response to 3 years of subsurface drip irrigation using coalbed-methane-produced water. Hydrogeol. J 21 (8), 1803–1820. 10.1007/s10040-013-1058-0. [DOI] [Google Scholar]
- Blackwell BR, Ankley GT, Bradley PM, Houck KA, Makarov SS, Medvedev AV, Swintek J, Villeneuve DL, 2019. Potential toxicity of complex mixtures in surface waters from a nationwide survey of United States streams: identifying in vitro bioactivities and causative chemicals. Environmental Science & Technology 53 (2), 973–983. 10.1021/acs.est.8b05304. [DOI] [PMC free article] [PubMed] [Google Scholar]
- Blewett TA, Weinrauch AM, Delompré PLM, Goss GG, 2017. The effect of hydraulic flowback and produced water on gill morphology, oxidative stress and antioxidant response in rainbow trout (Oncorhynchus mykiss). Sci. Rep 7, 46582 10.1038/srep46582. [DOI] [PMC free article] [PubMed] [Google Scholar]
- Blewett TA, Delompré PLM, Glover CN, Goss GG, 2018. Physical immobility as a sensitive indicator of hydraulic fracturing fluid toxicity towards Daphnia magna. Sci. Total Environ 635, 639–643. 10.1016/j.scitotenv.2018.04.165. [DOI] [PubMed] [Google Scholar]
- Buckley JA, 2010. Quantifying the antiestrogen activity of wastewater treatment plant effluent using the yeast estrogen screen. Environ. Toxicol. Chem 29 (1), 73–78. 10.1002/etc.11. [DOI] [PubMed] [Google Scholar]
- Burgos WD, Castillo-Meza L, Tasker TL, Geeza TJ, Drohan PJ, Liu X, Landis JD, Blotevogel J, McLaughlin M, Borch T, Warner NR, 2017. Watershed-scale impacts from surface water disposal of oil and gas wastewater in western Pennsylvania. Environmental Science & Technology 51 (15), 8851–8860. 10.1021/acs.est.7b01696. [DOI] [PubMed] [Google Scholar]
- Capriello T, Grimaldi MC, Cofone R, D’Aniello S, Ferrandino I, 2019. Effects of aluminium and cadmium on hatching and swimming ability in developing zebrafish. Chemosphere 222, 243–249. 10.1016/j.chemosphere.2019.01.140. [DOI] [PubMed] [Google Scholar]
- Clark CE, Veil JA, 2009. Produced Water Volumes and Management Practices in the United States. Argonne National Laboratory, Argonne, IL: 10.2172/1007397No.ANL/EVS/R-09/1. [DOI] [Google Scholar]
- Clark CE, Horner RM, Harto CB, 2013. Life cycle water consumption for shale gas and conventional natural gas. Environmental Science & Technology 47 (20), 11829–11836. 10.1021/es4013855. [DOI] [PubMed] [Google Scholar]
- Claxton LD, Umbuzeiro G, DeMarini DM, 2010. The salmonella mutagenicity assay: the stethoscope of genetic toxicology for the 21st century. Environ. Health Perspect 118 (11), 1515–1522. 10.1289/ehp.1002336. [DOI] [PMC free article] [PubMed] [Google Scholar]
- Colborn T, Kwiatkowski C, Schultz K, Bachran M, 2011. Natural gas operations from a public health perspective. Hum. Ecol. Risk. Assess 17 (5), 1039–1056. 10.1080/10807039.2011.605662. [DOI] [Google Scholar]
- Colorado Department of Public Health and Environment (CDPHE), 2009. CDPS General Permit for Discharges Associated with Produced-Water Treatment Facilities (Denver, CO: ). [Google Scholar]
- Conover HN, Argueso JL, 2016. Contrasting mechanisms of de novo copy number mutagenesis suggest the existence of different classes of environmental copy number mutagens. Environ. Mol. Mutagen 57 (1), 3–9. 10.1002/em.21967. [DOI] [PubMed] [Google Scholar]
- Cozzarelli IM, Skalak KJ, Kent DB, Engle MA, Benthem A, Mumford AC, Haase K, Farag A, Harper D, Nagel SC, Iwanowicz LR, Orem WH, Akob DM, Jaeschke JB, Galloway J, Kohler M, Stoliker DL, Jolly GD, 2017. Environmental signatures and effects of an oil and gas wastewater spill in the Williston basin, North Dakota. Sci. Total Environ 579, 1781–1793. 10.1016/j.scitotenv.2016.11.157. [DOI] [PubMed] [Google Scholar]
- Danforth C, McPartland J, Blotevogel J, Coleman N, Devlin D, Olsgard M, Parkerton T, Saunders N, 2019. Alternative management of oil and gas produced water requires more research on its hazards and risks. Integr. Environ. Assess. Manag 15, 677–682. 10.1002/ieam.4160. [DOI] [PubMed] [Google Scholar]
- Dipp VR, Valles S, Ortiz-Kerbertt H, Suarez JV, Bardullas U, 2018. Neurobehavioral alterations in zebrafish due to long-term exposure to low doses of inorganic arsenic. Zebrafish 15 (6), 575–585. 10.1089/zeb.2018.1627. [DOI] [PubMed] [Google Scholar]
- Dolan FC, Cath TY, Hogue TS, 2018. Assessing the feasibility of using produced water for irrigation in Colorado. Sci. Total Environ 640–641, 619–628. 10.1016/j.scitotenv.2018.05.200. [DOI] [PubMed] [Google Scholar]
- Elliott EG, Ettinger AS, Leaderer BP, Bracken MB, Deziel NC, 2016. A systematic evaluation of chemicals in hydraulic-fracturing fluids and wastewater for reproductive and developmental toxicity. J Expos Sci Environ Epidemiol 10.1038/jes.2015.81. [DOI] [PubMed] [Google Scholar]
- Escher BI, Hermens JLM, 2002. Modes of action in ecotoxicology:their role in body burdens, species sensitivity, qsars, and mixture effects. Environmental Science & Technology 36 (20), 4201–4217. 10.1021/es015848h. [DOI] [PubMed] [Google Scholar]
- Folkerts EJ, Blewett TA, He Y, Goss GG, 2017a. Alterations to juvenile zebrafish (Danio rerio) swim performance after acute embryonic exposure to sub-lethal exposures of hydraulic fracturing flowback and produced water. Aquat. Toxicol 193, 50–59. 10.1016/j.aquatox.2017.10.003. [DOI] [PubMed] [Google Scholar]
- Folkerts EJ, Blewett TA, He Y, Goss GG, 2017b. Cardio-respirometry disruption in zebrafish (Danio rerio) embryos exposed to hydraulic fracturing flowback and produced water. Environ. Pollut 231, 1477–1487. 10.1016/j.envpol.2017.09.011. [DOI] [PubMed] [Google Scholar]
- Geier MC, Chlebowski AC, Truong L, Massey Simonich SL, Anderson KA, Tanguay RL, 2018. Comparative developmental toxicity of a comprehensive suite of polycyclic aromatic hydrocarbons. Arch. Toxicol 92 (2), 571–586. 10.1007/s00204-017-2068-9. [DOI] [PMC free article] [PubMed] [Google Scholar]
- Guerra K, Dahm K, Dundorf S, 2011. Oil and Gas Produced Water Management and Beneficial Use in the Western United States. U.S. Department of the Interior Bureau of Reclamation. No. Science and Technology Program Report No. 157, Denver, CO. [Google Scholar]
- Hall BM, Ma C-X, Liang P, Singh KK, 2009. Fluctuation analysis calculator: a web tool for the determination of mutation rate using Luria–Delbrück fluctuation analysis. Bioinformatics 25 (12), 1564–1565. 10.1093/bioinformatics/btp253. [DOI] [PMC free article] [PubMed] [Google Scholar]
- He Y, Flynn SL, Folkerts EJ, Zhang Y, Ruan D, Alessi DS, Martin JW, Goss GG, 2017a. Chemical and toxicological characterizations of hydraulic fracturing flowback and produced water. Water Res. 114, 78–87. 10.1016/j.watres.2017.02.027. [DOI] [PubMed] [Google Scholar]
- He Y, Folkerts EJ, Zhang Y, Martin JW, Alessi DS, Goss GG, 2017b. Effects on bio-transformation, oxidative stress, and endocrine disruption in rainbow trout (Oncorhynchus mykiss) exposed to hydraulic fracturing flowback and produced water. Environmental Science & Technology 51 (2), 940–947. 10.1021/acs.est.6b04695. [DOI] [PubMed] [Google Scholar]
- Hirayama A, Maegaito M, Kawaguchi M, Ishikawa A, Sueyoshi M, Al-Bemani A, Ahmed M, Esechie H, Mazrui S, Al Haddabi M, Al Khanjari S, 2002. Omani oil fields produced water: treatment and utilization. Proceedings of the Society for Petroleum Engineers Conference, Mexico, 10–12 February, 2002. 10.2118/74413-MS. [DOI]
- Jackson RE, Reddy KJ, 2007. Geochemistry of coalbed natural gas (cbng) produced water in powder river basin, Wyoming: salinity and sodicity. Water Air Soil Pollut. 184 (1), 49–61. 10.1007/s11270-007-9398-9. [DOI] [Google Scholar]
- Kassotis CD, Tillitt DE, Davis JW, Hormann AM, Nagel SC, 2014. Estrogen and androgen receptor activities of hydraulic fracturing chemicals and surface and ground water in a drilling-dense region. Endocrinology 155 (3), 897–907. 10.1210/en.2013-1697. [DOI] [PubMed] [Google Scholar]
- Kassotis CD, Klemp KC, Vu DC, Lin C-H, Meng C-X, Besch-Williford CL, Pinatti L, Zoeller RT, Drobnis EZ, Balise VD, Isiguzo CJ, Williams MW, Tillitt DE, Nagel SC, 2015. Endocrine-disrupting activity of hydraulic fracturing chemicals and adverse health outcomes after prenatal exposure in male mice. Endocrinology 156(12), 4458–4473. 10.1210/en.2015-1375. [DOI] [PubMed] [Google Scholar]
- Kassotis CD, Iwanowicz LR, Akob DM, Cozzarelli IM, Mumford AC, Orem WH, Nagel SC, 2016a. Endocrine disrupting activities of surface water associated with a West Virginia oil and gas industry wastewater disposal site. Sci. Total Environ 557–558, 901–910. 10.1016/j.scitotenv.2016.03.113. [DOI] [PubMed] [Google Scholar]
- Kassotis CD, Tillitt DE, Lin C-H, McElroy JA, Nagel SC, 2016b. Endocrine-disrupting chemicals and oil and natural gas operations: potential environmental contamination and recommendations to assess complex environmental mixtures. Environ. Health Perspect 124 (3), 256–264. 10.1289/ehp.1409535. [DOI] [PMC free article] [PubMed] [Google Scholar]
- Klein HL, Bačinskaja G, Che J, Cheblal A, Elango R, Epshtein A, Fitzgerald DM, Gómez-González B, Khan SR, Kumar S, Leland B, Marie L, Mei Q, Miné-Hattab J, Piotrowska A, Polleys EJ, Putnam CD, Radchenko EA, Saada AA, Sakofsky CJ, Shim EY, Stracy M, Xia J, Yan Z, Yin Y, Aguilera A, Argueso JL, Freudenreich CH, Gasser SM, Gordenin DA, Haber JE, Ira G, Jinks-Robertson S, King MC, Kolodner RD, Kuzminov A, Lambert SA, Lee SE, Miller KM, Mirkin SM, Petes TD, Rosenberg SM, Rothstein R, Symington LS, Zawadzki P, Kim N, Lisby M, Malkova, 2019. Guidelines for DNA recombination and repair studies: cellular assays of DNA repair pathways. Microbial cell (Graz, Austria) 6 (1), 1–64. 10.15698/mic2019.01.664. [DOI] [PMC free article] [PubMed] [Google Scholar]
- Krepischi ACV, Pearson PL, Rosenberg C, 2012. Germline copy number variations and cancer predisposition. Future Oncol. 8 (4), 441–450. 10.2217/fon.12.34. [DOI] [PubMed] [Google Scholar]
- Lea DE, Coulson CA, 1949. The distribution of the numbers of mutants in bacterial populations. J. Genet 49 (3), 264 10.1007/BF02986080. [DOI] [PubMed] [Google Scholar]
- McDevitt B, McLaughlin M, Cravotta CA, Ajemigbitse MA, Van Sice KJ, Blotevogel J, Borch T, Warner NR, 2019. Emerging investigator series: radium accumulation in carbonate river sediments at oil and gas produced water discharges: implications for beneficial use as disposal management. Environmental Science: Processes & Impacts 21, 324–338. 10.1039/c8em00336j. [DOI] [PubMed] [Google Scholar]
- McLaughlin MC, Borch T, McDevitt B, Warner NR, Blotevogel J, 2020. Water quality assessment downstream of oil and gas produced water discharges intended for beneficial reuse in arid regions. Sci. Total Environ 10.1016/j.scitotenv.2020.136607. [DOI] [PubMed] [Google Scholar]
- Miller H, Trivedi P, Qiu Y, Sedlacko EM, Higgins CP, Borch T, 2019. Food crop irrigation with oilfield-produced water suppresses plant immune response. Environ Sci Technol Lett 10.1021/acs.estlett.9b00539. [DOI] [Google Scholar]
- NOAA, 2018. Past weather by zip code - data table. [accessed Sept. 22, 2018]. Available from. https://www.climate.gov/.
- OECD, 2013. Test no. 236: fish embryo acute toxicity (fet) test. [accessed 2019 May 18]. Available from. https://www.oecd-ilibrary.org/content/publication/9789264203709-en.
- Oetjen K, Giddings CGS, McLaughlin M, Nell M, Blotevogel J, Helbling DE, Mueller D, Higgins CP, 2017. Emerging analytical methods for the characterization and quantification of organic contaminants in flowback and produced water. Trends in Environmental Analytical Chemistry 15, 12–23. 10.1016/j.teac.2017.07.002. [DOI] [Google Scholar]
- Oetjen K, Chan KE, Gulmark K, Christensen JH, Blotevogel J, Borch T, Spear JR, Cath TY, Higgins CP, 2018. Temporal characterization and statistical analysis of flowback and produced waters and their potential for reuse. Sci. Total Environ 619–620, 654–664. [DOI] [PubMed] [Google Scholar]
- Ohe T, Watanabe T, Wakabayashi K, 2004. Mutagens in surface waters: a review. Mutation Research/Reviews in Mutation Research 567 (2–3), 109–149. 10.1016/j.mrrev.2004.08.003. [DOI] [PubMed] [Google Scholar]
- Orem WH, Tatu CA, Lerch HE, Rice CA, Bartos TT, Bates AL, Tewalt S, Corum MD, 2007. Organic compounds in produced waters from coalbed natural gas wells in the powder river basin, Wyoming, USA. Appl. Geochem. 22 (10), 2240–2256. 10.1016/j.apgeochem.2007.04.010. [DOI] [Google Scholar]
- Osterkamp WR, Wood WW, 1987. Playa-lake basins on the southern high plains of Texas and New Mexico: part I. Hydrologic, geomorphic, and geologic evidence for their development. GSA Bull. 99 (2), 215–223. 10.1130/0016-7606(1987)99b224:PBOTSHN2.0.CO;2. [DOI] [Google Scholar]
- Plackett RL, Hewlett PS, 1952. Quantal responses to mixtures of poisons. J. R. Stat. Soc.Ser. B Methodol 14 (2), 141–163. www.jstor.org/stable/2983865. [Google Scholar]
- Reif DM, Truong L, Mandrell D, Marvel S, Zhang G, Tanguay RL, 2016. High-throughput characterization of chemical-associated embryonic behavioral changes predicts teratogenic outcomes. Arch. Toxicol 90 (6), 1459–1470. 10.1007/s00204-015-1554-1. [DOI] [PMC free article] [PubMed] [Google Scholar]
- Rosenblum J, Nelson AW, Ruyle B, Schultz MK, Ryan JN, Linden KG, 2017. Temporal characterization of flowback and produced water quality from a hydraulically fractured oil and gas well. Sci. Total Environ 596–597, 369–377. 10.1016/j.scitotenv.2017.03.294. [DOI] [PubMed] [Google Scholar]
- Sedlacko EM, Jahn CE, Heuberger AL, Sindt NM, Miller HM, Borch T, Blaine AC, Cath TY, Higgins CP, 2019. Potential for beneficial reuse of oil-and-gas-derived produced water in agriculture: physiological and morphological responses in spring wheat (Triticum aestivum). Environ. Toxicol. Chem 38 (8), 1756–1769. 10.1002/etc.4449. [DOI] [PubMed] [Google Scholar]
- Spiropoulos A, Bisson LF, 2000. Met17 and hydrogen sulfide formation in saccharomyces cerevisiae. Appl. Environ. Microbiol 66 (10), 4421–4426. 10.1128/AEM.66.10.4421-4426.2000. [DOI] [PMC free article] [PubMed] [Google Scholar]
- Stratton MR, Campbell PJ, Futreal PA, 2009. The cancer genome. Nature 458, 719 10.1038/nature07943. [DOI] [PMC free article] [PubMed] [Google Scholar]
- Tasker T, Burgos W, Piotrowski P, Castillo-Meza L, Blewett TA, Ganow KB, Stallworth A, Delompre PLM, Goss GG, Folwer LB, Vanden Heuvel JP, Dorman F, Warner NR, 2018. Environmental and human health impacts of spreading oil and gas wastewater on roads. 52 (12), 7081–7091. 10.1021/acs.est.8b00716. [DOI] [PubMed] [Google Scholar]
- Truong L, Harper SL, Tanguay RL, 2011. Evaluation of embryotoxicity using the zebrafish model In: Gautier J-C (Ed.), Drug Safety Evaluation: Methods and Protocols. Humana Press, Totowa, NJ, pp. 271–279. 10.1007/978-1-60761-849-2_16. [DOI] [PMC free article] [PubMed] [Google Scholar]
- Truong L, Reif DM, St Mary L, Geier MC, Truong HD, Tanguay RL, 2014. Multidimensional in vivo hazard assessment using zebrafish. Toxicol. Sci 137 (1), 212–233. 10.1093/toxsci/kft235. [DOI] [PMC free article] [PubMed] [Google Scholar]
- United States Deparment of Energy (US DOE), 2020. Water security grand challenge. [accessed Jan. 18, 2020]. Available from. https://www.energy.gov/eere/water-security-grand-challenge.
- United States Environmental Protection Agency (US EPA), 2018. Oil and Natural Gas Produced Water Governance in the State of New Mexico - Draft White Paper. Available from. https://www.epa.gov/sites/production/files/2018-11/documents/oil_and_natural_gas_produced_water_governance_in_the_state_of_new_mexico_draft_white_paper_508.pdf.
- United States Environmental Protection Agency (US EPA), 2020. Study of Oil and Gas Extraction Wastewater Management. [accessed Jan. 18, 2020]. Available from. https://www.epa.gov/eg/study-oil-and-gas-extraction-wastewater-management.
- USGS, 2018. National water information system: web interface. [accessed Sept. 22, 2018].Available from. https://waterdata.usgs.gov/nwis.
- Weingarten M, Ge S, Godt JW, Bekins BA, Rubinstein JL, 2015. High-rate injection is associated with the increase in U.S. mid-continent seismicity. Science 348 (6241), 1336–1340. 10.1126/science.aab1345. [DOI] [PubMed] [Google Scholar]
- Williams AJ, Grulke CM, Edwards J, McEachran AD, Mansouri K, Baker NC, Patlewicz G, Shah I, Wambaugh JF, Judson RS, et al. , 2017. The comptox chemistry dashboard: a community data resource for environmental chemistry. Journal of Cheminformatics 9 (1), 61. [DOI] [PMC free article] [PubMed] [Google Scholar]
- Zhang H, Zeidler AFB, Song W, Puccia CM, Malc E, Greenwell PW, Mieczkowski PA, Petes TD, Argueso JL, 2013. Gene copy-number variation in haploid and diploid strains of the yeast saccharomyces cerevisiae. Genetics 193 (3), 785–801. 10.1534/genetics.112.146522. [DOI] [PMC free article] [PubMed] [Google Scholar]
Associated Data
This section collects any data citations, data availability statements, or supplementary materials included in this article.