

Summary:
Impairment of protein phosphatases, including the family of serine/threonine phosphatases designated PP2A, is essential for the pathogenesis of many diseases, including cancer. The ability of PP2A to dephosphorylate hundreds of proteins is regulated by over 40 specificity-determining regulatory “B” subunits that compete for assembly and activation of heterogenous PP2A heterotrimers. Here we reveal how a small molecule, DT-061, specifically stabilizes the B56α-PP2A holoenzyme in a fully assembled, active state to dephosphorylate selective substrates, such as its well-known oncogenic target, c-MYC. Our 3.6 Å structure identifies molecular interactions between DT-061 and all three PP2A subunits that prevent dissociation of the active enzyme and highlight inherent mechanisms of PP2A complex assembly. Thus, our findings provide fundamental insights into PP2A complex assembly and regulation, identify a unique interfacial stabilizing mode of action for therapeutic targeting, and aid in the development of phosphatase-based therapeutics tailored against disease specific phospho-protein targets.
Keywords: PP2A, phosphatase, B56α, c-MYC, cryo-EM, small molecule, cancer, SMAP
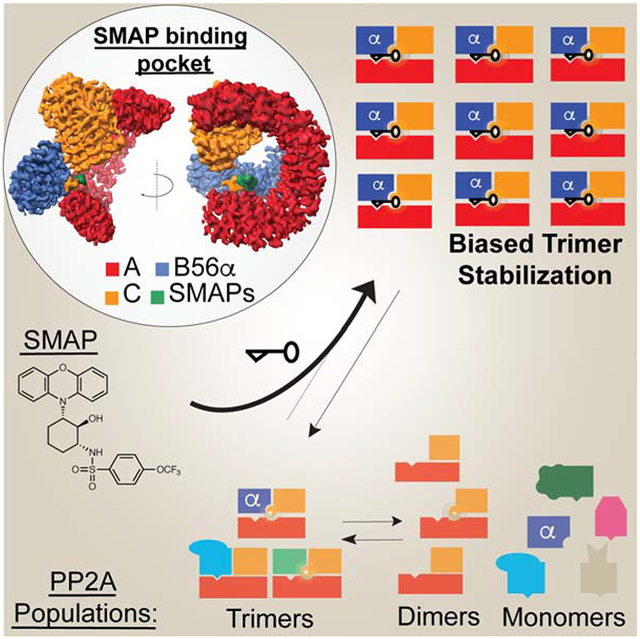
Graphical Abstract
Introduction
Physiological signaling and cellular homeostasis are tightly regulated through the dynamic interplay of kinases and phosphatases. Pathologic hyperphosphorylation of proteins, subsequent to aberrant activation of kinases and inactivation of phosphatases, is a hallmark of many diseases ranging from neurodegeneration to cancer. Therapeutic targeting of these hyperactive, phosphorylation-regulated, signaling events has become a standard treatment approach for the management of diverse disease processes, including cancer. While kinase inhibitors have been the focus of these targeted approaches, an equally promising, yet underexplored strategy lies in the activation of phosphatases (Allen-Petersen et al., 2018; Cristobal et al., 2015; Gutierrez et al., 2014; Ho et al., 2018; Kauko et al., 2018; Neviani et al., 2007; Rincón et al., 2015; Sangodkar et al., 2017a; Switzer et al., 2011; Tohmé et al., 2019).
The major serine/threonine protein phosphatase 2A (PP2A) family of phosphatases is central in maintaining cellular homeostasis and thus has a significant propensity for dysregulation in human diseases (Brautigan and Shenolikar, 2018; Junttila et al., 2007; Tsujio et al., 2005). The family of PP2A enzymes consist of heterotrimeric phosphatases composed of a scaffolding “A” subunit, a catalytic “C” subunit, and one of over 40 substrate-determining regulatory “B” subunits. The regulatory B subunits belong to four structurally distinct families (B55, B56, PR70/72, STRN) that exhibit little to no sequence similarity between them (Shi, 2009). In contrast to the low conservation between the different classes of B-subunits, isoforms within each family share significant predicted sequence similarity. Notably, the sequence variations present among B56 isoforms mainly reside at the interface where the A and B subunits interact in the assembled PP2A complex (Cho and Xu, 2007). The intrinsic structural flexibility of the scaffolding subunit, along with post-translational modifications (PTM) to the various PP2A subunits, allows for such structural and substrate directed diversity (Wlodarchak et al., 2013a; Xu et al., 2008, 2006). In particular, the capacity for B subunits to bind the core AC dimer, and thus direct substrate specificity, is dictated by the accessibility and PTMs of the carboxyl-terminus of the C subunit (C-tail) (Ikehara et al., 2007; Longin et al., 2007). Carboxyl methylation of the terminal leucine residue (L309) of the C-tail is carried out by Leucine Carboxyl Methyltransferase 1 (LCMT-1), removed by Protein Phosphatase Methylesterase 1 (PME-1), and is central in regulating PP2A biology (Jackson and Pallas, 2012; Ogris et al., 1999). While investigation of C-tail methylation on PP2A holoenzyme composition in cellular systems, mainly through mutation or deletion of the C-tail residues, has clearly demonstrated a role for methylation sensitive (B55, B56) and methylation independent (PR72, STRN) B subunit classifications, these dependencies appear to be cell context and stimuli dependent (Brautigan and Shenolikar, 2018; Longin et al., 2007; Nunbhakdi-Craig et al., 2007; Sents et al., 2013). The diversity and regulation of B subunits enables PP2A to regulate, at various levels, a majority of cellular signaling pathways including c-MYC (Arnold and Sears, 2008), MEK (Letourneux et al., 2006), and mTOR (Casado et al., 2013; Fan et al., 2013).
Given its broad regulatory profile, it is no surprise that PP2A is often dysregulated in human disease. The complexity of PP2A heterotrimer assembly introduces many possible mechanisms by which its enzymatic function or substrate specificity can be inhibited or re-directed to promote diseases such as cancer. Mutation of various PP2A subunits, altered transcriptional expression of regulatory B subunits, or overexpression of PP2A inhibitory proteins all result in PP2A dysregulation and are observed in human disease. Among the various PP2A subunits, the scaffolding subunit is most frequently mutated with recurrent pathologic mutations occurring along the B-subunit binding interface. Interestingly, recurrent mutation of these residues (for example, P179, R183, S256, and R258) result in marked changes in the PP2A holoenzyme composition in cells (Haesen et al., 2016; O’Connor et al., 2019; Ruediger et al., 2011; Taylor et al., 2019). Alternatively, selective B subunit inhibition has also been characterized through the overexpression of endogenous PP2A inhibitors such as the Cancerous Inhibitor of PP2A (CIP2A) which selectively sequesters B56 family subunits to prevent B56 specific PP2A holoenzyme activity (Junttila et al., 2007; Wang et al., 2017). Interestingly, despite the numerous mechanisms employed to dysregulate select B subunit containing PP2A populations and inhibit PP2A activity, complete loss of B subunits rarely occurs in any disease setting, instilling promise for the therapeutic activation of endogenous PP2A in human disease.
Current strategies to “reactivate” PP2A primarily function by interfering with endogenous protein inhibitors of PP2A such as CIP2A, proteins often overexpressed and indicators of poor prognoses in disease states such as cancer (Cristobal et al., 2015; Neviani et al., 2007; Rincón et al., 2015; Switzer et al., 2011). While these approaches prove promising, they lack the ability to selectively direct PP2A against pathogenic drivers. Alternatively, the design of therapies capable of selectively directing PP2A holoenzyme composition, and thus substrate specificity, would have enormous clinical potential as a therapeutic strategy. A series of small molecule PP2A activators, previously termed SMAPs and engineered from phenothiazine parent compounds, drive dephosphorylation of select pathogenic substrates such as c-MYC and ERK with concordant tumor inhibition in an array of in vivo cancer models (Allen-Petersen et al., 2018; Kauko et al., 2018; Sangodkar et al., 2017b).
Here we define the structural and biological basis by which the lead SMAP, DT-061, selectively binds and stabilizes a single B-subunit containing heterotrimer, B56α, to drive the dephosphorylation of select PP2A substrates, including c-MYC. Furthermore, we provide structural and molecular insights into PP2A holoenzyme regulation, identify a new therapeutic strategy for protein complex targeting and activation, and present a basis for phosphatase-activating therapeutics. The marriage of multidisciplinary scientific practices allows us to present here a previously unrecognized therapeutic strategy of complex stabilization for the activation of endogenous disease combating enzymes.
Results
DT-061 increases the population of B56α containing PP2A heterotrimers
PP2A activity is directed and re-directed to various substrates based on the dynamic coupling and de-coupling of each regulatory B-subunit with available AC heterodimers. DT-061 preferentially drives the pro-apoptotic functions of PP2A as demonstrated by the profound disease-slowing effects observed in many cancer models both as a single agent and in combination therapy. In order to understand how DT-061 is able to drive specific pro-apoptotic PP2A functions, we designed a cellular assay to monitor the effect of DT-061 on PP2A heterotrimer formation. Using a cell based split luciferase system (NanoBiT), we labeled both ends of the A scaffold subunit to monitor conformational changes in response to treatment with DT-061 (Fig. S1A). In this screening system, the dimeric AC complex has an inherent dynamic flexibility. Binding of a PP2A protein regulator, most notably the regulatory B subunits, to the core dimer results in a structural constriction of the A subunit that brings its terminal ends in closer proximity to one other, which results in enhanced luminescence (Cho and Xu, 2007; Tsytlonok et al., 2013; Wlodarchak et al., 2013b; Xu et al., 2006). Our data show a significant 3–6 fold increase in complementation of luciferase fragments between one and two hours of DT-061 exposure which is followed by a return to baseline by 6 hours after treatment (Fig. 1A). These observations suggest that the selective PP2A functions enhanced by DT-061 are driven by PP2A holoenzyme regulation and/or biogenesis, presumably through an increase in PP2A complex assembly.
Fig. 1. DT-061 increases the population of B56α containing heterotrimers.
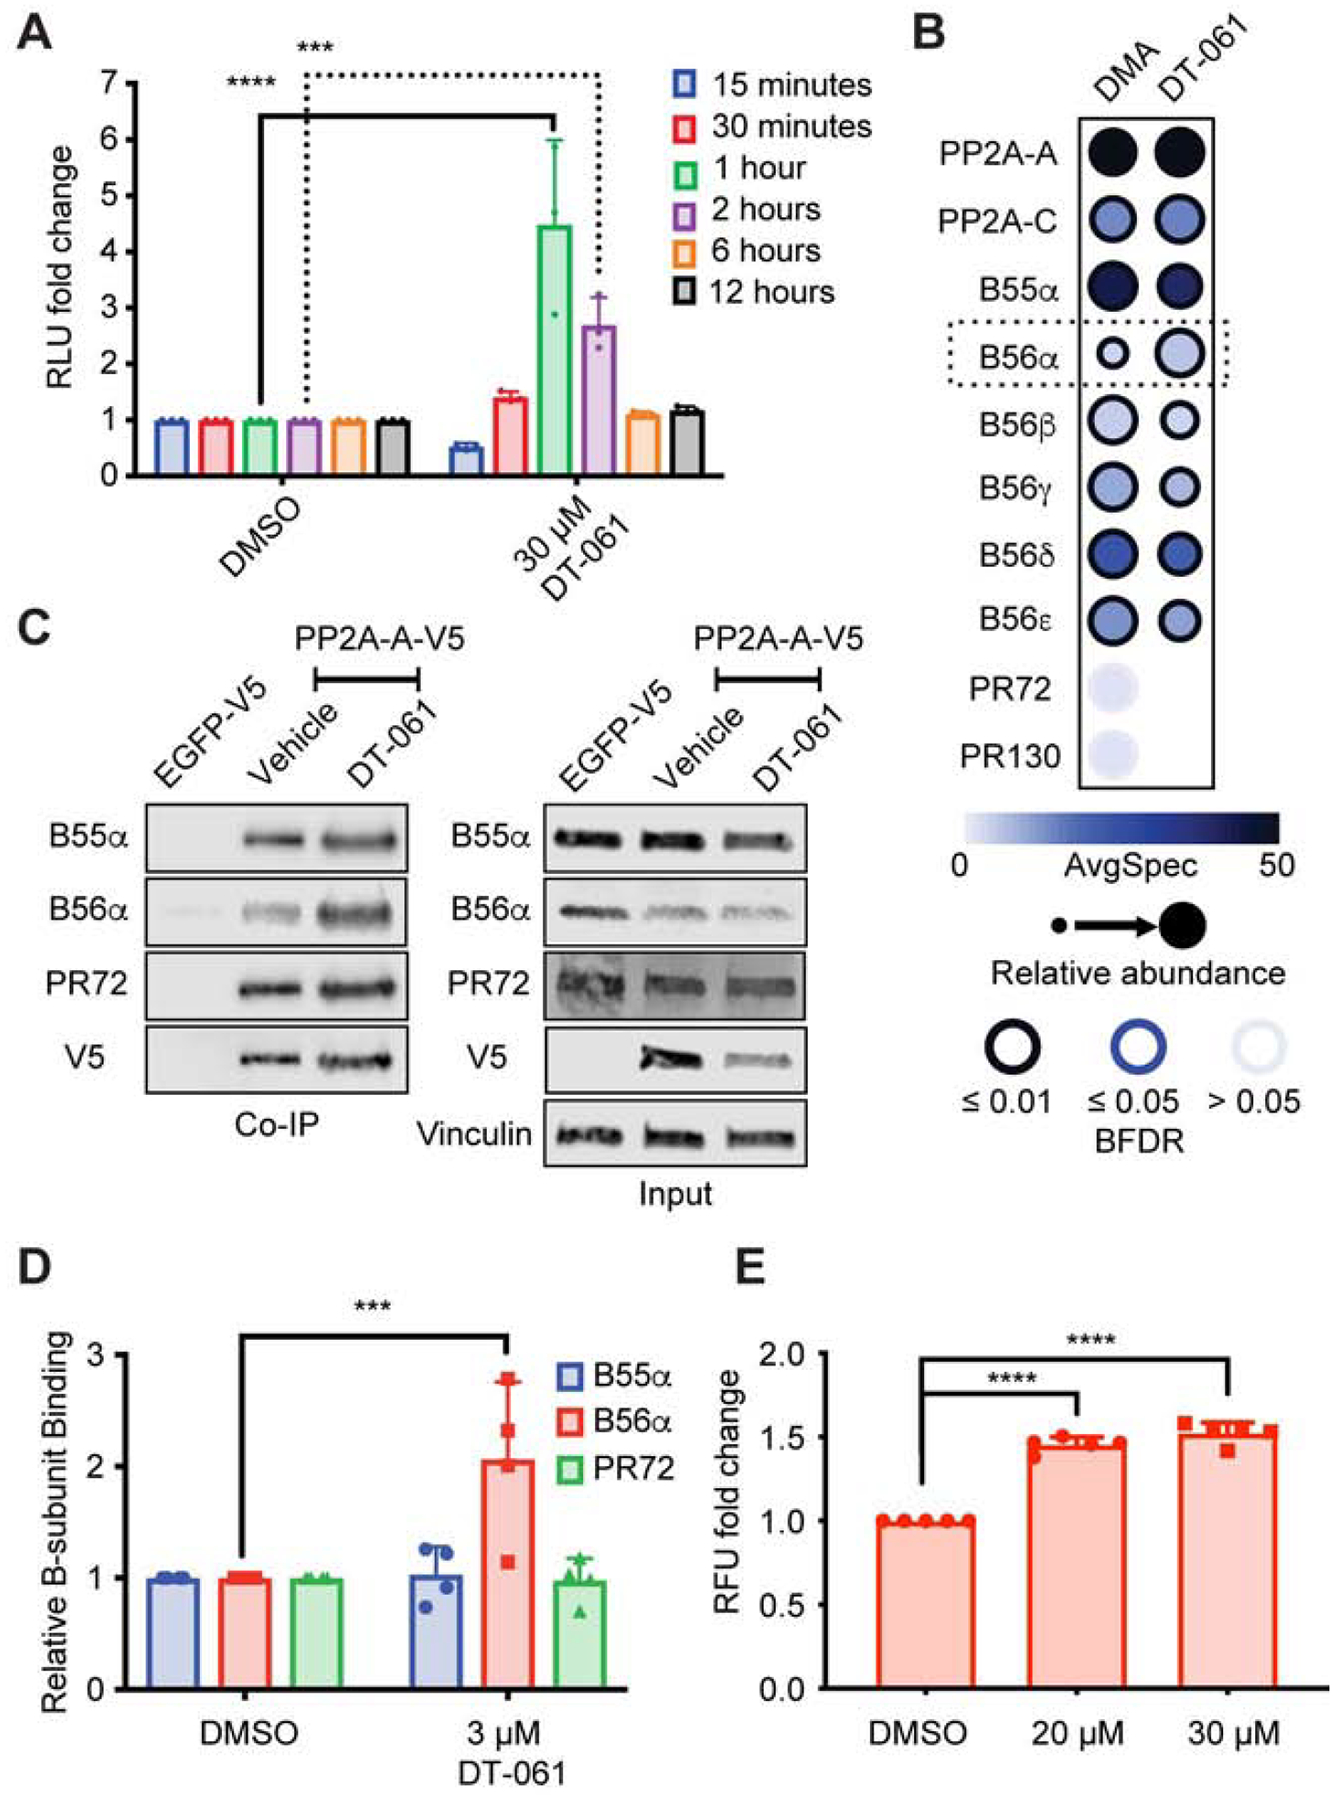
(A) PP2A-A split bioluminescence tagged (NanoBit) H358 cells treated with DMSO or 30 μM DT-061 for 15 min followed by washout and analysis at 15 min (blue), 30 min (red), 1 hr (green), 2 hr (magenta), 6 hr (orange), or 12 hrs (black), demonstrate an increase in signal 1–2 hours after DT-061 treatment followed by a subsequent return to baseline. Two-way ANOVA with Holm-Sidak multiple comparison test, *** = p < 0.001, **** = p < 0.0001 (B) Co-IP of V5-tagged PP2A-A from xenograft tumors treated for 29 days with DMSO or DT-061 followed by mass spectrometry and SAINT analysis of co-immunoprecipitated proteins, expressed as dot-plots using ProHits-viz, indicates an increase in B56α holoenzymes with DT-061 treatment. Color intensity of dot represents raw spectral count, size of dot represents normalized intensity, intensity of dot border represents statistical confidence. (C-D) Cell culture Co-IP and whole lysate (input) from H358 cells stably expressing V5-tagged PP2A-A treated with 3 μM DT-061, probed for B55α, B56α, PR72, V5, or vinculin demonstrates selective increase in B56α holoenzymes with DT-061 treatment. (E) PP2A-A and B56α split bioluminescence tagged (NanoBRET) H358 cells treated with 20 μM or 30 μM DT-061 confirms enhanced population of B56α containing holoenzymes. ANOVA with Dunnett multiple comparison test, *** = p < 0.001, **** = p < 0.0001. (See also Figure S1).
In order to evaluate the population of PP2A holoenzymes regulated by DT-061, we overexpressed a V5-tagged A scaffold subunit in the lung adenocarcinoma cell line H358 for co-immunoprecipitation (co-IP) experiments. To determine the dynamic changes in holoenzyme composition in vivo, xenograft tumors generated from these tagged-A cell lines were treated with DT-061 and subjected to V5 co-IP. Isolated products were evaluated by mass spectrometry with Significance Analysis of INTeractome (SAINT) analysis performed and reported using a Prohitz dot blot graph (Fig. 1B). Co-IP data from DT-061 treated tumor samples demonstrated a significant increase, roughly two-fold, in B56α containing holoenzymes when compared to vehicle treated tumors (Fig. 1B). In line with our observations from xenograft tumors treated with DT-061, B56α trimers specifically were enhanced in co-IP samples from cell culture, also roughly two-fold, whereas the population of B55α and PR72 remained unchanged (Fig. 1C, D; Fig. S1C, D). To further explore this selective regulatory subunit bias, a second split luciferase system (NanoBRET) was designed to directly test the effect of DT-061 on B56α trimers in cell culture. This NanoBRET system involved labeling the amino-terminus of the scaffold A subunit with one component of the luciferase tag with the complementing luciferase component placed on the carboxyl-terminus of the B56α subunit (Fig. S1B). Direct, real-time investigation of B56α specific PP2A trimerization using this system once again demonstrated an increase in B56α binding upon treatment with DT-061 in cell culture (Fig. 1E; Fig. S1B). Taken together, these results indicate that DT-061 selectively enhances B56α containing PP2A holoenzyme populations both in cell culture and in vivo.
DT-061 directly stabilizes AB56αC heterotrimers
Reconstituted PP2A A, C and B56α subunits were individually expressed and purified to determine whether the increase in heterotrimer composition was a direct or indirect effect of DT-061 on PP2A assembly. The AB56αC heterotrimer was assembled and purified using size-exclusion chromatography (SEC). The sharp, symmetric peak of the chromatogram suggests that the reconstituted complex remains assembled at micromolar concentrations (Fig. 2A; Fig. S2AC). At nanomolar concentrations the complex dissociates, as indicated by the broadened SEC peak, which is indicative of a protein concentration dependent dissociation for the recombinant B56α complex that occurs around 100 nM (Fig. 2A, blue line). Under these same conditions, the addition of DT-061 stabilizes the B56α complex and prevents holoenzyme dissociation (Fig. 2A, red line). To quantitatively assess the stabilization of the complex by DT-061, we labeled the B56α subunit with a 6-FAM (6-Carboxyfluorescein) fluorophore and used fluorescence polarization (FP) to determine the equilibrium dissociation constant of the B56α subunit with the binding affinity of B56α subunit for the AC dimer. To further dissect the mechanism of AB56αC stabilization by DT-061, we immobilized the B56α subunit and employed surface plasmon resonance (SPR) to measure kinetic parameters of AC dimer binding in the presence and absence of DT-061. Similar to the FP results, SPR analysis demonstrated that the calculated KD for B56α to AC was enhanced with the addition of DT-061 (Fig. 2C). Importantly, SPR analysis of B56γ binding to AC in the presence and absence of DT-061 revealed no significant change in binding kinetics, further highlighting the isoform specificity of this small molecule series (Fig 2D). Taken together, these data reveal that the enhancement of B56αC heterotrimer composition observed in vivo is consequent to the direct, selective binding and stabilization of AB56αC heterotrimers by DT-061.
Fig. 2. DT-061 directly stabilizes AB56αC heterotrimers.
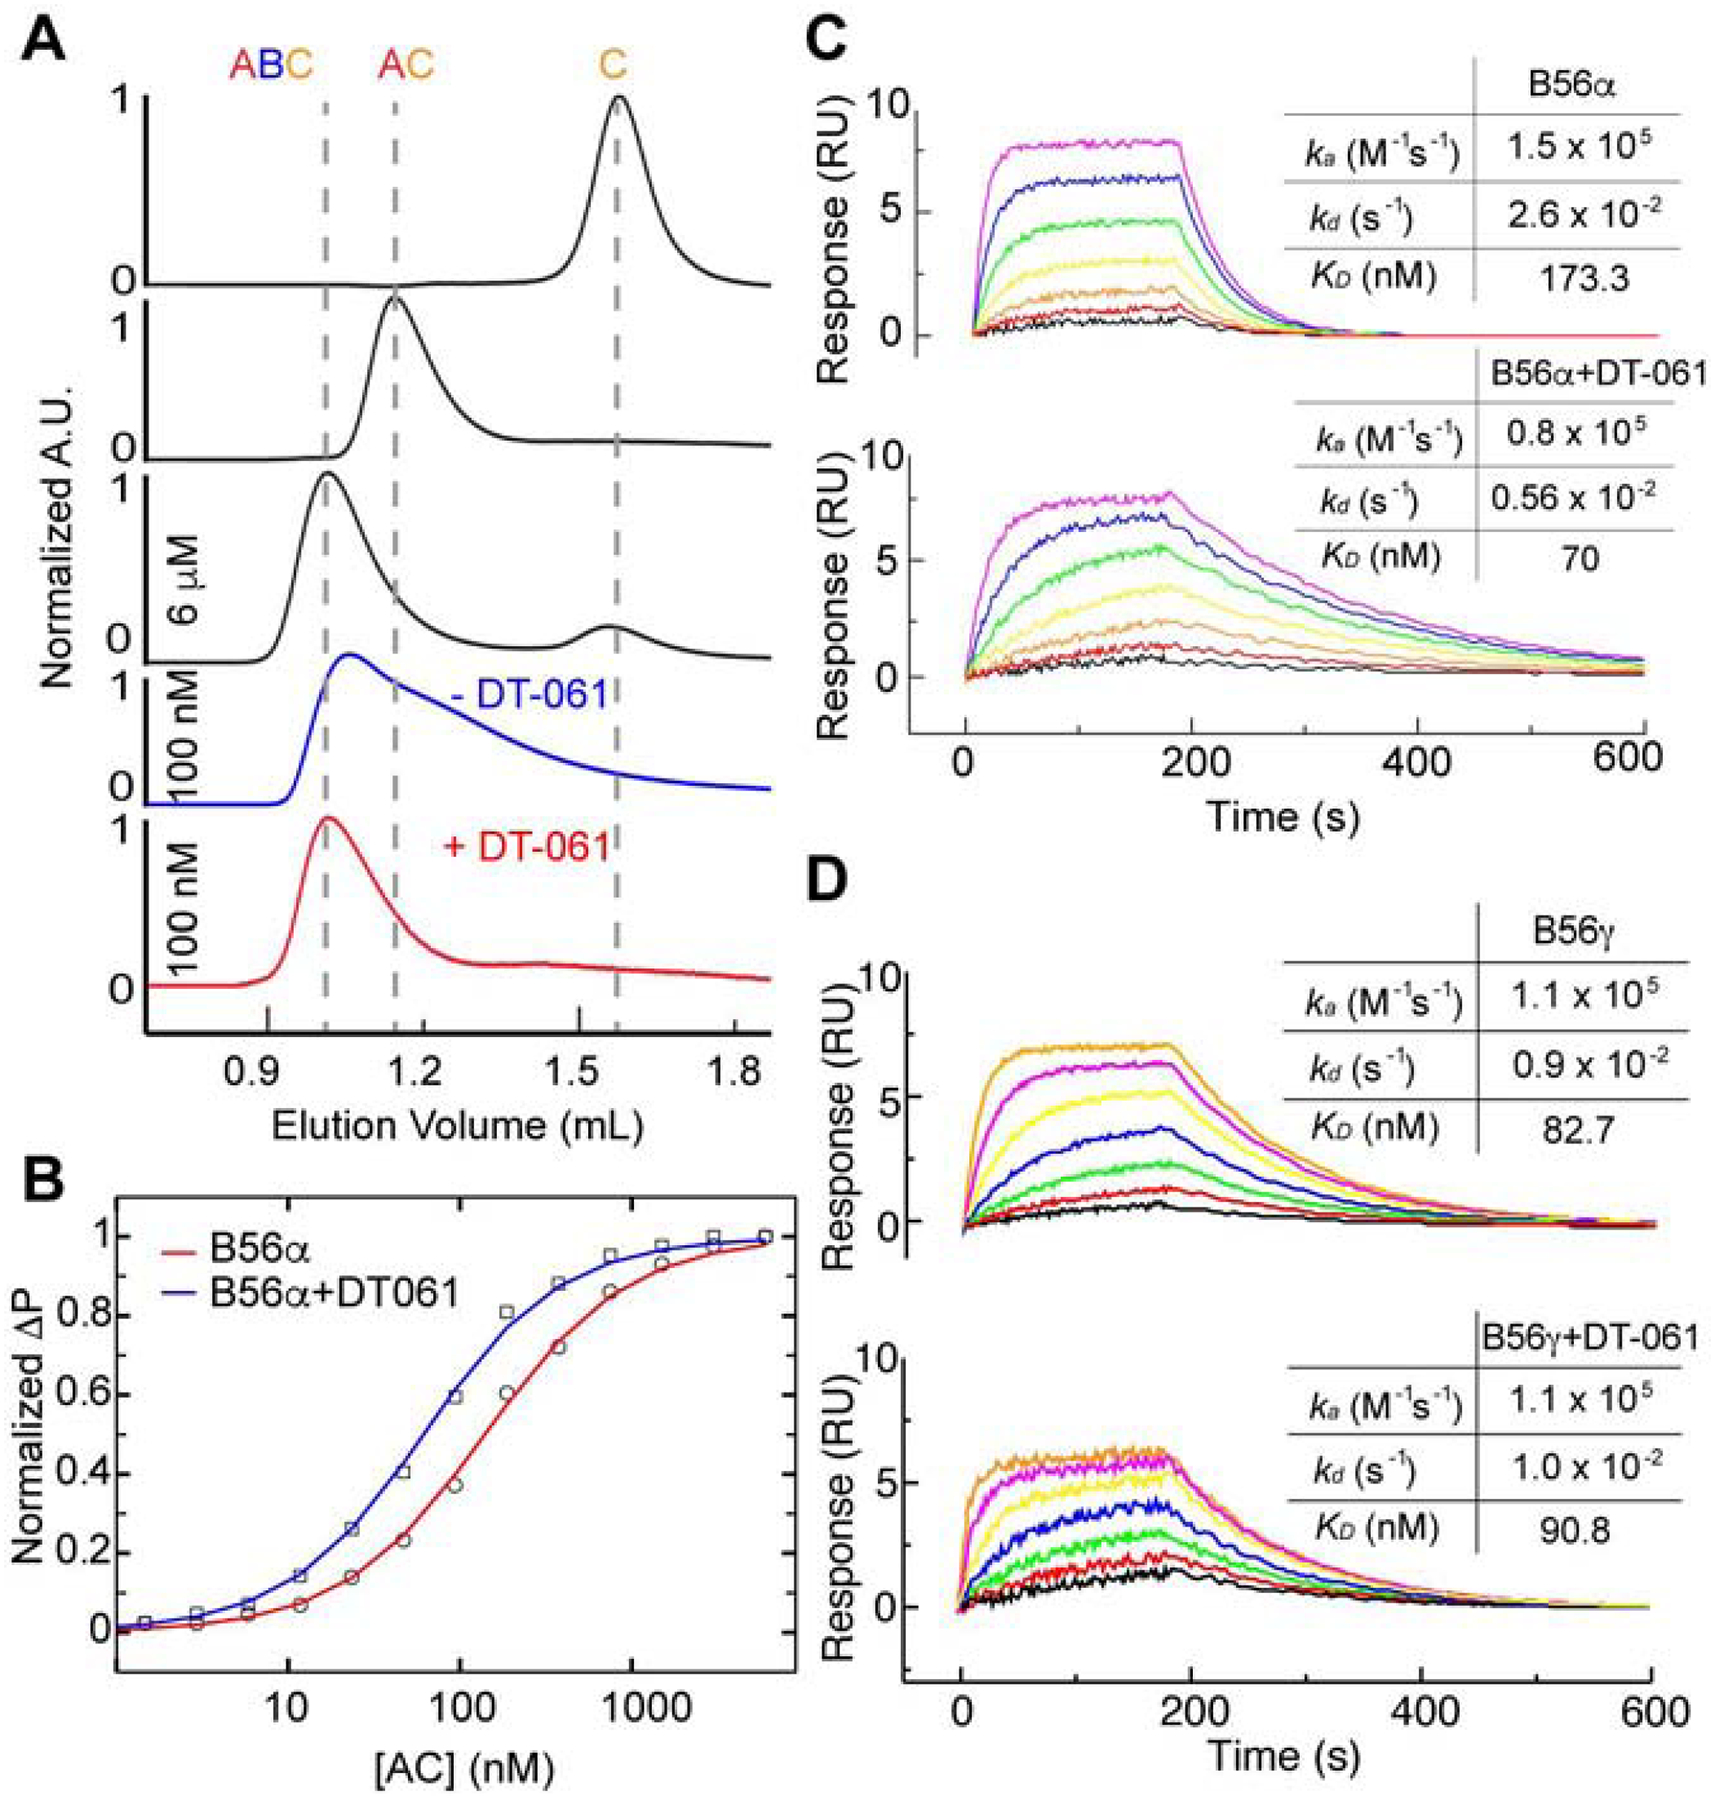
(A) Size-exclusion chromatography (SEC) profiles of PP2A holoenzyme complex components, including C monomer, AC dimer and AB56αC trimer complex at 6 μM concentration (black lines). Purified AB56αC trimer starts to dissociate at 100 nM concentration during SEC analysis (blue line), while the complex remains stable (red line) in the presence of 2 μM DT-061 in SEC running buffer. The peak height is UV absorbance at 280 nm normalized to the peak of each plot. (B) 6-FAM labeled recombinant B56α incubated with increasing concentrations of AC analyzed by fluorescence polarization to determine the affinity of B56α for AC in the absence (red line, KD ~130 ± nM) and presence (blue line, KD ~ 53.0 ± 2 nM) of DT-061 (2 μM). (C) Surface immobilized B56α subject to SPR with increasing concentrations of AC dimer (colors) in the absence (top) or presence (bottom) of DT-061 (2 μM). SPR data of B56α in the presence of DT-061 demonstrates a similar enhanced overall affinity for AC. (D) Surface immobilized B56γ subject to SPR with increasing concentrations of AC dimer (colors) in the absence (top) or presence (bottom) of DT-061 (2 μM) illustrates no effect of DT-061 on B56γ binding kinetics for AC. (See also Figure S2).
The binding pocket of DT-061 resides at the trimeric interface of AB56αC
In order to define the structural and molecular interactions that enable DT-061 to stabilize AB56αC heterotrimers, we solved the three-dimensional structure of the drug bound complex using single-particle cryo-electron microscopy (cryo-EM). Our 3.6 Å structure highlights multiple intersubunit interactions, identifies the previously unknown binding site of DT-061, and elucidates the molecular basis of trimer stabilization (Fig. 3; Fig. S3). The C subunit anchors at the C-terminal region of the A subunit, while the B subunit interacts with the N-terminal region of the A subunit. Importantly, the C-tail of the C subunit is sandwiched between the A and B subunits which is immediately adjacent to the DT-061 binding site (Fig. 3A–D). The quality of electron density combined with the nature of the bulky side chains facilitated the assignment of individual amino acids in the C-tail of the C subunit, including Y307-L309 (Fig. 3C). The “whale-tail” like orientation of the C-tail observed in the cryo-EM density indicates that the terminal L309 residue is methylated (Fig. 3C). Importantly, without methylation, electron density attributed to a native carboxyl terminus would not be apparent in the cryo-EM map due to the weak electron scattering factor of negatively charged oxygen atoms (Yonekura et al., 2015).
Fig. 3. The binding pocket of DT-061 resides at the trimeric interface of AB56αC.
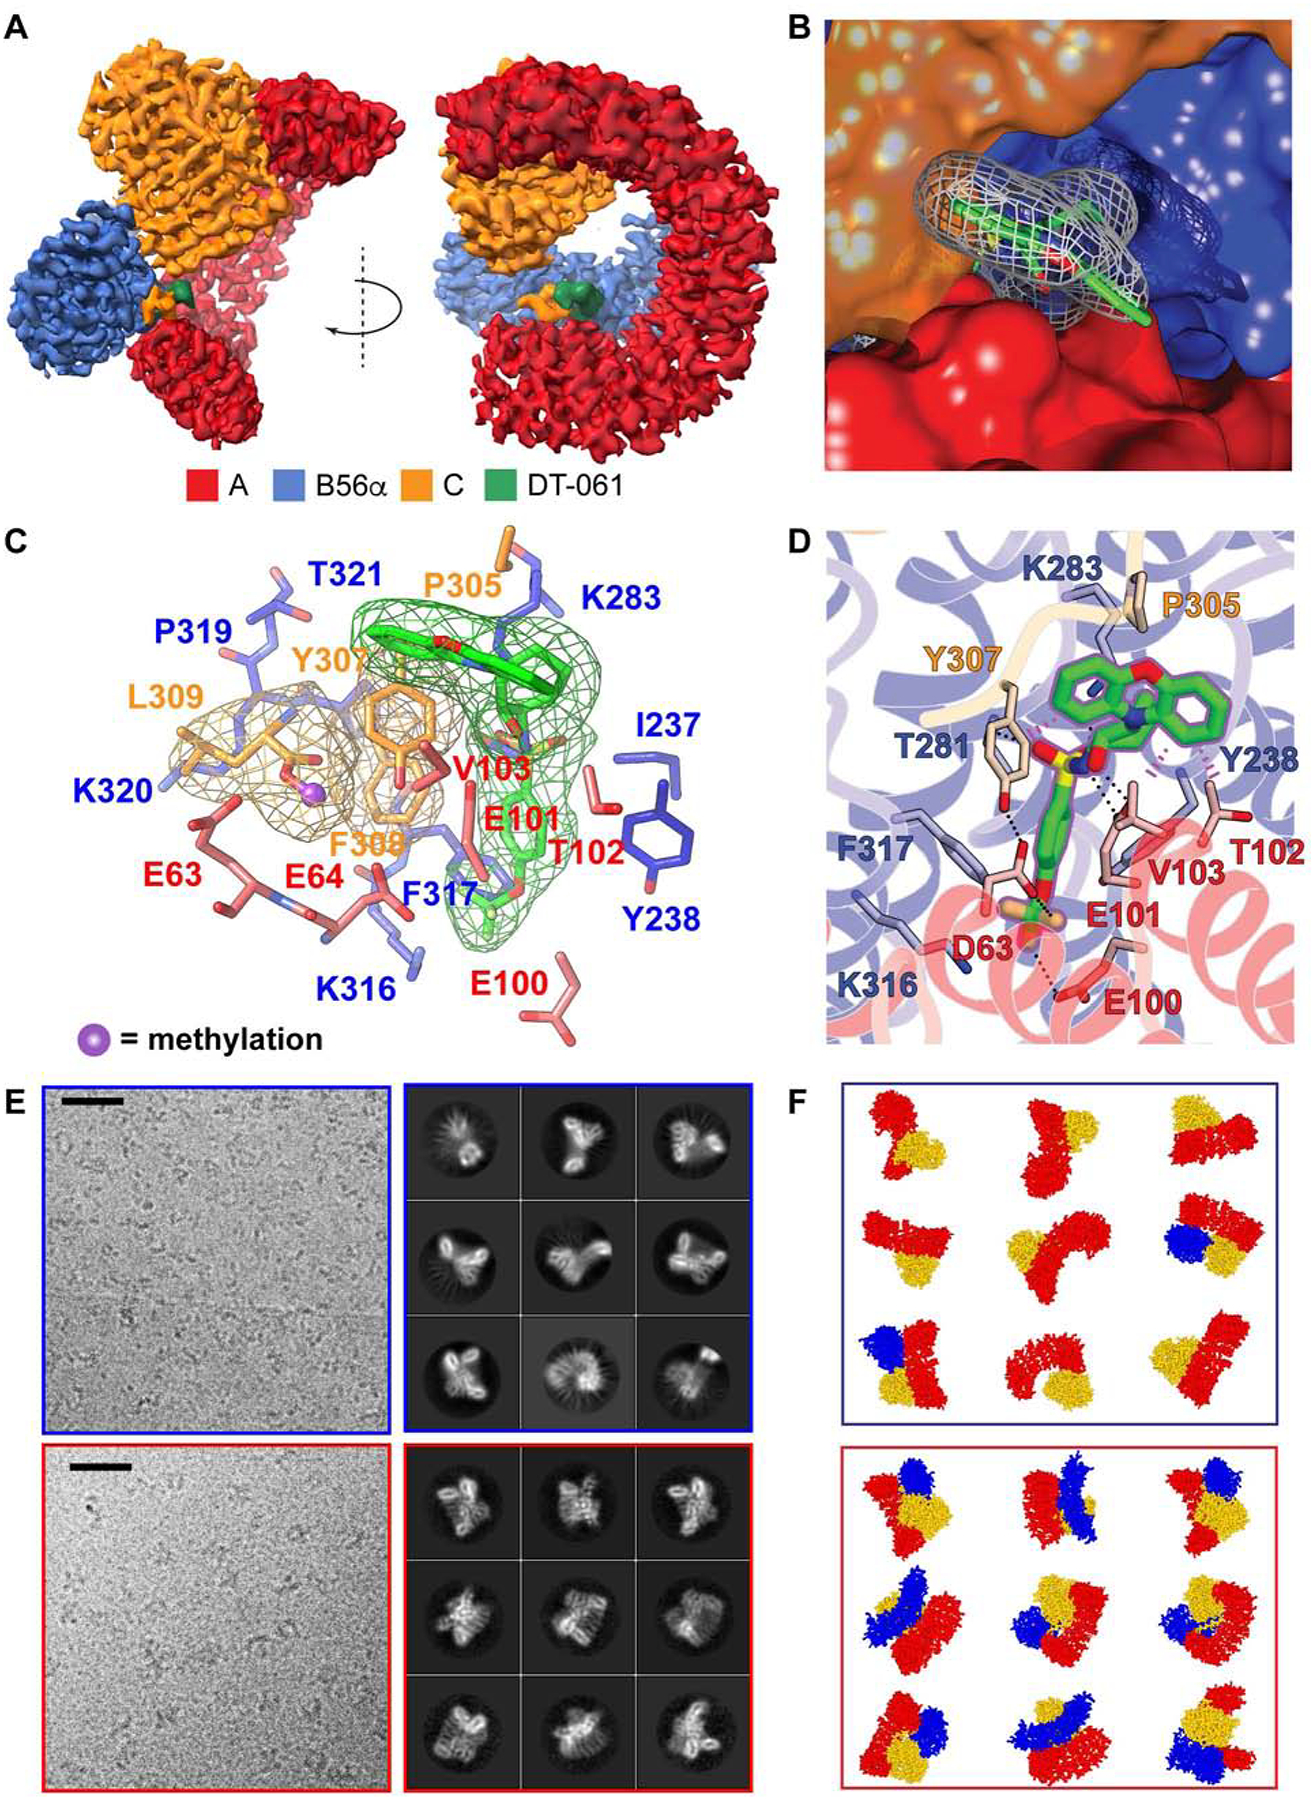
(A) A 3.6 Å cryo-EM density map of AB56αC holoenzyme in complex with DT-061 (green density) bound PP2A trimer. The individual subunits, A, B56α and, C, are colored in red, blue and orange respectively. (B) Close-up view of DT-061, shown in grey mesh density with carbons represented in green. Part of DT-061 is buried inside a cavity between the A (red) and B (blue) subunits, positioned underneath the C-tail (F307-L309) of the C-subunit (orange). The phenoxazine moiety of DT-061 stacks on a solvent exposure interface area between the C-tail of the C-subunit and the A-subunit. (C) A close-up view of DT-061 (green) partly buried in a cavity between A (red) and B (blue) subunits directly adjacent to the C-tail (F307-L309) of the C subunit (orange). Cryo-EM density of DT-061 and C-tail illustrated by respectively colored meshes. L309 methylation is highlighted in blue ball and stick model. (D) Atomic details of DT-061 binding pocket. Side-chain of residues involved in formation of the binding pocket are colored in red, blue and orange for A, B and C subunits respectively. (E) Representative micrographs and 2D class averages, with (F) schematics, of AB56αC holoenzyme complex without DT-061 (top, blue box) and with DT-061 (bottom, red box). The black scale bar is 200 Å. (See also Figure S3 and Table S1).
DT-061 binds in a unique pocket formed at an intersubunit junction and interacts with residues from all three PP2A subunits (Fig. 3A–D). The trifluoromethoxy end of DT-061 reaches deep into a pocket to interact with E100 and E101 of the A subunit and K316 of the B subunit. The hydrophobic benzene ring is buried within a cavity formed mainly by hydrophobic residues including I237, Y238 and F317 of the B subunit and F308 of the C subunit. The sulfonyl group forms electrostatic interactions with K283 of the B subunit. While the majority of DT-061 is buried inside the binding pocket, the solvent exposed phenoxazine moiety bridges between Y307 and P305 of the C subunit and T102 and V103 of the A subunit (Fig. 3A–D; Fig. S3). Despite evidence of an inherently flexible C-tail in PP2A holoenzymes (Cho and Xu, 2007; Xu et al., 2006), the interaction formed between DT-061 and Y307 of the C subunit pins the C-tail in the cleft formed by the A and B subunits, which likely contributes to enhanced stability of the assembled complex. The environment created at this trimeric junction, unique to the B56α heterotrimer, thereby explains the molecular specificity of DT-061.
To confirm the assigned density for DT-061 in our model, we prepared EM-grids with recombinant AB56αC trimer in the absence of DT-061 for comparison. Confirming our biochemical observations, in the absence of DT-061 the recombinant AB56αC trimer was unable to remain in its heterotrimeric composition during EM-grid preparations, resulting in heterogeneous sub-complexes with a majority of monomeric and dimeric two-dimensional class averages calculated from electron micrographs (Fig. 3E, F, blue box). Addition of DT-061 however, resulted in a homogeneous distribution of AB56αC trimers as demonstrated by the two-dimensional class averages (Fig. 3E, F, red box; Fig. S3). These observations demonstrate how the unique stabilizing mechanism of DT-061 empowered us to solve the structure of an otherwise elusive and asymmetric phosphatase heterotrimer.
Structure based design of inactive DT-061 chemical derivatives confirms binding pocket, biochemical stabilization, and apoptotic effects of DT-061.
While these structural observations confirmed that DT-061 functions to directly stabilize AB56αC trimers, we set out to validate the assigned binding pocket and further decipher the requisite components for DT-061 binding specificity. To do this, we strategically modified DT-061 to disrupt critical hydrogen bonding networks or to create steric hinderance that would interfere with DT-061 binding to PP2A (Fig. 4A). These chemical derivatives of DT-061 (addition of one methyl group = NZ-035, two methyl groups = NZ-043, or one benzene group = NZ-044) do not stabilize the recombinant AB56αC heterotrimer as shown by FP (Fig. 4B). In line with the inability to stabilize AB56αC heterotrimers, these derivative compounds did not induce apoptosis in standard cell culture conditions and had a significantly reduced effect in low serum culture conditions as determined by GI50s (Fig. 4C; Fig S4A) (Kauko et al., 2018; McClinch et al., 2018; Sangodkar et al., 2017a; Tohmé et al., 2019). Thus, these strategic chemical modifications of DT-061 help to validate the assigned binding pocket of the active compound while highlighting the structural specificity required to accommodate binding, present only in specific B-subunit containing PP2A heterotrimers.
Fig. 4. Structure based design of inactive DT-061 chemical derivatives confirms binding pocket, biochemical stabilization, and apoptotic effects of DT-061.
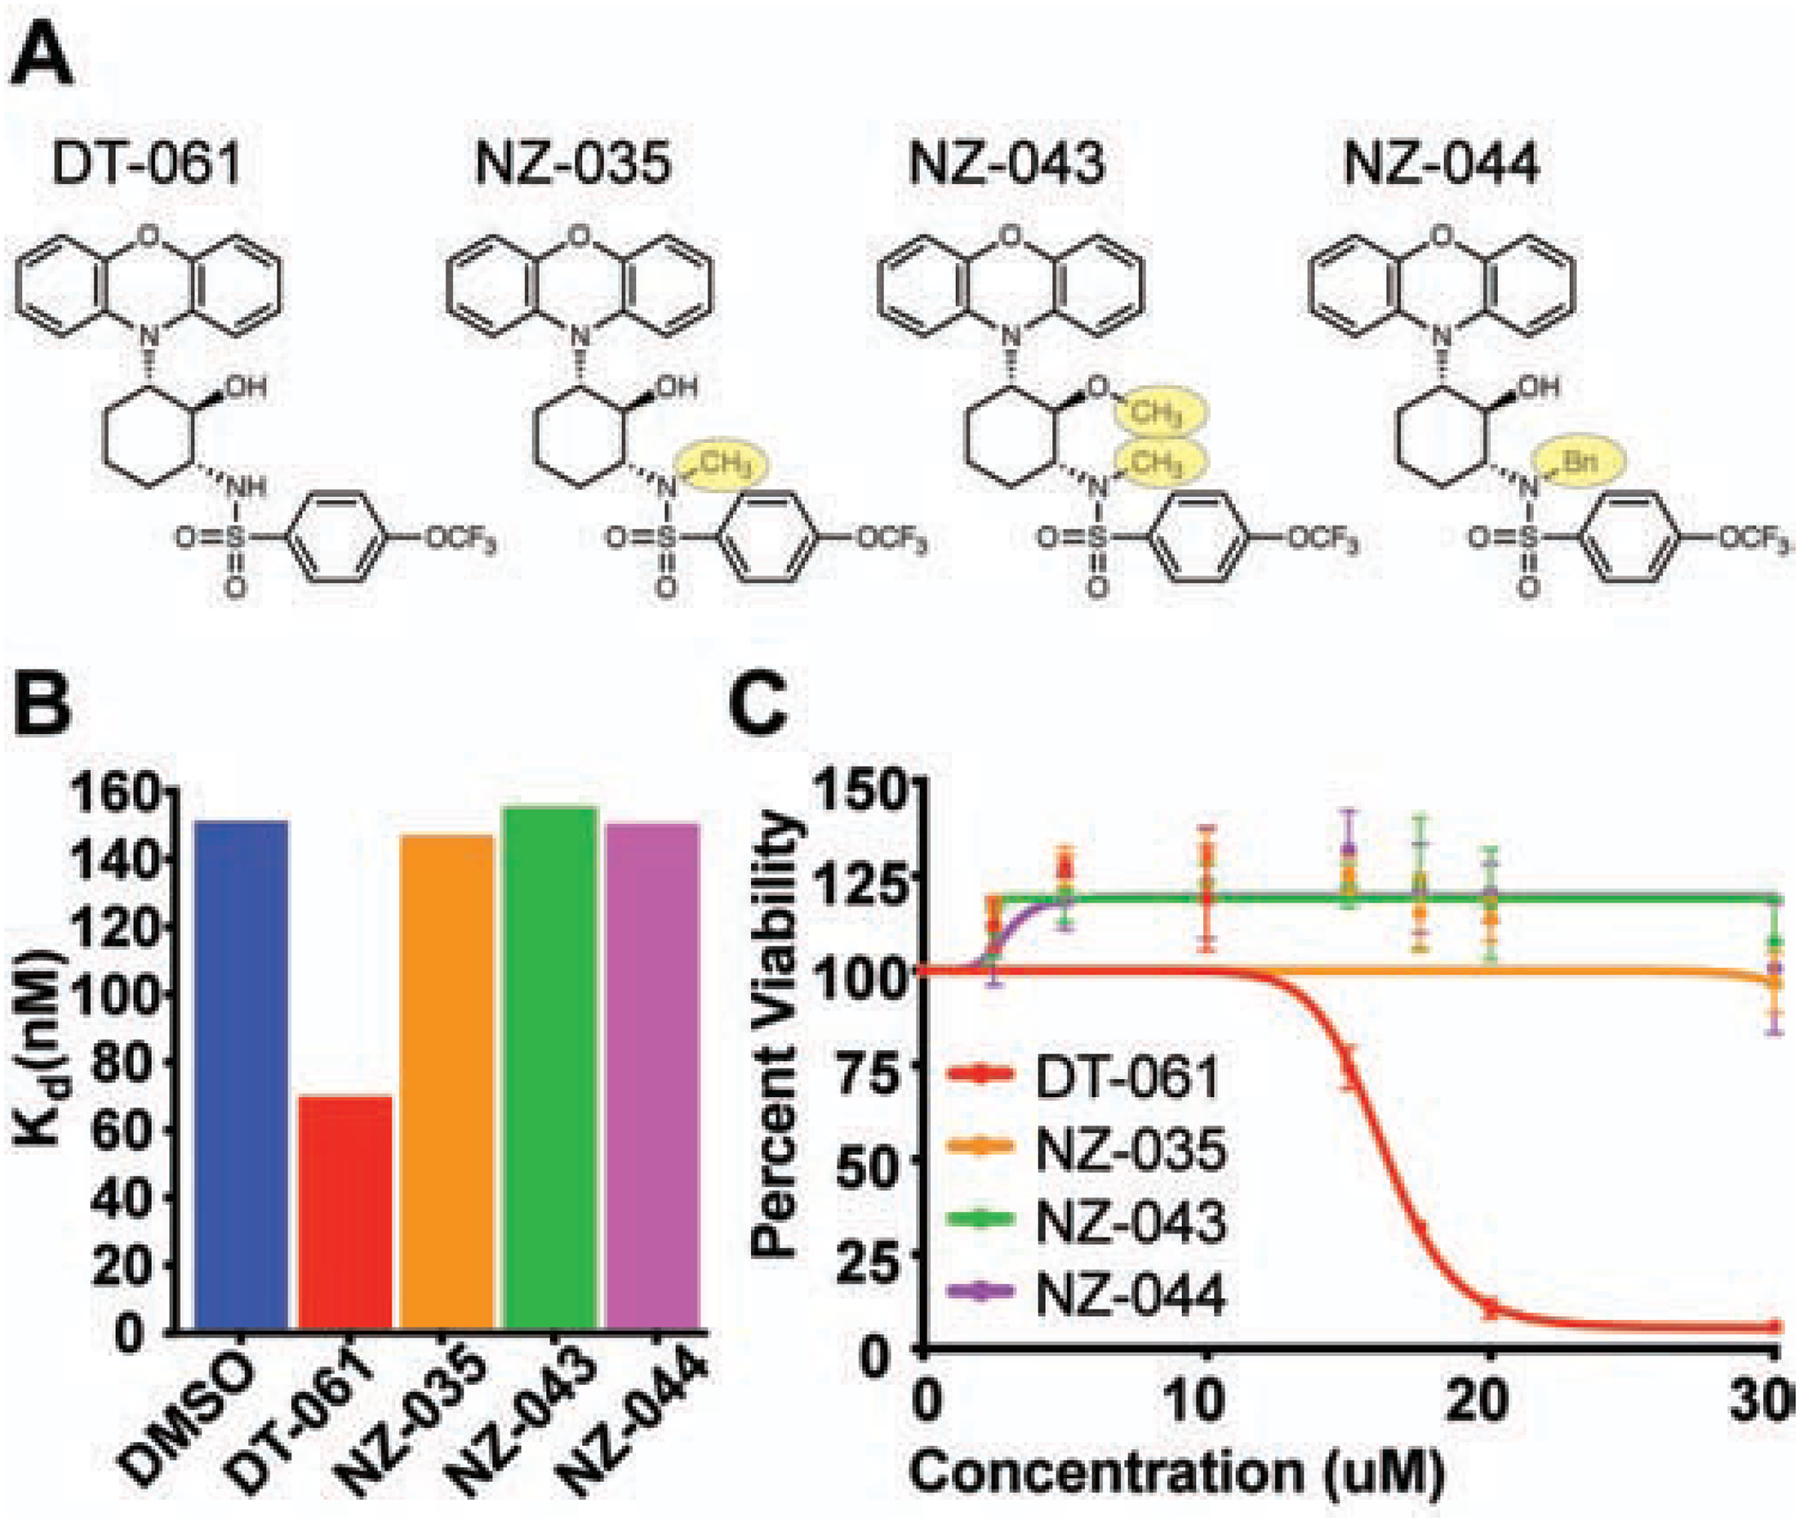
(A) DT-061 chemical derivative structures with one methyl group (-CH3; NZ-035), two methyl groups (NZ-043) or a benzene (Bn; NZ-044) group added. (B) Fluorescence polarization determined affinities of wildtype B56α with AC in the presence of DT-061 or the derivative compounds demonstrates that all derivative compounds lose the ability to stabilize B56α to the AC dimer. (C) Cell viability dose response curves of H358 lung adenocarcinoma cells treated with DT-061 (red line), NZ-035 (orange line), NZ-043 (green line), or NZ-044 (magenta line) at 24 hours. In line with the inability to stabilize B56α heterotrimers, all derivative compounds demonstrate a complete loss of apoptotic potential. (See also Figure S4).
DT-061 dependent B subunit selection is class and isoform specific
The structural diversity of each B subunit class (B55, B56, PR72) is vital for the divergence in PP2A holoenzyme assembly and substrate specificity. Using structural models of the B55α (Xu et al.2006)and PR70 (Wlodarchak et al., 2013b) PP2A heterotrimers solved by x-ray crystallography, we examined the putative DT-061 binding pocket at the analogous subunit interface of each heterotrimer. This comparison illustrated the highly divergent structural landscape of this interface, as would be expected, with B55α and PR70 heterotrimers lacking the unique characteristics of the DT-061 binding pocket (Fig. S4B). To investigate B subunit selectivity, and to further validate the selective binding of DT-061, we examined the degree of conservation between the various B56 isoforms within the DT-061 binding pocket. Sequence conservation among the B56 family members predicts that the pocket occupied by DT-061 is slightly varied in each B-subunit containing heterotrimer (Fig. S5). While many of the B56α residues that interact with DT-061 in the structure of the PP2A heterotrimer are conserved within the B56 family, changes in isoform sequence are expected to promote structural conformations that distort the binding pocket in PP2A complexes formed with other B56 isoforms. For example, unlike B56α-PP2A, stability of the B56γ -PP2A complex is not affected by DT-061 (Fig. 2D). Notably, B56γ contains a lysine substituted for threonine at the analogous 281 position of B56α that forms a salt bridge with E101 of the A subunit in the assembled AB56γC PP2A heterotrimer (Fig. 5A–C) (Cho and Xu, 2007; Xu et al., 2006). This salt bridge occupies the space between the A and B56 γ subunits, and would occlude the putative DT-061 binding pocket in the assembled AB56γC complex. Therefore, we made a single amino acid substitution at this position (T281K) in the B56α subunit and determined the ability of DT-061 to stabilize the assembled PP2A heterotrimer. As expected, the stabilizing effect of DT-061 on the T281K mutant AB56αC heterotrimer and enhanced affinity of B56α for AC observed by SEC, FP, and SPR, was completely lost (Fig. 5D–F). These data reveal that binding of DT-061 is selective even within the structurally similar B56 family of PP2A complexes.
Fig. 5. DT-061 dependent B subunit selection is class and isoform specific.
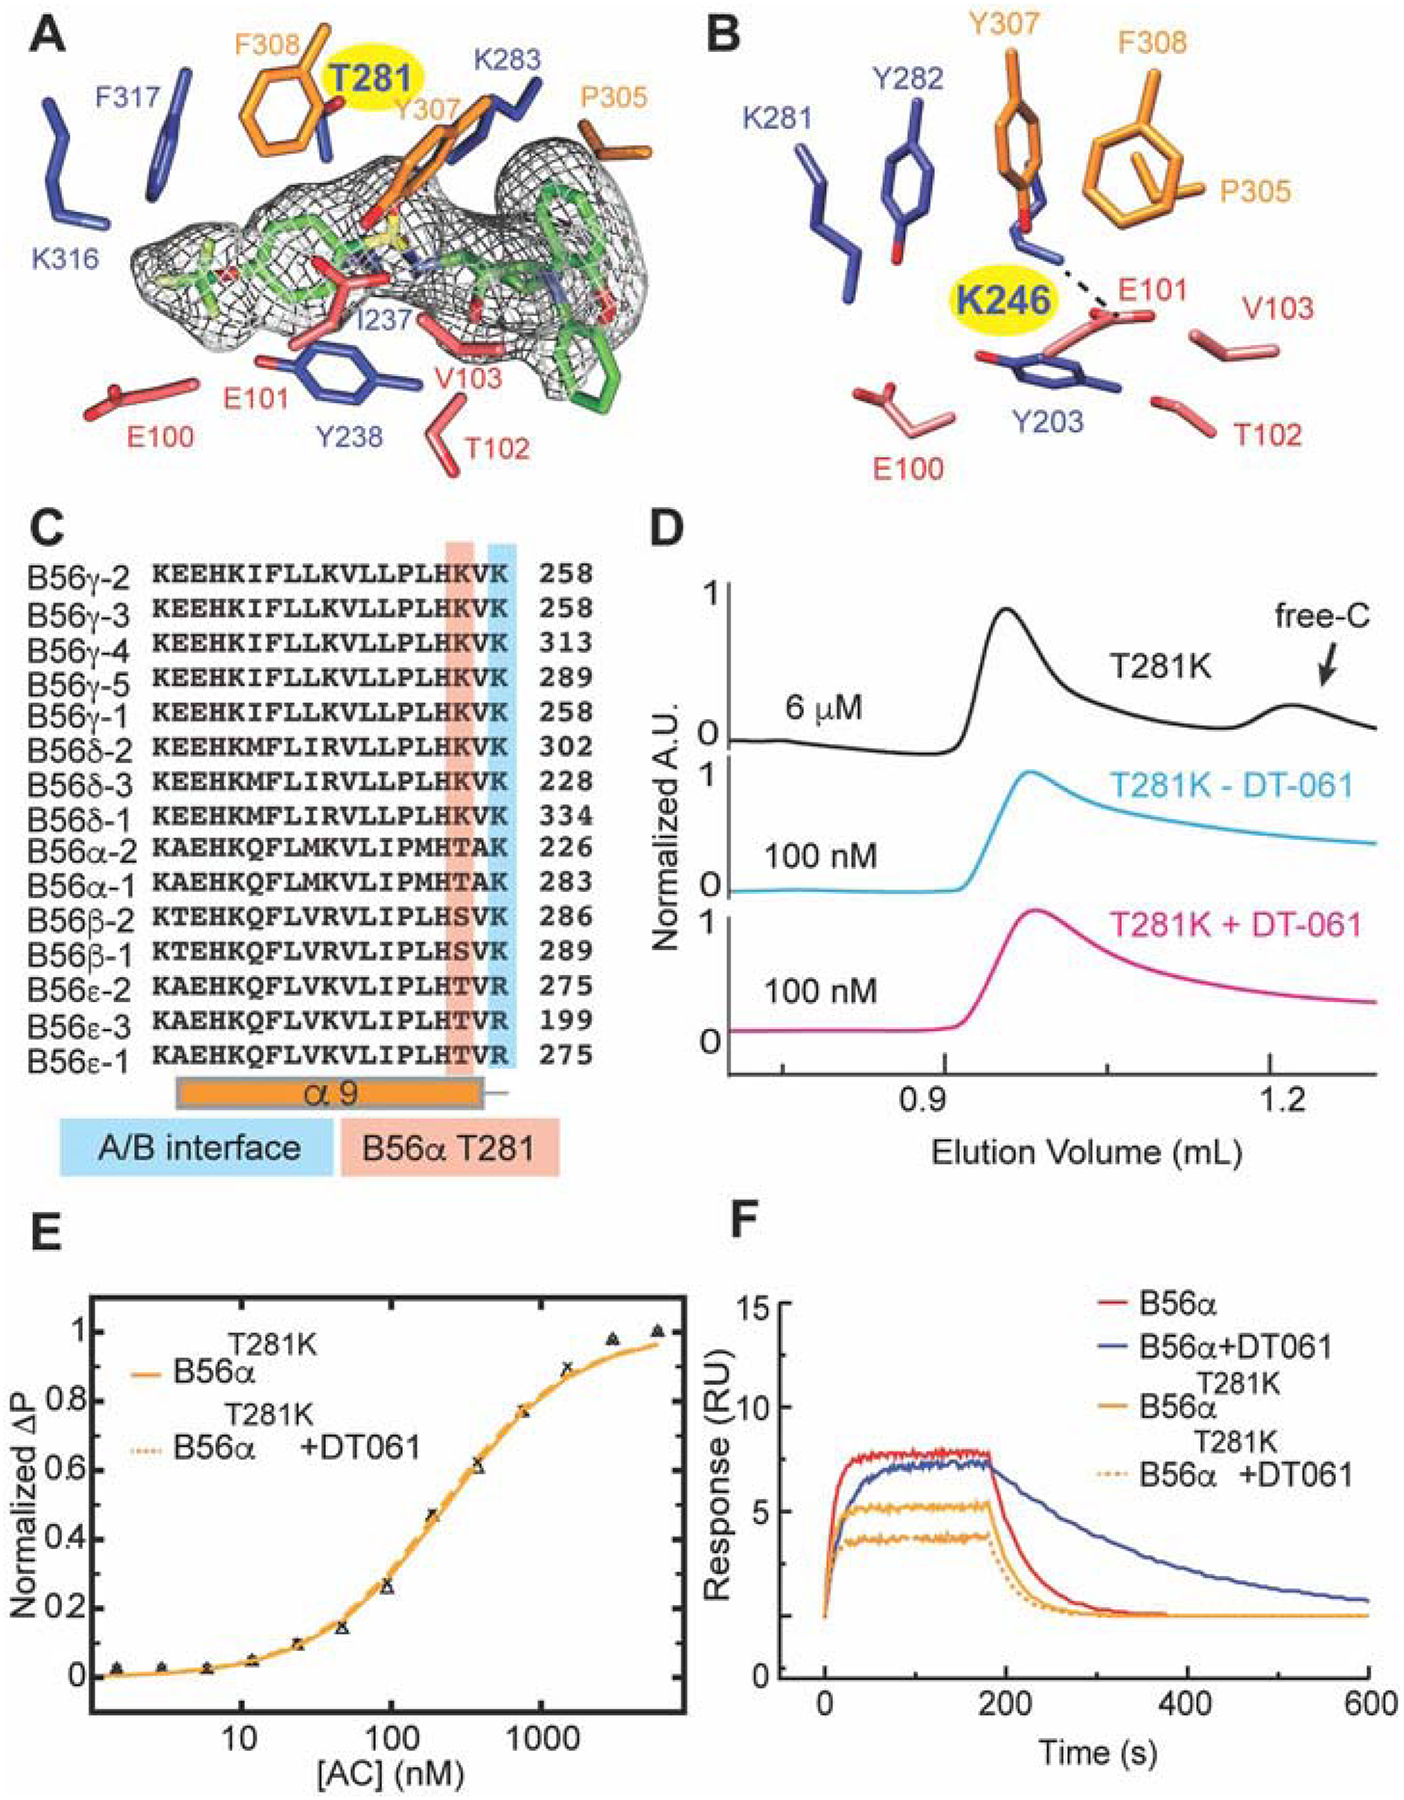
(A) The DT-061 (EM density in mesh) binding region in the AB56αC holoenzyme as compared to that of (B) the previously determined AB56γC holoenzyme. The T281 residue in AB56αC is represented by a lysine (yellow highlight) at the analogous position (K246, yellow highlight in B) in AB56γC, which forms a salt bridge with E100 of the A subunit (dashed line). (C) Sequence alignment of the 15 different B56 subunits demonstrating the divergence of the analogous T281 position. (D) A single point mutation, T281K, of B56α, mimicking B56γ at this position, forms a complex with AC dimer at 6 μM concentration (black line) that dissociates at 100 nM concentration (cyan line) that is not rescued by addition of DT-061 (100 nM, pink line). (E) Fluorescence Polarization and (F) SPR of the T281K B56α mutant with AC dimer determined in the absence (solid line) and presence of DT-061 (dashed line) illustrates that the binding kinetics and overall affinity of the mutant complex is unaffected by DT-061. (See also Figure S4 and S5).
Methylation of the PP2A catalytic subunit correlates with DT-061 activity in vivo
Understanding the mechanistic details of DT-061 driven PP2A regulation allowed us to next investigate potential biomarkers of target engagement or therapeutic efficacy. A central component of PP2A biogenesis that regulates the capacity of select B subunits, notably B56α, to bind the AC dimer is methylation of the L309 residue of the catalytic subunit. To explore the status of PP2A L309 methylation in response to DT-061 treatment we designed an in vivo single dose time course experiment. IHC analysis from this single dose study revealed a significant increase in mL309 at early time points (one, two, and three hours) after DT-061 treatment followed by a return to basal levels by 12 hours post treatment (Fig. 6A; Fig. S6). This transient increase in L309 methylation and subsequent return to baseline was validated by immunoblotting tumor lysate for mL309 and total PP2A-C (Fig. 6B, C; Fig S6). Interestingly, these L309 methylation kinetics mirror the enhanced binding kinetics and trimerization experiments of B56α previously identified in cell-based studies (Fig. 1A, B). Additionally, the observed changes in mL309 positively correlate with DT-061 serum concentration (Fig. S6). Importantly, the DT-061 treated tumors revealed no changes in expression of PME-1 or LCMT-1, the key enzymes that regulate C-subunit methylation (Fig. S6). The increase in methylated C-subunit observed upon DT-061 treatment is, instead, most likely due to the effect of stabilizing the already methylated B56α heterotrimers, which are conceivably more resistant to PME-1 mediated demethylation as compared to the more accessible AC heterodimer.
Fig. 6. Methylation of the PP2A catalytic subunit correlates with DT-061 activity in vivo.
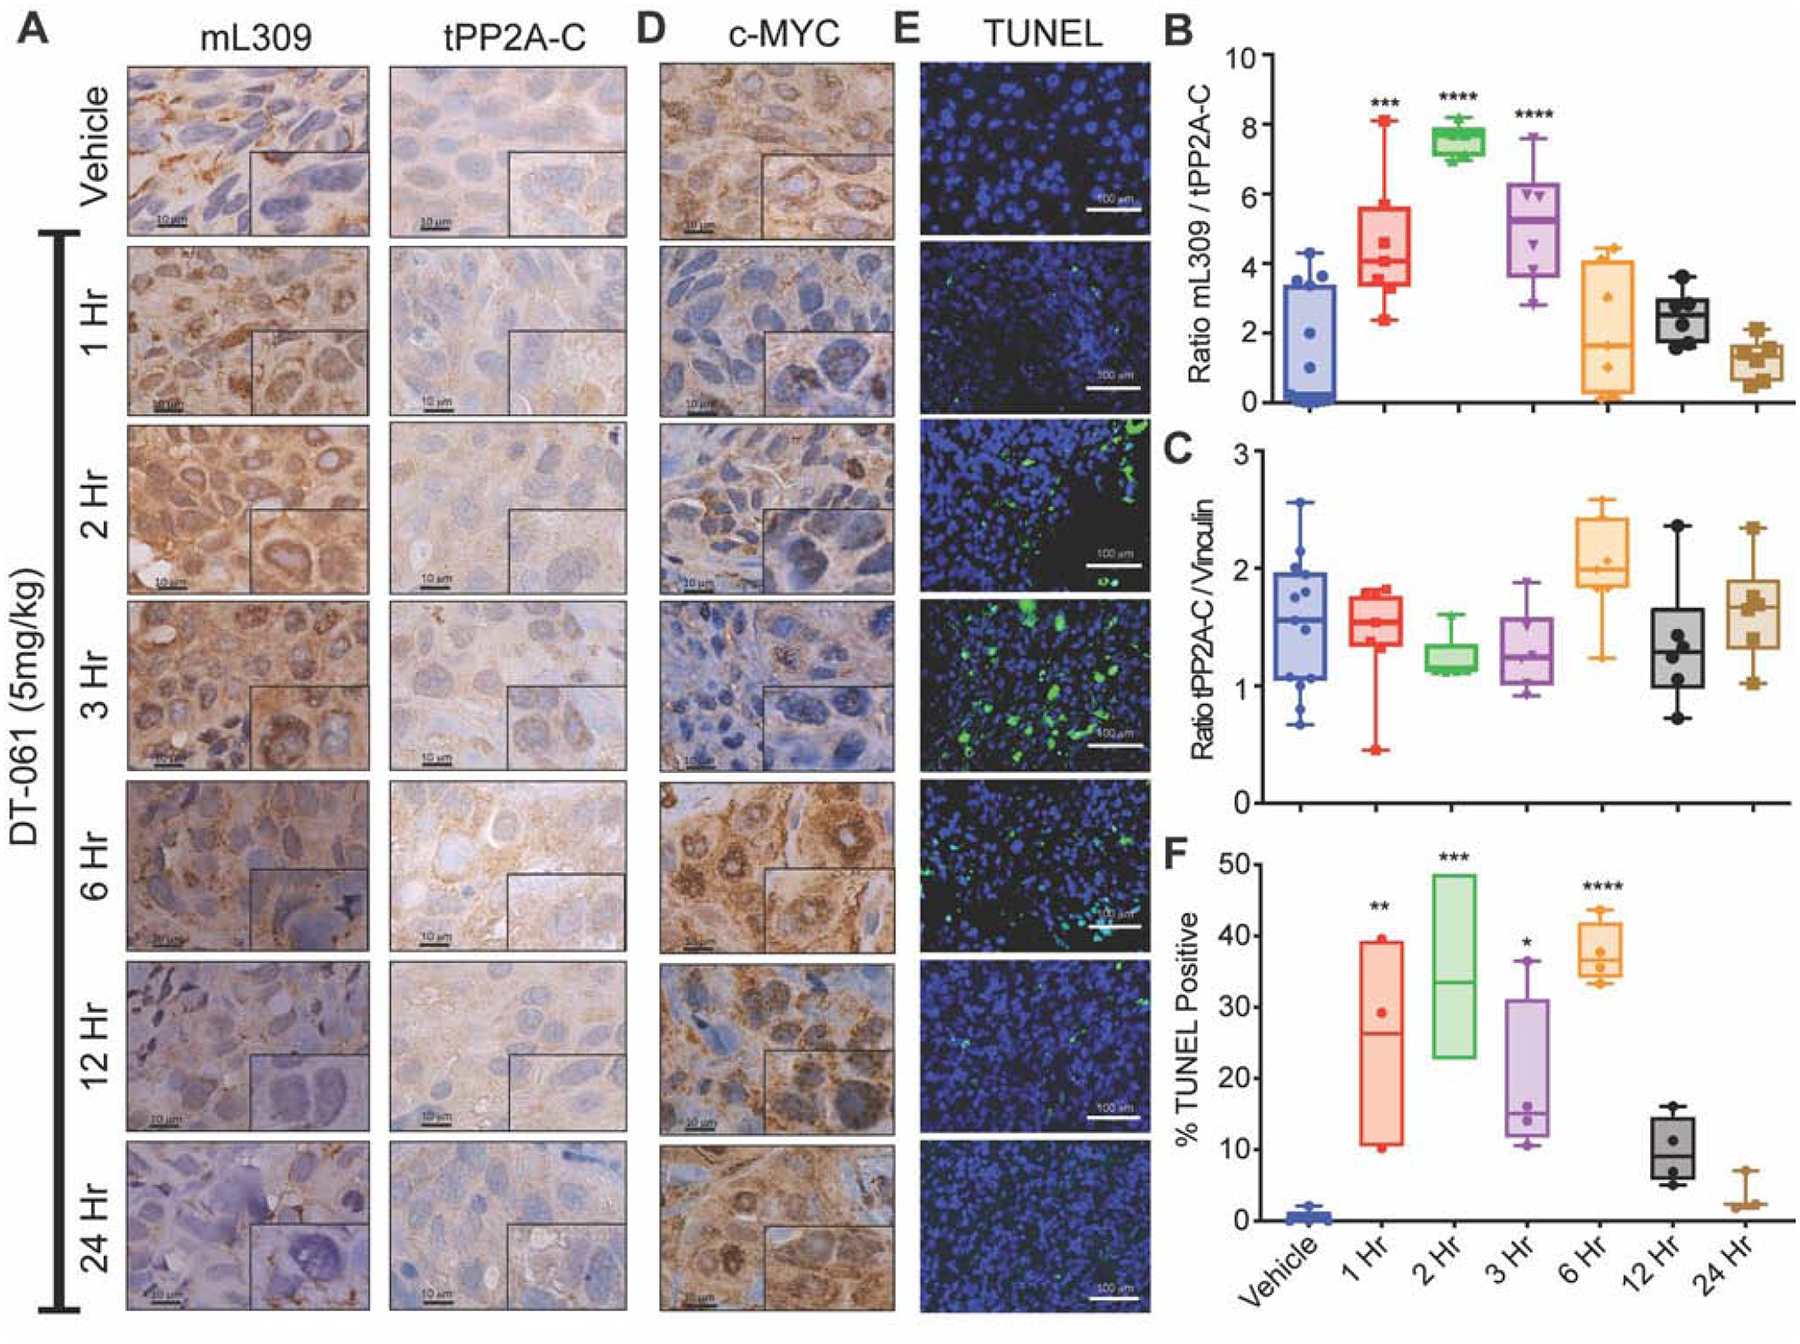
(A) Immunohistochemical analysis of xenograft treated tumors probed for mL309 (left) or tPP2A-C (right) demonstrates an increase in mL309 at early time points following DT-061 treatment. Representative images from each time point (n=4–6) are shown at 100x magnification, black scale bar is 10 μM. Densitometric quantification of western blots probed for (B) methyl-L309 PP2A-C (mL309), (C) total-PP2A-C (tPP2A-C) and vinculin from tumors treated with a single dose of DT-061 (5mg/kg) for the designated times (n=5–13 tumors per group) mirrors the IHC data whereby DT-061 treatment enhances mL309 between 1–3 hours after treatment followed by a return to baseline. Individual data points represent ratios, mL309/tPP2A-C or tPP2A-C/Vinculin. Box-whiskers represent average ± s.d. one-way parametric ANOVA with Dunnett multiple comparison test presented comparing treated groups to vehicle control, *** = p < 0.001, **** = p < 0.0001. (D) Immunohistochemical c-MYC staining of single dose vehicle or DT-061 treated xenograft tumors demonstrate PP2A activation by DT-061 inversely correlates with changes in c-MYC detected in vivo. Images are recorded at 100x magnification, black scale bar is 10 μM. (E) Representative fluorescent microscopy images of treated and control H358 xenograft tumors resected at 1, 2, 3, 6, 12, or 24 hours after DT-061 treatment, stained for TUNEL and counterstained with DAPI, white scale bar is 100 μM. (F) Quantification represents percentage of TUNEL-positive cells per treatment group. Bar graphs represent average ± s.d. one-way parametric ANOVA with Dunnett multiple comparison test comparing treated groups to vehicle control, * = p < 0.05 ** = p < 0.01 *** = p < 0.001. (See also Figure S6)
As one of the most well characterized substrates of AB56αC holoenzymes and a potent oncoprotein, we next investigated the status of c-MYC in the DT-061 treated tumors. IHC analysis from the single dose treated xenograft tumors demonstrates a significant to near complete loss of c-MYC at early time points (one, two, and three hours) following DT-061 exposure, which return to basal levels by 6 hours (Fig. 6D). The kinetic loss and regain of c-MYC following DT-061 treatment demonstrates a remarkable inverse relationship with L309 methylation (Fig. 6A–D). Additionally, fluorescent labeling of DNA fragments generated from late-stage apoptotic tumor cells (TUNEL Staining) from the various DT-061 treatment time points indicates a clear and significant induction of apoptosis that closely trends with the changes in C-subunit methylation upon SMAP treatment (Fig. 6E, F). Taken together, these observations further support the use of L309 methylation as a potential pharmacodynamic marker of DT-061 enhanced stabilization of active AB56αC holoenzymes.
Methylation and interactome deficiencies drive DT-061 resistance in a recurrent cancer derived PP2A-A mutation, R183W, in vivo.
An arginine to tryptophan substitution at position 183 (R183W) of the A subunit represents the most recurrent cancer derived mutation within the PP2A gene family. Co-IP of isolated PP2A-A from H358 cells demonstrates that this mutation correlates with significantly less L309 methylated C-subunit bound, while having no effect on overall C-subunit binding or expression (Fig. 7A, B). In line with previous reports, the R183W scaffold mutant also demonstrates a significant decrease in binding to many B regulatory subunits, most notably B56α, in vivo and is unable to recapitulate the tumor suppressing phenotype observed with overexpression of WT-A (Fig. 7C, D; Fig. S7) (Chen et al, 2005; Chen et al., 2004; Haesen et al., 2016; O’Connor et al., 2019; Sablina et al., 2010; Taylor et al., 2019). Given the loss of B56α subunit binding and diminished L309 methylation, R183W mutant cells provide an ideal, clinically relevant tool to test the proposed mechanism of DT-061. Xenograft tumors, expressing either V5-tagged EGFP, WT-A, or R183W-A scaffold subunit were treated with either DT-061, a dual kinase inhibitor combination (AZD6244/MK2206), or vehicle control for 30 days. Whereas the dual kinase inhibitor treatment demonstrated ~70–90% tumor inhibition across all three lines, the tumor suppressive effects induced by DT-061 treatment in EGFP and WT-A tumors was absent in cells expressing the R183W mutant scaffold (Fig. 7D; Fig S7). Additionally, mass spectrometry analysis of co-IP scaffold subunit from these tumors revealed that these resistant R183W-A expressing cells contained reduced levels of PP2A-C L309 methylation (Fig. 7E) and showed no change in B56α holoenzyme composition after treatment with DT-061 (Fig 7F). These observations further support the notion that DT-061 stabilizes B56α-PP2A heterotrimers to drive the described apoptotic effects and highlights L309 methylation as a potential clinical biomarker.
Fig. 7. Methylation and interactome deficiencies drive DT-061 resistance in a recurrent cancer derived PP2A-A mutation, R183W, in vivo.
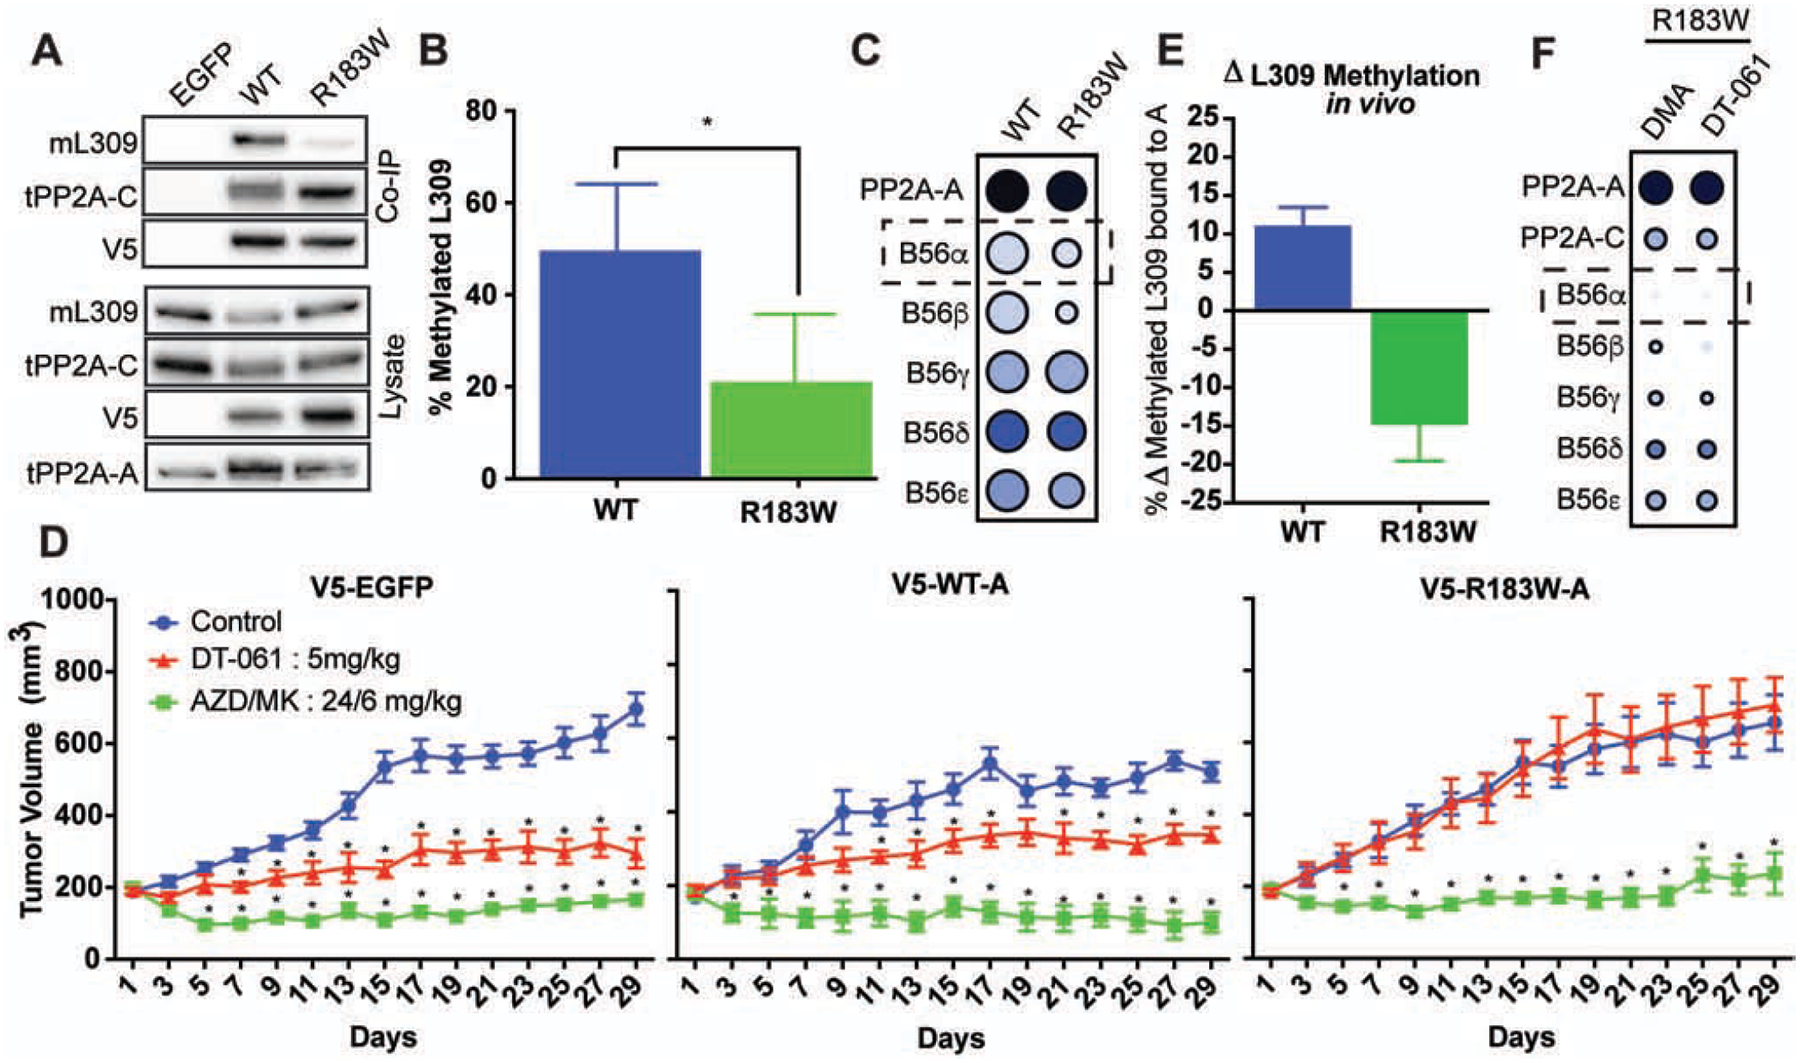
(A) Western blot of co-IP and lysate samples from H358 cells expressing V5 tagged EGFP, WT scaffold, or R183W mutant scaffold subunit. Lysate probed for methylated L309 (mL309), total PP2A-C (tPP2A-C), V5, and total PP2A-A (tPP2A-A), demonstrate marked reduction in mL309 in R183W holoenzymes. (B) Percent of L309 methylation of the PP2A catalytic subunit bound to WT-A or R183W-A holoenzymes in cell culture as determined by mass spectrometry. (C) Co-IP of V5-tagged WT versus R183W PP2A-A from H358 tumors followed by mass spectrometry and SAINT analysis of co-immunoprecipitated proteins, expressed as dot-plots using ProHits-viz, indicates R183W mutant has dramatic deficiencies in B-subunit binding, particularly B56α. Color intensity of dot represents raw spectral count, size of dot represents normalized intensity, intensity of dot border represents statistical confidence. (D) Subcutaneous xenograft tumors expressing V5 tagged EGFP (left), WT scaffold (middle), or R183W scaffold subunit (right), treated with DMA control (blue line), dual kinase inhibitor combination (AZD6244/MK2206, 24mg/kg:6mg/kg, green line), or DT-061 (5mg/kg, red line). (E) Co-IP of WT scaffold and R183W scaffold subunit from xenograft tumors treated with DMA or DT-061 for 29 days demonstrates that WT holoenzymes have ~10% more L309 methylation after DT-061 treatment while R183W holoenzymes have a reduction in L309 methylation as determined by mass spectrometry. (F) Co-IP, mass spectrometry, SAINT analysis, and ProHits dot-blot visualization of R183W interactome in tumors treated with either DMA (left) or DT-061 (right) demonstrates no significant increase in B56α containing mutant holoenzymes with DT-061 therapy. (See also Figure S7).
Discussion
The dysregulation of phosphorylation-dependent signaling events is a hallmark of human disease and the targeting of these aberrant phosphorylation processes have proven clinically efficacious. Despite this success, biased activation of phosphatases, the key “off” switch in these signaling cascades, has been almost entirely disregarded due to hurdles in the identification and validation of druggable pockets to promote activation of these enzymes and the inherent complexity involved in directing substrate specificity.
Specific protein complex stabilizing effects by a small molecule, such as that with DT-061, is a mechanism distinct from other established therapeutic agents. We show that DT-061 binds a unique heterotrimeric regulatory pocket to selectively stabilize the B56α-PP2A holoenzyme thereby inducing cell death and attenuating tumor growth through B56α directed substrate dephosphorylation, including its most well characterized substrate, the oncogenic protein c-MYC (Allen-Petersen et al., 2018; Arnold and Sears, 2006; Farrell and Sears, 2014; Sheppard et al., 2018). Based on this molecular insight, it is important in future work to refine the nomenclature for this class of “small molecule activators of PP2A”, or SMAPs, to reflect their selective nature.
Importantly, our work ascribes a mechanistic link to many previous observations which have remained elusive for decades. For instance, the parent phenothiazine and dibenzapine compounds from which the current generation of SMAPs were engineered, were first identified to have apoptosis-inducing effects in an unbiased drug screen designed to identify compounds with activity against c-MYC driven T-ALL (Gutierrez et al., 2014). Gutierrez et al demonstrated that these phenothiazine and dibenzapine compounds promoted dephosphorylation of many PP2A targets, including c-MYC and AKT. More recently, we have shown that DT-061 treatment results in significant tumor suppression in engineered c-MYC overexpressing models of lung cancer which is markedly attenuated with the nondegradable phospho-mimetic S62D c-MYC mutant (Kauko et al., 2018). Given the well-established role of B56 containing PP2A holoenzymes, particularly B56α, in dephosphorylating S62 of c-MYC (Arnold and Sears, 2006), it is now evident that the described effects of DT-061 to stabilize B56α containing holoenzymes would naturally lead to the decrease in c-MYC observed in these previous studies.
Insight into the unique trimeric pocket recognized by DT-061 allows for the pursuit of structure-based design around this DT-061 binding pocket in an effort to further refine the pharmacodynamic and selective properties of this class. Understanding the importance of B56α in this approach also empowers us to investigate cellular characteristics ideal for clinical placement of these molecules. For example, how relative B56α expression in various malignancies correlates with sensitivity or resistance to this therapeutic approach becomes a pertinent follow up question based on the findings described. Additionally, these insights raise the question, how will these molecules or this approach function in settings of PP2A dysregulation secondary to the overexpression of endogenous PP2A inhibitors such as CIP2A? In addition to clinical positioning in oncologic settings, this class of molecules can be further expanded to B56α dysregulated diseases such as cardiovascular diseases, where aberrant B56α holoenzyme function is linked to dysfunction in cardiac remodeling and arrhythmogenesis (Bhasin et al., 2007; Kirchhefer et al., 2014).
In addition to defining optimal clinical parameters for single therapy SMAP treatment, these molecular insights provide a foundation for strategic pairing of complementary therapeutic approaches For example, combination of SMAPs with a dual kinase inhibitor cocktail (AZD6244/MK2206) in a mouse xenograft model of lung adenocarcinoma demonstrated either a partial response or complete tumor resolution in all treated animals, representing statistically better outcomes when compared to either treatment alone (Kauko et al., 2018). Importantly, phosphatase activation alone was inferior to the kinase inhibitor treatment alone. Taken together, these observations suggest that in the setting of some malignancies, phosphatase activation alone may be insufficient whereas combination with kinase inhibitors allows for drastic improvement in anti-tumor effects while providing an opportunity to decrease kinase inhibitor related toxicities. Additionally, Kauko et al. determined that PP2A inhibition functioned as a mechanism of kinase inhibitor resistance in cancer with the combination of DT-061 and a kinase inhibitor overcoming the initial therapeutic resistance (Kauko et al., 2018). These observations raise questions on the appropriate temporal application of such a combination approach, for instance, can primary combination therapy lead to more durable primary responses or should this approach be reserved for tumors that begin to display kinase inhibitor resistance and secondarily decreased PP2A activity?
Perhaps most importantly, our results serve as a framework for the development of other PP2A B subunit class and isoform specific molecules, with the logical and exciting expansion of this approach to other multimeric protein complexes. Neurodegenerative diseases, such as Alzheimer’s disease, demonstrate pathognomonic hyperphosphorylation of tau. Structural and biological studies have shown that tau hyperphosphorylation in neurodegenerative disorders is directly tied to PP2A dysfunction, in particular B55 holoenzyme dysfunction (Sontag and Sontag, 2014; Wang et al., 1995; Xu et al., 2008). Our results provide a rationale for structure-based drug design around the previously solved B55α heterotrimer structure in an effort to identify small molecules capable of stabilizing B55α complexes and thus driving dephosphorylation of pathogenic hyperphosphorylated tau in neurodegenerative diseases. The isoform specificity demonstrated in both the recombinant and biological systems presented also highlights the importance of pursuing atomic resolution structures of each B subunit isoform. It is these structural differences of each B subunit interface with AC that will allow for development of highly B-subunit specific molecules. In the context of other multimeric protein complexes, the closely related PP6 family of phosphatases is similar to PP2A in that it is composed of a catalytic core dimer which couples to a third, substrate-determining regulatory component (Brautigan and Shenolikar, 2018; Shi, 2009), and therefore provides a relatively similar framework to test this therapeutic complex stabilization strategy.
The unique DT-061 binding pocket reported here not only provides the structural basis for optimizing the next generation of SMAPs for clinical usage, but also showcases a previously underexplored concept for targeting protein-protein interfaces. Through stabilization, instead of destruction, it is now possible to selectively activate phosphatases against disease specific hyperphosphorylated substrates. These findings highlight the importance of exploring cavities at protein interfaces to potentially modulate protein-protein assembly, hence adjusting their downstream functions for both therapeutic and research-based applications.
STAR Methods
Lead Contact and Materials Availability
Further information and requests for resources and reagents should be directed to and will be fulfilled by the lead contact Goutham Narla (gnarla@med.umich.edu).
Experimental Model and Subject Details
Mice
All animal experiments and procedures were performed in compliance with ethical regulations and the approval of the Case Western Reserve University Institutional Animal Care and Use Committee (IACUC). Athymic nude mice were obtained from the Jackson Laboratory. All mice were housed in a pathogen-free animal barrier facility. All in vivo experiments were initiated with male mice aged 6 to 8 weeks.
Cell Lines
Human cell lines H358 and H293T, were purchased from ATCC and cultured in RPMI. All maintenance media was supplemented with 10% heat inactivated fetal bovine serum (FBS, ThermoFisher, SH3007003) and 1% penicillin/streptomycin (10,000 U/mL, GE Healthcare, SV30010), unless otherwise stated. All cells were cultured in a humidified atmosphere incubator containing 5% CO2 at 37°C. All cell lines underwent monthly testing for mycoplasma contamination (Lonza, LT07–710).
Method Details
Plasmids, Cloning, and Mutagenesis.
Promega NanoLuc Binary Technology (NanoBit) constructs were used according to manufacturer recommendations. Briefly, Large BiT and/or Small BiT split fragments were designed to flank either side of PPP2R1A alone (negative controls) or in combination. Lentiviral expression of SmBIT-n-terminal-PP2A-A-c-teriminal-LgBIT H358 cells were used for treatment experiments described. Promega NanoBRET Protein:Protein Interaction Technology constructs were designed to flank either PPP2R1A or PPP2R5A, with all possible protein-end combinations tested. NanoBRET constructs, NLF1-n-PP2A-A + HTC-HA-n-B56α-c-Halotag were transiently transfected in H358 and H293T cells for the data presented. Gateway V5-tagged lentiviral expression vector pLX304-PP2A-Aa was obtained by DNASU Plasmid Repository (HsCD00444402) deposited by The ORFeome Collaboration (Yang et al., 2011). pLX304-EGFP, pLX304-WT-A, pLX304-R183W-A was created by Gateway cloning EGFP or WT-A into the pLX304 vector, with respective site directed mutagenesis for generation of R183W. After cloning and mutagenesis all constructs were sequence verified by Sanger sequencing.
Gene Expression.
Lentiviruses were packaged in 293T cells using X-tremeGENE transfection reagent (Sigma, 63666244001) and the second-generation packaging constructs pMD2.G (Addgene, 12259) and psPAX2 (Addgene, 12260). Supernatant media containing virus was collected at 24 and 48 hours and supplemented with 4 μg/mL polybrene (Santa Cruz, sc-134220). Cells were transduced for 24 hours and cultured for 48 hours before being selected with Blasticidin (plx304 constructs) according to plasmid details.
Immunoblot Analysis.
Whole cell extracts were prepared by incubating cell pellets in lysis buffer containing 25 mM HEPES pH 7.5, 1mM MgCl, 0.1 mM MnCl2, 1% Triton-X, and 1mM DTT. Tumor extracts were prepared by mechanical homogenization of tissue in liquid nitrogen followed by solubilization in TPER tissue protein extraction reagent (ThermoFisher, 78510). All lysis buffers were supplemented with protease and phosphatase inhibitors (Roche, 05892791 & 09406837). Protein concentrations of cell extracts was determined by Pierce BCA Protein Assay (ThermoFisher, 23250) and equal quantities of protein were separated by SDS/PAGE 12% polyacrylamide gels (Bio-Rad, 456–8045) and transferred to nitrocellulose membranes (Bio-Rad, 1704158). Primary antibodies used in this study can be found in Table S1. Primary antibodies were detected with goat anti-mouse HRP (Abcam ab131368), donkey anti-rabbit HRP (GE Healthcare NA934), goat anti-rabbit IRDye (LI-COR Biosciences 926–32211) or goat anti-mouse (LI-COR Biosciences 926–68070) and visualized using either the Bio-Rad ChemiDoc XRS chemiluminescence imager or the LICOR Odyssey FC imaging system. Densitometric quantification was performed using the Bio-Rad Image Lab software and ImageStudio software. All tumor westerns were run at the same time although on separate gels. For densitometric quantification of targets probed from tumor samples, a control sample (C13) was run on all gels and all values or ratios were normalized back to this control, allowing for interpretation between gels.
Immunohistochemical Analysis.
Five micron sections from formalin-fixed paraffin-embedded (FFPE) specimens were deparaffinized in Histo-Clear and ethanol, exposed to 0.3% hydrogen peroxide to block endogenous peroxidase activity, and incubated for antigen retrieval with a citrate-based antigen unmasking solution (H-3300, Vector Laboratories) in a pressure cooker. Tumor sections were blocked with Mouse Ig Blocking Reagent (BMK-2202, Vector Laboratories), and incubated with mL309 (7C10) or tPP2A-C (ab106262) at 4°C for two nights. Washes were performed in PBS. Slides were subsequently developed using secondary anti-mouse immunoglobulins/HRP (K1497, Agilent), DAB peroxidase substrate as the chromagen, and hematoxylin for counterstaining. Slides were sealed, and randomized for subsequent blinded review. Two independent researchers (D.L. and S.I.) scored specimens for extent of mL309 staining based on composite score based on intensity and percent of positive cells.
TUNEL Staining.
The ApopTag Fluorescein In Situ Apoptosis Detection Kit (Millipore) was used according to the manufacturer’s protocol to perform the TUNEL assay. VECTASHIELD Mounting Medium with DAPI (Vector Laboratories) was used for counterstaining. The 3′-hydroxyl termini in the double-strand DNA breaks generated during apoptosis were labeled with FITC and DAPI as a nuclear stain for all cells. Quantification was performed through the cell counter function on ImageJ (NIH). ANOVA test was performed to test for a significant difference between apoptosis among the treatment groups.
Xenograft Tumor Formation and in vivo DT-061 Treatment Studies.
5×10⁶ H358 cells were resuspended in a 1:1 mix of RPMI:Matrigel and subcutaneously injected into the right flank of 6–8 week old athymic nude mice. Tumors were monitored and measured twice a week until study enrollment. For the DT-061 time-course analysis, tumors were grown to 300 mm3, then randomized into a control (DMA) 24 hour treatment group or a DT-061 (5 mg/kg BID) treatment group which included a 1 hour, 2 hour, 3 hour, 6 hour, 12 hour, and 24 hour group (7 total groups for randomization). After the respective treatment incubation, mice were sacrificed, serum and tumor tissue were harvested. Tumor tissue was both formalin-fixed for IHC and snap frozen, along with collected serum, in liquid nitrogen for immunoblotting or molecule exposure analysis, respectively. Serum was analyzed by Agilux Laboratories Inc. to determine serum concentrations of DT-061. For co-immunoprecipitation and interactome analysis studies, H358 tumors expressing V5-tagged PP2A-A scaffold subunit were harvested and injected as described above, then grown to 100 mm3, and randomized into a control (DMA) or DT-061 (5 mg/kg BID) treatment group, with treatment lasting 29 days. Two hours after the final treatment, tumors were harvested and snap frozen for immunoblotting and co-immunoprecipitation analysis. For in vivo treatment studies, DT-061 was dissolved in 10% DMA, 10% solutol, and 80% water.
V5 Affinity Purification-Mass Spectrometry (AP-MS) and Co-Immunoprecipitation Analysis.
Co-immunoprecipitation was performed according to the Dynabeads Co-Immunoprecipitation protocol with minor adjustments as described below (ThermoFisher, 14321D). Briefly, V5 antibody (Abcam, ab27671) was coupled at a concentration of 7 μg/mg of Magnetic Dynabeads. Tumor lysate from V5 tagged snap-frozen tumors was prepared as described above and 5mg of protein lysate was added to the conjugated/equilibrated V5-Dynabeads. The bead/protein complex was incubated for 30 minutes on a rocker at 4 degrees C, flow through was separated, and the bead protein complexes were washed three times with water in preparation for mass spectrometry analysis. On-bead digestion of protein from the beads was performed to allow subsequent AP-MS analysis. Briefly, magnetic beads were washed 3 times with 100mM Tris-EDTA (pH 8) and supernatant removed. Thirty microliters of 100mM Tris-EDTA (pH 8) was added to beads. Bead-bound proteins were reduced with 10mM dithiothreitol for 1-hour at 37°C, followed by alkylation with 25mM iodoacetaminde for 30min in the dark. After reduction/alkylation of proteins a dual digestion was performed with 0.3 micrograms of lysyl endopeptidase on a dry bath shaker for 1 hour at 37°C followed by the addition of 0.3 micrograms of trypsin with incubation overnight at 37°C. After digestion, samples were filtered with 0.22μM spin filters to remove any particulates prior to MS analysis (Costar Spin-X, Sigma-Aldrich). Peptides were sequenced using data dependent MS acquisition (DDA) as previously described (25). Fresh conjugated beads were prepared for each biological replicate, three biological replicates were performed for each experiment.
Cell culture treatment studies.
For NanoBiT experiments - H358 NanoBiT expressing cells were plated at 1×10⁵ H358 cells/mL in a 96-well format and grown for 24 hours in 10% FBS/1% Pen/Strep. Following attachment, cells were treated with 30 μM DT-061 prepared in DMSO (or DMSO alone), NanoGLOW reagent was added according to manufacturer instructions, and luminescence was monitored on a GloMax Discover at the designated time points following treatment. For NanoBRET experiments – H293T cells were plated at 2.2×10⁵ cells/mL and transiently transfected with the described NanoBRET constructs. 48 hours after transient transfection, NanoBRET 618 Ligand in OptiMEM with 10% FBS was added and cells were incubated for an additional 16 hours. Following incubation with the NanoBRET 618 Ligand, cells were treated with either 20 or 30 μM DT-061 prepared in DMSO (or DMSO alone). One hour after treatment, NanoBRET Substrate was added and the plate was read using a 450/50 and 610/LP dual wavelength filter. Acceptor/Donor ratios were calculated according to manufacturer instructions and values were normalized to DMSO treated cells. For CoIP experiments – H358 V5 tagged PP2A-A cells were plated at 1×10⁵ cells/mL in 1% FBS. Twenty-four hours after plating, cells were treated with 3 μM DT-061 in RPMI supplemented with 1% FBS. Ninety-six hours after continuous treatment, cells were harvested and V5-PP2A was co-immunoprecipitated according to the above described methods. For cell viability assays – Parental H358 cells were plated at 1×10⁵ H358 cells/mL in a 96-well format and grown for 24 hours in 10% FBS/1% Pen/Strep. Following attachment, cells were treated with either 1, 2.5, 5, 10, or 20 μM of DT-061, NZ-035, NZ-043, or NZ-044 prepared in DMSO (or DMSO alone). Twenty-four hours after treatment, MTT solution was added (final concentration of 1 mg/ml) for 2 hours. Following incubation with MTT reagent, media was removed, cells were washed with PBS, and the cells were lysed/reactions stopped using the MTT solvent, 4 mM HCL, 0.1% NP40 in isopropanol. Immediately after lysis, plate was shaken on an orbital shaker for 60 seconds and absorbance at 590 nm was measured using a plate reader.
Protein expression, purification and complex assembly.
All constructs were generated using Gibson assembly and point mutations were obtained using as standard PCR-based cloning strategy. Aα, B56α and its T281K mutant were overexpressed using BL21(DE3) strain with a glutathione S transferase (GST)-tag fused at the N-terminal followed by a TEV site. The proteins were purified as described previously (Cho and Xu, 2007). Briefly, protein expression was induced by the addition of 0.1 mM IPTG at OD 0.6, and cells were grown for an additional 18 hours at 18 °C. Cells were harvest by centrifugation, lysed using French press and spin at 18,000 x g for 1 hour. The soluble fraction was incubated with GST affinity beads pre-equilibrated with 50 mM Tris-HCl (pH 8.0), 250 mM NaCl, 3 mM β-mercaptoethanol at 4 °C for 1 hour followed by extensive washes. The beads were then incubated with TEV and dialyzed overnight at 4°C in 50 mM Tris-HCl (pH 8.0), 50 mM NaCl, 1 mM DTT. The beads were pooled into a filter column, and the elution fraction was applied into a HiTrap HQ 5 ml column (GE healthcare) pre-equilibrated with 50 mM Tris-HCl (pH 8.0), 1 mM DTT. Cα was expressed and purified by WuXi Biologics as previously described (Cho and Xu, 2007). Briefly, Cα was cloned into pFasbacHTB with an N-terminal 8xHis tag, expressed in Hi-5 suspension cells, affinity purified using Ni-NTA beads and further fractioned by IEX and SEC. The AB56αC holoenzyme complex was assembled by mixing highly purified A, C and B56a subunits at 1:1.1:1.5 ratio, and subsequently purified using the Superdex 200 size-exclusion column equilibrated with HBS buffer (50 mM HEPES, 1.5 mM Na2HPO4, 140 mM NaCl pH 7.0) (Fig. S2).
Analytical size-exclusive chromatography (SEC) of PP2A holoenzyme complexes.
Purified concentrated holoenzyme trimer were diluted to desired concentration in HBS buffer (50 mM HEPES, 1.5 mM Na2HPO4, 140 mM NaCl pH 7.0). For the analytical SEC experiments in Figure 3, all complexes were at a final concentration of 100 nM. Incubation with 2 μM of DT-061 was performed for 30 mins on ice. For each sample, 50 μL was injected on a Superdex 200 or Superdex 75 increase PC3.2 analytical column (GE healthcare) equilibrated with HBS with or without 2 μM of DT-061 on an HPLC system (Shimadzu) equipped with a mutli-wavelength UV detector. SEC peak positions and heights were determined using LabSolutions (Shimadzu), and half-width was calculated based on peak positions and heights in Matlab.
Electron microscopy.
3.5 μL aliquots of AB56αC holoenzyme with 2 μM of DT-061 applied onto in-house prepared grids (Bokori-Brown et al., 2016). The grids were blotted for 4 s with a blot force −5 at 4 °C and 100% humidity and plunge-frozen in liquid ethane using Vitrobot Mark IV (ThermoFisher). The sample was imaged on a Titan Krios transmission electron microscope operating at 300 kV with a nominal magnification of 130,000x. Movie stacks were recorded by a Gatan K2 Summmit direct electron detector and a Gatan GIF Quantum energy filter (slit width 20 eV) using the super-resolution mode. Defocus values varied from −1 to −3 μM. Each movie has 40 frames with a total electron does of 40 e/Å2 and a total exposure time of 10 s. Latitude was used for automated data collection. All stacks were motion corrected and does-weighted using MotionCor2 (Zheng et al., 2017) with a binning factor of 2, resulting a pixel size of 1.064 Å/pixel. The defocus values were estimated using Gctf (Zhang, 2016).
Cryo-EM image processing.
A total of 2,024 movie stacks were recorded in a 48-hour image session. 1,988 micrographs, after motion correction and CTF estimations, with a maximum resolution better than 4 Å were selected. 869,372 particles were auto-picked using Gautomatch with a diameter of 130 Å. After two-dimensional (2D) classification using Relion (Fernandez-Leiro and Scheres, 2017; Kimanius et al., 2016; Scheres, 2012), 2D class averages with clear secondary structure features were selected resulting in 275,606 particles (Extended Data Fig. 5b). The selected particles were subjected to 25 iterations of global angular search 3D classification using Relion (Fernandez-Leiro and Scheres, 2017; Kimanius et al., 2016; Scheres, 2012) with the ab initio model generated by cryoSPARC (Punjani et al., 2017) as the reference. The 3D class with most of the helix resolved, resulting 83,784 particles, were re-extracted with a box size of 336 pixel and refined using the non-uniform refinement (C1 symmetry) in cryoSPARC v2 (Punjani et al., 2017) yielding the final 3D reconstruction at 3.6 Å on the basis of Fourier shell correlation (FSC) 0.143 criterion (Rosenthal and Henderson, 2003). The FSC curves were corrected for the effects of a soft mask using high-resolution noise substitution (Chen et al., 2013). Local resolution variations were estimated using Relion-2.1 (Kimanius et al., 2016).
Molecule dynamics flexible fitting (MDFF) to build initial models.
All-atom MDFF simulations with explicit solvent model were performed starting from initial structures built based on crystal structures of B56γ holoenzyme complex (PDB entries: 2IAE and 2NPP) (Cho and Xu, 2007; Xu et al., 2006) with DT-061 docked into the additional density assigned for the ligand. The system was built with the force fields of AMBER99ff14SB (Maier et al., 2015) and the parameters for DT-061 were generated using GAFF2 (Wang et al., 2004) and ANTECHAMBER (Wang et al., 2006). The system was placed in a rectangle water box with 16 Å padding and 24 charge-neutralizing sodium ions with additional salt (Na+, Cl-) around the solute, resulting in 150 mM salt condition, using the Amber16 LEaP module (Salomon-Ferrer et al., 2013). Input files for MDFF were prepared by the mdff package using VMD 1.9.3 (Humphrey et al., 1996; Singharoy et al., 2016) with the gscale = 0.2 and sampled for 100 ns using NAMD2 (Phillips et al., 2005) on a Nvidia P100 GPU card.
Structure refinement.
Snapshots every 1 ns from MDFF trajectory were used as the initial model and refined in real space using PHENIX with structure and geometry restraints (Adams et al., 2010). Parameters for DT-061 and methylated Leu309 in the C subunit were prepared using eLBOW (Moriarty et al., 2009). The structure with the best refinement statistics was chosen the atomic model manually improved using COOT (Emsley et al., 2010). Map validations were performed using PHENIX (Adams et al., 2010). The final atomic model was evaluated using MolProbity (Chen et al., 2010).
Synthesis of N-((1R,2R,3S)-2-hydroxy-3-(10H-phenoxazin-10-yl)cyclohexyl)-N-methyl-4-(trifluoromethoxy)benzenesulfonamide (NZ-035).
To a solution of N-((1R,2R,3S)-2-hydroxy-3-(10H-phenoxazin-10-yl)cyclohexyl)-4-(trifluoromethoxy)benzenesulfonamide DT-061 (0.300 g, 0.576 mmol) in DMF (1.85 mL) was added iodomethane (0.098 g, 0.691 mmol) and potassium carbonate (0.119 g, 0.864 mmol). The reaction mixture was stirred for 20 h at RT. The mixture was partitioned between water and ethylacetate. The organic layer was washed with saturated aqueous sodium chloride solution, and concentrated in vacuo. The residue was dissolved in a minimal amount of dichloromethane and purified by flash chromatography (SiO2, 17%−20% ethylacetate-hexanes) to afford N-((1R,2R,3S)-2-hydroxy-3-(10H-phenoxazin-10-yl)cyclohexyl)-N-methyl-4-(trifluoromethoxy)benzenesulfonamide NZ-035 (0.165 g, 54%) as a white solid. 1H NMR (600 MHz, MeOD) δ 8.01 (2H, d, J = 10.8 Hz), 7.45 (2H, d, J = 9.6 Hz), 7.00 (2H, d, J = 9.0 Hz), 6.91 (2H, t, J = 9.0 Hz), 6.82 (2H, t, J = 9.0 Hz), 6.74 (2H, d, J = 9.0 Hz), 4.03 (1H, t, J = 11.4 Hz), 3.86–3.81 (1H, m), 3.54–3.49 (1H, m), 2.83 (3H, s), 1.97–1.94 (1H, m), 1.86–1.75 (2H, m), 1.64–1.56 (2H, m), 1.48–1.40 (1H, m); LCMS calculated for C H +26 26F3N2O5S [M + H] 535.1509, found 535.1636.
Synthesis of N-benzyl-N-((1R,2R,3S)-2-hydroxy-3-(10H-phenoxazin-10-yl)cyclohexyl)-4-(trifluoromethoxy)benzenesulfonamide (NZ-043).
To a solution of N-((1R,2R,3S)-2-hydroxy-3-(10H-phenoxazin-10-yl)cyclohexyl)-4-(trifluoromethoxy)benzenesulfonamide DT-061 (0.100 g, 0.192 mmol) in DMF (0.32 mL) was added benzyl bromide (0.035 g, 0.202 mmol) and cesium carbonate (0.125 g, 0.384 mmol). The reaction mixture was stirred for 20 h at RT. The mixture was partitioned between water and ethylacetate. The organic layer was washed with saturated aqueous sodium chloride solution, and concentrated in vacuo. The residue was dissolved in a minimal amount of dichloromethane and purified by flash chromatography (SiO2, 17%−20% ethylacetate-hexanes) to afford N-benzyl-N-((1R,2R,3S)-2-hydroxy-3-(10H-phenoxazin-10-yl)cyclohexyl)-4-(trifluoromethoxy)benzenesulfonamide NZ-043 (0.058 g, 50%) as a white solid. 1H NMR (600 MHz, MeOD) δ 8.01 (2H, d, J = 10.8 Hz), 7.46–7.43 (4H, m), 7.41–7.30 (3H, m), 6.91–6.88 (2H, m), 6.85–6.81 (4H, m), 6.74 (2H, dd, J = 9.6, 1.8 Hz), 4.61–4.41 (2H, m), 4.04 (1H, t, J = 11.4 Hz), 3.79 (1H, br s), 3.44–3.39 (1H, m), 1.84 (1H, d, J = 15.6 Hz), 1.68–1.49 (4H, m), 1.36–1.27 (2H, m); LCMS calcd for C H +32 30F3N2O5S [M + H] 611.1822, found611.1860.
Synthesis of N-((1R,2R,3S)-2-methoxy-3-(10H-phenoxazin-10-yl)cyclohexyl)-N-methyl-4-(trifluoromethoxy)benzenesulfonamide (NZ-044).
A stirred suspension of sodium hydride (60% dispersion in mineral oil, 0.235 g, 0.998 mmol) in THF (0.73 mL) was cooled to 0 °C, and to this was added slowly N-((1R,2R,3S)-2-hydroxy-3-(10H-phenoxazin-10-yl)cyclohexyl)-4-(trifluoromethoxy)benzenesulfonamide DT-061 (0.100 g, 0.192 mmol) in THF (0.36 mL). After completion of addition, the reaction mixture was brought to room temperature and stirred for 20 min. Methyl iodide (0.050 mL) was added to this, and the reaction mixture was stirred for 48 h at RT. After being cooled to 0 °C, the reaction mixture was quenched by addition of water and extracted with ethylacetate. The organic extracts were concentrated, the residue was redissolved in DCM, converted to a silica gel plug and purified by flash chromatography (SiO2, 50 g, 17% (3CV), 20% (10CV) ethylacetate-hexanes) to afford N-((1R,2R,3S)-2-methoxy-3-(10H-phenoxazin-10-yl)cyclohexyl)-N-methyl-4-(trifluoromethoxy)benzenesulfonamide, NZ-044 (0.090 g, 86%), as a white solid. 1H NMR (600 MHz, MeOD) δ 8.00 (2H, J = 10.8 Hz), 7.49 (2H, J = 10.2 Hz), 6.99 (2H, d, J = 9.0 Hz), 6.92–6.89 (2H, m), 6.79 (2H, t, J = 9.0 Hz), 6.71 (2H, dd, J = 9.6, 1.2 Hz), 3.90–3.84 (1H, m), 3.73 (1H, t, J = 12.0 Hz), 3.64–3.58 (1H, m), 3H [2.99 (s), 2.89 (s)], 2.12–2.03 (1H, m), 1.89–1.86 (1H, m), 1.82–1.78 (1H, m), 1.74–1.66 (2H, m), 1.53–1.45 (1H, m); ESI-LCMS calcd for C H +27 28F3N2O5S [M + H] 549.1666, found 549.1342.
Quantification and Statistical Analysis
AP-MS Interaction Scoring and Data Visualization.
SAINTexpress AP-MS software was used to filter and score AP-MS data from the tumor co-immunoprecipitants. Analysis of three biologic replicates, in this case 3 tumors from either DMA treated, 2-hour DT-061 treated, or the EGFP-V5 expressing negative control group were used for interactome analysis. Default SAINT express options were utilized. SAINTexpress files were uploaded to ProHits-viz for data visualization and dot plot generation (Chen et al., 2016). The color intensity of each dot represents the raw spectral count for each prey protein (protein bound to the tagged scaffold subunit), the size of the dot represents the normalized amount of that protein given the size of the protein and spectral counts observed, and finally, the intensity of the dot border represents the statistical confidence in each value obtained (darker border equates to more confidence, FDR cutoff of 5%) (Chen and Gingras, 2007; Liu et al., 2011). Each Prohitz dot blot is arranged so the bait protein (PP2A-A scaffold) is presented at the top followed by each prey protein (interacting proteins) listed subsequently. The default ProHits-viz options were primary filter = 0.01 and secondary filter = 0.05 (corresponding to FDR), with a minimum abundance value = 0 and a maximum abundance value = 50. No normalization or log transformation was utilized for data visualization.
Analysis of immunoblots, cellular response assays, and biochemical experiment curves
Statistical analyses were performed by GraphPad Prism 10 software. Data are presented as mean +/− standard error of the mean (S.E.M.) Number of technical replicates or independent biological repeats is indicates in the figure legends. Unpaired two tailed Student’s t-test and one or two-way ANOVA with post-hoc Holm-Sidak or Bonferroni correction were utilized as appropriate for multiple comparisons and indicated in the figure legends.
Data and Code Availability
The datasets generated during this study are available at RCSB (PDB:6NTS), EMBL-EPI (EMDB:0510) and Mendely Data (http://dx.doi.org/10.17632/5sdnbktpg6.1).
Supplementary Material
Figure S1. Schematics of NanoBit and NanoBret tagged PP2A systems. (Related to Fig 1). (A) Schematic of split bioluminescence assay (NanoBit) on PP2A-A terminal regions. Increased bioluminescence measures decreased distance between PP2A-A N-terminus and C-terminus consistent with increased B-subunit binding, not specific for a particular B subunit. Different B subunit classes exert different degrees of structural constraint on the PP2A-A scaffold subunit. (B) Split bioluminescence assay (NanoBRET) with tagged B56α and tagged PP2A-A measures direct binding of B56α specifically to the scaffold A subunit. Binding and proximity allow for exogenous substrate cleavage measured as luminescence. (C) Immunoblots for V5 expression, EGFP and WT-A from cell lysates treated with DMSO or 3 μM DT-061 for 24 hours. (D) Quantification of V5 immunoblots reveal no significant change in V5 expression with DT-061 treatment. Statistical analysis is standard Student’s T-test, ns = not significant.
Figure S2. Isolation and validation of recombinant PP2A complexes. (Related to Fig 2). (A) Analysis of the AB56αC holoenzyme complex and its components by SEC. Representative chromatograms of the AB56αC holoenzyme complex, AC dimer and B56α. Peak SEC fractions of the holoenzyme complex were stained with Cy-5 NHS (Lumiprobe) (total protein stain), separated by SDS-PAGE and visualized on a Typhoon FLA 9500 (GE healthcare) (inset). (B) Coomassie stained gel with 2 separately prepared batches of recombinant AB56αC trimer (lanes 1 and 3) and one batch of recombinant AC dimer (lane 2). (C) Recombinant purified complexes from SEC were used to validate the specificity of isoform antibody. B56α antibody specifically recognizes B56α isoform but not B56γ isoform. (D) Chemical structure of DT-061.
Figure S3. Representative results from cryo-EM image processing steps and model validation. (Related to Fig. 3). (A) Motion-corrected micrograph of the PP2A AB56αC holoenzyme complex with DT-061. Particles used for the final 3D reconstruction are shown in blue circles. (B) Fourier transform of micrograph presented in panel (A). (C) Gallery of reference-free two-dimensional class averages within a 192 Å box size. (D) 3D classification of particles after 2D clean-up using the ab initio reference generated by cryoSPARC. The class with most of the helices resolved and clear density for all three subunits (highlighted in red box) was chosen for further refinement. (E) FSC curve for the 3D reconstruction of the cryo-EM map. The average resolution is estimated to be 3.6 Å on the basis of the FSC value of 0.143. (F) FSC curves of the refined model versus the overall 3.6 Å map that it was refined against (black); the model refined in the first of the two independent maps used for the FSC calculation versus the same map (red); and the model refined in the first of the two independent maps versus the second independent map (blue). (G) Color-coded local resolution distribution in Å of the final reconstruction as estimated by Relion-2.1. (H) Local cryo-EM density maps for representative regions of the PP2A holoenzyme complex. (I) Confirmation of the methylation at the C-tail of the C subunit expressed in insect cell using mC antibody. (J) Comparison of C-tail residues with models from two crystal structures of AB56αC trimer (PDB entry: 2IAE (cyan) and 2NPP (pink)). The structures were aligned to the A subunit.
Figure S4. DT061 chemical derivatives have abrogated effects in cell culture and positioning of DT-061 in different B classes and B56 isoforms demonstrates pocket specificity. (Related to Fig. 4 and 5). (A) H358 cells treated with DT-061, NZ-035, NZ-043, NZ-044 dose curves in low serum cell culture conditions for 25 hours. GI50 calculations reveal a significant decrease in apoptosis induced by chemical derivatives as compared to DT-061. (B) All-atom molecular modeling simulation (MDFF) using the available crystal structures of different PP2A complexes with DT-061 docked into the homologous drug-binding pocket that was identified for the B56α-PP2A complex. Ball models display respective residues of DT-061 binding observed in the B56α structure. There is no available pocket able to accommodate the DT-061 density in the heterotrimers composed of either B55α, B56γ, or PR72 B subunits classes.
Figure S5. Comparison of B56 isoform sequences and interface conservation. (Relate to Fig. 5). (A) Sequence alignment of the central conserved core region of B56 isoforms. Each pseudo-heat repeat is labeled with two rectangles representing alpha helices, connected with a grey line that represents intra-repeat loops at the bottom of the alignment. Intra-repeat 2, which contacts the catalytic C subunit, was highlight in the yellow box. Residues involved in A/B, B/C and C-tail interface are highlighted in blue, orange and green respectively. The residue T281 in the B56α isoform is also highlighted. Residues contacting DT-061 are highlighted by red arrows. (B) The shorter intra-repeat loop in the B56α isoform, as compared to the other B56 isoforms, helps to facilitate the accommodation of the C-tail in the presence of DT-061.
Figure S6. DT-061 increases methylation of L309 on the PP2A-C subunit (Related to Fig. 6). (A) Complete western blots for PP2A-C L309 methylation, total-PP2A-C, and vinculin in control or DT treated groups. (B) High magnification image (40x) of mC, tC. IHC from representative tumors. (C) Quantification of methyl-C staining intensity from IHC performed on single dose time-course xenograft tumors (n for each time point = 4–6). (D) Correlation of serum DT-061 with mL309 staining over time reveals positive correlation. (E) DT-061 half-life obtained from serum determined to be 6.3 hours. (F) Correlative analysis between tPP2A-C densitometry and DT-061 serum concentrations, no correlation observed. (G) Quantitation of PME-1 expression by immunoblotting across DT-061 treatment time course in xenograft tumors reveals no significant change in expression at early time points. (H) Quantitation of LCMT-1 expression by immunoblotting across DT-061 treatment time course in xenograft tumors reveals no significant increase in expression. These data indicate that increases in L309 methylation observed after DT-061 treatment are not due to increased LCMT-1 expression.
Figure S7. Overexpression of WT-PP2A-A suppresses tumor growth in lung adenocarcinoma xenograft. (Related to Fig. 7). (A) Comparison of V5-EGFP versus V5-WT-A expressing H358 xenograft tumor growth reveals WT-A overexpression inhibits tumor growth by roughly 27%. (B) V5-WT-A expressing cells treated with DMSO versus DT-061 for 29 days reveals a tumor suppressive effect of DT-061 of about 24%. (C) Quantitation of separate tumor suppressive components in V5-WT-A overexpressing system compared to effect of DT-061 in V5-EGFP cells reveals a similar overall tumor inhibition. (D) Sanger sequencing of V5-WT-A and V5-R183W-A expressing H358 cells. Highlighted region overlies mutated nucleotide (C>T) resulting amino acid mutation.
Table S1. Cryo-EM data collection, refinement and validation statistics (Related to Fig. 3).
Acknowledgments:
The authors would like to thank all members of the Taylor and Narla labs for comments and suggestions related to the study. Additionally, we would like to thank Lifu Wang, from Dr. Brautigan’s Lab, for contributions in construct design and tool generation. We thank Dr. Eckhard Jankowsky for his suggestions and comments in organizing the manuscript. Computational support was provided by the Case Western Reserve University High Performance Computing Cluster. This research was supported by a grant from the National Institutes of Health (R01 CA240993). Cryo-EM data were collected at, and sponsored by, the National Cancer Institute’s National Cryo-EM Facility at the Frederick National Laboratory for Cancer Research under contract HSSN261200800001E, the Midwest Consortium for High-Resolution Cryo-Electron Microscopy (U24 GM116789) and the West/Midwest Consortium for High-Resolution Cryo-Electron Microscopy (U24 GM116792). This work was further supported by grants from the National Institutes of Health (R01 GM133841 to D.J.T, R01 CA181654 to G.N, F30 TRN216393 to D.L., T32 GM007250 to CWRU MSTP), an American Heart Association Postdoctoral Fellowship to W.H. (17POST33650070) and the NIH Loan Repayment Program (National Center for Advancing Translational Sciences/National Institutes of Health) to S.I.
Footnotes
Publisher's Disclaimer: This is a PDF file of an unedited manuscript that has been accepted for publication. As a service to our customers we are providing this early version of the manuscript. The manuscript will undergo copyediting, typesetting, and review of the resulting proof before it is published in its final form. Please note that during the production process errors may be discovered which could affect the content, and all legal disclaimers that apply to the journal pertain.
Declaration of Interests:
The Icahn School of Medicine at Mount Sinai has filed patents covering composition of matter on the small molecules disclosed herein for the treatment of human cancer and other diseases (International Application Numbers: PCT/US15/19770, PCT/US15/19764; and US Patent: US 9,540,358 B2). Mount Sinai is actively seeking commercial partners for the further development of the technology. G.N. has a financial interest in the commercialization of the technology. RAPPTA Therapeutics LLC has licensed the cryo-EM coordinates for the clinical and commercial development of novel series of small molecule PP2A activators from the University of Michigan (GN) and Case Western Reserve University (DT). The authors GN and DT have an ownership interest in RAPPTA Therapeutics LLC. The author DLB functions as a SAB member for RAPPTA. The Medical University of Vienna on behalf of the author EO is filing a patent on the PP2A methyl-C subunit specific monoclonal antibody 7C10 disclosed herein for the diagnostic use of 7C10.
References and Notes:
- Adams PD, Afonine PV, Bunkóczi G, Chen VB, Davis IW, Echols N, Headd JJ, Hung LW, Kapral GJ, Grosse-Kunstleve RW, McCoy AJ, Moriarty NW, Oeffner R, Read RJ, Richardson DC, Richardson JS, Terwilliger TC, Zwart PH, 2010. PHENIX: A comprehensive Python-based system for macromolecular structure solution. Acta Crystallogr. Sect. D Biol. Crystallogr 10.1107/S0907444909052925 [DOI] [PMC free article] [PubMed] [Google Scholar]
- Allen-Petersen BL, Risom T, Feng Z, Wang Z, Jenny ZP, Thoma MC, Pelz KR, Morton JP, Sansom OJ, Lopez CD, Sheppard B, Christensen DJ, Ohlmeyer M, Narla G, Sears RC, 2018. Activation of PP2A and inhibition of mTOR synergistically reduce MYC signaling and decrease tumor growth in pancreatic ductal adenocarcinoma. Cancer Res 10.1158/0008-5472.CAN-18-0717 [DOI] [PMC free article] [PubMed] [Google Scholar]
- Arnold HK, Sears RC, 2008. A tumor suppressor role for PP2A-B56?? through negative regulation of c-Myc and other key oncoproteins. Cancer Metastasis Rev 27, 147–158. 10.1007/s10555-008-9128-9 [DOI] [PMC free article] [PubMed] [Google Scholar]
- Arnold HK, Sears RC, 2006. Protein phosphatase 2A regulatory subunit B56α associates with c-Myc and negatively regulates c-Myc accumulation. Mol. Cell. Biol 26, 2832–2844. 10.1128/MCB.26.7.2832 [DOI] [PMC free article] [PubMed] [Google Scholar]
- Bhasin N, Cunha SR, Mudannayake M, Gigena MS, Rogers TB, Mohler PJ, 2007. Molecular basis for PP2A regulatory subunit B56alpha targeting in cardiomyocytes. Am. J. Physiol. Heart Circ. Physiol 293, H109–19. 10.1152/ajpheart.00059.2007. [DOI] [PubMed] [Google Scholar]
- Bokori-Brown M, Martin TG, Naylor CE, Basak AK, Titball RW, Savva CG, 2016. Cryo-EM structure of lysenin pore elucidates membrane insertion by an aerolysin family protein. Nat. Commun 7, 11293 10.1038/ncomms11293 [DOI] [PMC free article] [PubMed] [Google Scholar]
- Brautigan DL, Shenolikar S, 2018. Protein Serine/Threonine Phosphatases: Keys to Unlocking Regulators and Substrates. Annu. Rev. Biochem 87, 921–964. 10.1146/annurev-biochem-062917-012332 [DOI] [PubMed] [Google Scholar]
- Casado P, Rodriguez-Prados J-C, Cosulich SC, Guichard S, Vanhaesebroeck B, Joel S, Cutillas PR, 2013. Kinase-substrate enrichment analysis provides insights into the heterogeneity of signaling pathway activation in leukemia cells. Sci. Signal 6, rs6–rs6. 10.1126/scisignal.2003573 [DOI] [PubMed] [Google Scholar]
- Chen GI, Gingras AC, 2007. Affinity-purification mass spectrometry (AP-MS) of serine/threonine phosphatases. Methods 42, 298–305. 10.1016/j.ymeth.2007.02.018 [DOI] [PubMed] [Google Scholar]
- Chen S, McMullan G, Faruqi AR, Murshudov GN, Short JM, Scheres SHW, Henderson R, 2013. High-resolution noise substitution to measure overfitting and validate resolution in 3D structure determination by single particle electron cryomicroscopy. Ultramicroscopy 135, 24–35. 10.1016/j.ultramic.2013.06.004 [DOI] [PMC free article] [PubMed] [Google Scholar]
- Chen VB, Arendall WB, Headd JJ, Keedy DA, Immormino RM, Kapral GJ, Murray LW, Richardson JS, Richardson DC, 2010. MolProbity: All-atom structure validation for macromolecular crystallography. Acta Crystallogr. Sect. D Biol. Crystallogr 10.1107/S0907444909042073 [DOI] [PMC free article] [PubMed] [Google Scholar]
- Chen W, 2005. Cancer-Associated PP2A A Subunits Induce Functional Haploinsufficiency and Tumorigenicity. Cancer Res 65, 8183–8192. 10.1158/0008-5472.CAN-05-1103 [DOI] [PubMed] [Google Scholar]
- Chen W, Possemato R, Campbell KT, Plattner C. a, Pallas DC, Hahn WC, 2004. Identification of specific PP2A complexes involved in human cell transformation. Cancer Cell 5, 127–36. [DOI] [PubMed] [Google Scholar]
- Chen WCW, Baily JE, Corselli M, Diaz M, Sun B, Xiang G, Gray GA, Huard J, Péault B, 2016. ProHits-viz: a suite of web-tools for visualizing interaction proteomics data. Nat. Methods 33, 557–573. 10.1002/stem.1868.Human [DOI] [Google Scholar]
- Cho US, Xu W, 2007. Crystal structure of a protein phosphatase 2A heterotrimeric holoenzyme. Nature 445, 53–57. 10.1038/nature05351 [DOI] [PubMed] [Google Scholar]
- Cristobal I, Rincon R, Manso R, Carames C, Zazo S, Madoz-Gurpide J, Rojo F, Garcia-Foncillas J, 2015. Deregulation of the PP2A Inhibitor SET Shows Promising Therapeutic Implications and Determines Poor Clinical Outcome in Patients with Metastatic Colorectal Cancer. Clin. Cancer Res 21, 347–356. 10.1158/1078-0432.CCR-14-0724 [DOI] [PubMed] [Google Scholar]
- Emsley P, Lohkamp B, Scott WG, Cowtan K, 2010. Features and development of Coot. Acta Crystallogr. Sect. D Biol. Crystallogr 10.1107/S0907444910007493 [DOI] [PMC free article] [PubMed] [Google Scholar]
- Fan Y-L, Chen L, Wang J, Yao Q, Wan J-Q, 2013. Over expression of PPP2R2C inhibits human glioma cells growth through the suppression of mTOR pathway. FEBS Lett 587, 3892–7. 10.1016/j.febslet.2013.09.029 [DOI] [PubMed] [Google Scholar]
- Farrell AS, Sears RC, 2014. MYC degradation. Cold Spring Harb. Perspect. Med 4, a014365 10.1101/cshperspect.a014365 [DOI] [PMC free article] [PubMed] [Google Scholar]
- Fernandez-Leiro R, Scheres SHW, 2017. A pipeline approach to single-particle processing in RELION, in: Acta Crystallographica Section D: Structural Biology 10.1107/S2059798316019276 [DOI] [PMC free article] [PubMed] [Google Scholar]
- Gutierrez A, Pan L, Groen RWJ, Baleydier F, Kentsis A, Marineau J, Grebliunaite R, Kozakewich E, Reed C, Pflumio F, Poglio S, Uzan B, Clemons P, Verplank L, An F, Burbank J, Norton S, Tolliday N, Steen H, Weng AP, Yuan H, Bradner JE, Mitsiades C, Look AT, Aster JC, 2014. Phenothiazines induce PP2A-mediated apoptosis in T cell acute lymphoblastic leukemia. J. Clin. Investig 124 10.1172/JCI65093DS1 [DOI] [PMC free article] [PubMed] [Google Scholar]
- Haesen D, Asbagh LA, Derua R, Hubert A, Schrauwen S, Hoorne Y, Amant F, Waelkens E, Sablina A, Janssens V, 2016. Recurrent PPP2R1A mutations in uterine cancer act through a dominant-negative mechanism to promote malignant cell growth. Cancer Res 76, 5719–5731. 10.1158/0008-5472.CAN-15-3342 [DOI] [PubMed] [Google Scholar]
- Ho WS, Wang H, Maggio D, Kovach JS, Zhang Q, Song Q, Marincola FM, Heiss JD, Gilbert MR, Lu R, Zhuang Z, 2018. Pharmacologic inhibition of protein phosphatase-2A achieves durable immune-mediated antitumor activity when combined with PD-1 blockade. Nat. Commun 9, 1–15. 10.1038/s41467-018-04425-z [DOI] [PMC free article] [PubMed] [Google Scholar]
- Humphrey W, Dalke A, Schulten K, 1996. VMD: Visual molecular dynamics. J. Mol. Graph 14, 33–38. 10.1016/0263-7855(96)00018-5 [DOI] [PubMed] [Google Scholar]
- Ikehara T, Ikehara S, Imamura S, Shinjo F, Yasumoto T, 2007. Methylation of the C-terminal leucine residue of the PP2A catalytic subunit is unnecessary for the catalytic activity and the binding of regulatory subunit (PR55/B). Biochem. Biophys. Res. Commun 354, 1052–1057. 10.1016/j.bbrc.2007.01.085 [DOI] [PubMed] [Google Scholar]
- Jackson JB, Pallas DC, 2012. Circumventing Cellular Control of PP2A by Methylation Promotes Transformation in an Akt-Dependent Manner. Neoplasia 14, 585–599. 10.1593/neo.12768 [DOI] [PMC free article] [PubMed] [Google Scholar]
- Junttila MR, Puustinen P, Niemelä M, Ahola R, Arnold H, Böttzauw T, Ala-aho R, Nielsen C, Ivaska J, Taya Y, Lu S-L, Lin S, Chan EKL, Wang X-J, Grènman R, Kast J, Kallunki T, Sears R, Kähäri V-M, Westermarck J, 2007. CIP2A inhibits PP2A in human malignancies. Cell 130, 51–62. 10.1016/j.cell.2007.04.044 [DOI] [PubMed] [Google Scholar]
- Kauko O, Connor CMO, Kulesskiy E, Sangodkar J, Aakula A, Izadmehr S, Yetukuri L, Yadav B, Padzik A, Laajala TD, Haapaniemi P, Momeny M, Varila T, Ohlmeyer M, Aittokallio T, 2018. PP2A inhibition is a druggable MEK inhibitor resistance mechanism in KRAS-mutant lung cancer cells 1093 [DOI] [PMC free article] [PubMed]
- Kimanius D, Forsberg BO, Scheres SH, Lindahl E, 2016. Accelerated cryo-EM structure determination with parallelisation using GPUs in RELION-2. Elife 5, e18722 10.7554/eLife.18722 [DOI] [PMC free article] [PubMed] [Google Scholar]
- Kirchhefer U, Brekle C, Eskandar J, Isensee G, Kučerová D, Müller FU, Pinet F, Schulte JS, Seidl MD, Boknik P, 2014. Cardiac function is regulated by B56??-mediated targeting of protein phosphatase 2A (PP2A) to contractile relevant substrates. J. Biol. Chem 289, 33862–33873. 10.1074/jbc.M114.598938 [DOI] [PMC free article] [PubMed] [Google Scholar]
- Letourneux C, Raldine Rocher G, Oise Porteu F, 2006. B56-containing PP2A dephosphorylate ERK and their activity is controlled by the early gene IEX-1 and ERK. EMBO J 25, 727–738. 10.1038/sj.emboj.7600980 [DOI] [PMC free article] [PubMed] [Google Scholar]
- Liu G, Zhang J, Larsen B, Stark C, Breitkreutz A, Lin Y, Breitkreutz B, Ding Y, Colwill K, Pasculescu A, Pawson T, Wrana JL, Nesvizhskii AI, Raught B, Tyers M, Gingras A-C, 2011. ProHits: an integrated software platform for mass spectrometry- based interaction proteomics. Nat. Biotechnol 28, 1015–1017. 10.1038/nbt1010-1015.ProHits [DOI] [PMC free article] [PubMed] [Google Scholar]
- Longin S, Zwaenepoel K, Louis JV, Dilworth S, Goris J, Janssens V, 2007. Selection of protein phosphatase 2A regulatory subunits is mediated by the C terminus of the catalytic subunit. J. Biol. Chem 282, 26971–26980. 10.1074/jbc.M704059200 [DOI] [PubMed] [Google Scholar]
- Maier JA, Martinez C, Kasavajhala K, Wickstrom L, Hauser KE, Simmerling C, 2015. ff14SB: Improving the Accuracy of Protein Side Chain and Backbone Parameters from ff99SB. J. Chem. Theory Comput 11, 3696–3713. 10.1021/acs.jctc.5b00255 [DOI] [PMC free article] [PubMed] [Google Scholar]
- McClinch K, Avelar RA, Callejas D, Izadmehr S, Wiredja D, Perl A, Sangodkar J, Kastrinsky DB, Schlatzer D, Cooper M, Kiselar J, Stachnik A, Yao S, Hoon D, McQuaid D, Zaware N, Gong Y, Brautigan DL, Plymate SR, Sprenger CCT, Oh WK, Levine AC, Kirschenbaum A, Sfakianos JP, Sears R, DiFeo A, Ioannou Y, Ohlmeyer M, Narla G, Galsky MD, 2018. Small-molecule activators of protein phosphatas 2A for the treatment of castration-resistant prostate cancer. Cancer Res 78, 2065–2080. 10.1158/0008-5472.CAN-17-0123 [DOI] [PMC free article] [PubMed] [Google Scholar]
- Moriarty NW, Grosse-Kunstleve RW, Adams PD, IUCr, 2009. electronic Ligand Builder and Optimization Workbench (eLBOW): a tool for ligand coordinate and restraint generation. Acta Crystallogr. Sect. D Biol. Crystallogr 65, 1074–1080. 10.1107/S0907444909029436 [DOI] [PMC free article] [PubMed] [Google Scholar]
- Neviani P, Santhanam R, Oaks JJ, Eiring AM, Notari M, Blaser BW, Liu S, Trotta R, Muthusamy N, Gambacorti-Passerini C, Druker BJ, Cortes J, Marcucci G, Chen C-S, Verrills NM, Roy DC, Caligiuri MA, Bloomfield CD, Byrd JC, Perrotti D, 2007. FTY720, a new alternative for treating blast crisis chronic myelogenous leukemia and Philadelphia chromosome-positive acute lymphocytic leukemia. J. Clin. Invest 117, 2408–21. 10.1172/JCI31095 [DOI] [PMC free article] [PubMed] [Google Scholar]
- Nunbhakdi-Craig V, Schuechner S, Sontag JM, Montgomery L, Pallas DC, Juno C, Mudrak I, Ogris E, Sontag E, 2007. Expression of protein phosphatase 2A mutants and silencing of the regulatory Bα subunit induce a selective loss of acetylated and detyrosinated microtubules. J. Neurochem 101, 959–971. 10.1111/j.1471-4159.2007.04503.x [DOI] [PubMed] [Google Scholar]
- O’Connor CM, Leonard D, Wiredja D, Avelar RA, Wang Z, Schlatzer D, Bryson B, Tokala E, Taylor SE, Upadhyay A, Sangodkar J, Gingras A-C, Westermarck J, Xu W, DiFeo A, Brautigan DL, Haider S, Jackson M, Narla G, 2019. Inactivation of PP2A by a recurrent mutation drives resistance to MEK inhibitors. Oncogene 10.1038/s41388-019-1012-2 [DOI] [PMC free article] [PubMed] [Google Scholar]
- Ogris E, Du X, Nelson KC, Mak EK, Yu XX, Lane WS, Pallas DC, 1999. A protein phosphatase methylaesterase (PME-1) is one of several novel proteins stably associateing with two inactive mutants of protein phosphatase 2A. J. Biol. Chem 274, 14382–14391. [DOI] [PMC free article] [PubMed] [Google Scholar]
- Phillips JC, Braun R, Wang W, Gumbart J, Tajkhorshid E, Villa E, Chipot C, Skeel RD, Kalé L, Schulten K, 2005. Scalable molecular dynamics with NAMD. J. Comput. Chem 26, 1781–802. 10.1002/jcc.20289 [DOI] [PMC free article] [PubMed] [Google Scholar]
- Punjani A, Rubinstein JL, Fleet DJ, Brubaker MA, 2017. cryoSPARC: algorithms for rapid unsupervised cryo-EM structure determination. Nat. Methods 14, 290–296. 10.1038/nmeth.4169 [DOI] [PubMed] [Google Scholar]
- Rincón R, Cristóbal I, Zazo S, Arpí O, Menéndez S, Manso R, Lluch A, Eroles P, Rovira A, Albanell J, García-Foncillas J, Madoz-Gúrpide J, Rojo F, 2015. PP2A inhibition determines poor outcome and doxorubicin resistance in early breast cancer and its activation shows promising therapeutic effects. Oncotarget 6, 4299–314. 10.18632/oncotarget.3012 [DOI] [PMC free article] [PubMed] [Google Scholar]
- Rosenthal PB, Henderson R, 2003. Optimal determination of particle orientation, absolute hand, and contrast loss in single-particle electron cryomicroscopy. J. Mol. Biol 333, 721–45. [DOI] [PubMed] [Google Scholar]
- Ruediger R, Ruiz J, Walter G, 2011. Human Cancer-Associated Mutations in the A{alpha} Subunit of Protein Phosphatase 2A Increase Lung Cancer Incidence in A{alpha} Knock-In and Knockout Mice. Mol. Cell. Biol 31, 3832–3844. 10.1128/MCB.05744-11 [DOI] [PMC free article] [PubMed] [Google Scholar]
- Sablina A. a, Hector M, Colpaert N, Hahn WC, 2010. Identification of PP2A complexes and pathways involved in cell transformation. Cancer Res 70, 10474–84. 10.1158/0008-5472.CAN-10-2855 [DOI] [PMC free article] [PubMed] [Google Scholar]
- Salomon-Ferrer R, Case DA, Walker RC, 2013. An overview of the Amber biomolecular simulation package. Wiley Interdiscip. Rev. Comput. Mol. Sci 3, 198–210. 10.1002/wcms.1121 [DOI] [Google Scholar]
- Sangodkar J, Perl A, Tohme R, Kiselar J, Kastrinsky DB, Zaware N, Izadmehr S, Mazhar S, Wiredja DD, O’Connor CM, Hoon D, Dhawan NS, Schlatzer D, Yao S, Leonard D, Borczuk AC, Gokulrangan G, Wang L, Svenson E, Farrington CC, Yuan E, Avelar RA, Stachnik A, Smith B, Gidwani V, Giannini HM, McQuaid D, McClinch K, Wang Z, Levine AC, Sears RC, Chen EY, Duan Q, Datt M, Haider S, Ma’ayan A, DiFeo A, Sharma N, Galsky MD, Brautigan DL, Ioannou YA, Xu W, Chance MR, Ohlmeyer M, Narla G, 2017a. Activation of tumor suppressor protein PP2A inhibits KRAS-driven tumor growth. J. Clin. Invest 78, 101–114. 10.1172/JCI89548 [DOI] [PMC free article] [PubMed] [Google Scholar]
- Sangodkar J, Perl A, Tohme R, Kiselar J, Kastrinsky DB, Zaware N, Izadmehr S, Mazhar S, Wiredja DD, O’Connor CM, Hoon D, Dhawan NS, Schlatzer D, Yao S, Leonard D, Borczuk AC, Gokulrangan G, Wang L, Svenson E, Farrington CC, Yuan E, Avelar RA, Stachnik A, Smith B, Gidwani V, Giannini HM, McQuaid D, McClinch K, Wang Z, Levine AC, Sears RC, Chen EY, Duan Q, Datt M, Haider S, Ma’Ayan A, DiFeo A, Sharma N, Galsky MD, Brautigan DL, Ioannou YA, Xu W, Chance MR, Ohlmeyer M, Narla G, 2017b. Activation of tumor suppressor protein PP2A inhibits KRAS-driven tumor growth. J. Clin. Invest 127, 2081–2090. 10.1172/JCI89548 [DOI] [PMC free article] [PubMed] [Google Scholar]
- Scheres SHW, 2012. RELION: Implementation of a Bayesian approach to cryo-EM structure determination. J. Struct. Biol 180, 519–530. 10.1016/j.jsb.2012.09.006 [DOI] [PMC free article] [PubMed] [Google Scholar]
- Sents W, Ivanova E, Lambrecht C, Haesen D, Janssens V, 2013. The biogenesis of active protein phosphatase 2A holoenzymes: a tightly regulated process creating phosphatase specificity. FEBS J 280, 644–661. 10.1111/j.1742-4658.2012.08579.x [DOI] [PubMed] [Google Scholar]
- Sheppard B, Allen-Petersen BL, Pelz KR, Narla G, Jenny ZP, Sansom OJ, Sears RC, Lopez CD, Morton JP, Thoma MC, Feng Z, Ohlmeyer M, Risom T, Christensen DJ, Wang Z, 2018. Activation of PP2A and Inhibition of mTOR Synergistically Reduce MYC Signaling and Decrease Tumor Growth in Pancreatic Ductal Adenocarcinoma. Cancer Res 79, 209–219. 10.1158/0008-5472.can-18-0717 [DOI] [PMC free article] [PubMed] [Google Scholar]
- Shi Y, 2009. Serine/Threonine Phosphatases: Mechanism through Structure. Cell 139, 468–484. 10.1016/j.cell.2009.10.006 [DOI] [PubMed] [Google Scholar]
- Singharoy A, Teo I, McGreevy R, Stone JE, Zhao J, Schulten K, 2016. Molecular dynamics-based refinement and validation for sub-5 Å cryo-electron microscopy maps. Elife 5 10.7554/eLife.16105 [DOI] [PMC free article] [PubMed] [Google Scholar]
- Sontag J-M, Sontag E, 2014. Protein phosphatase 2A dysfunction in Alzheimer’s disease. Front. Mol. Neurosci 7, 16 10.3389/fnmol.2014.00016 [DOI] [PMC free article] [PubMed] [Google Scholar]
- Switzer CH, Cheng RYS, Vitek TM, Christensen DJ, Wink DA, Vitek MP, 2011. Targeting SET/I2PP2A oncoprotein functions as a multi-pathway strategy for cancer therapy. Oncogene 30, 2504–2513. 10.1038/onc.2010.622 [DOI] [PMC free article] [PubMed] [Google Scholar]
- Taylor SE, O’Connor CM, Wang Z, Shen G, Song H, Leonard D, Sangodkar J, LaVasseur C, Avril S, Waggoner S, Zanotti K, Armstrong AJ, Nagel C, Resnick K, Singh S, Jackson MW, Xu W, Haider S, DiFeo A, Narla G, 2019. The highly recurrent PP2A Aα-subunit mutation P179R alters protein structure and impairs PP2A enzyme function to promote endometrial tumorigenesis. Cancer Res. canres.0218.2019 10.1158/0008-5472.CAN-19-0218 [DOI] [PMC free article] [PubMed] [Google Scholar]
- Tohmé R, Izadmehr S, Gandhe S, Tabaro G, Vallabhaneni S, Thomas A, Vasireddi N, Dhawan NS, Ma’ayan A, Sharma N, Galsky MD, Ohlmeyer M, Sangodkar J, Narla G, 2019. Direct activation of PP2A for the treatment of tyrosine kinase inhibitor–resistant lung adenocarcinoma. JCI Insight 4 10.1172/jci.insight.125693 [DOI] [PMC free article] [PubMed] [Google Scholar]
- Tsujio I, Zaidi T, Xu J, Kotula L, Grundke-Iqbal I, Iqbal K, 2005. Inhibitors of protein phosphatase-2A from human brain structures, immunocytological localization and activities towards dephosphorylation of the Alzheimer type hyperphosphorylated tau. FEBS Lett 579, 363–372. 10.1016/j.febslet.2004.11.097 [DOI] [PubMed] [Google Scholar]
- Tsytlonok M, Craig PO, Sivertsson E, Serquera D, Perrett S, Best RB, Wolynes PG, Itzhaki LS, 2013. Complex energy landscape of a giant repeat protein. Structure 21, 1954–65. 10.1016/j.str.2013.08.028 [DOI] [PMC free article] [PubMed] [Google Scholar]
- Wang J, Okkeri J, Pavic K, Wang Z, Kauko O, Halonen T, Sarek G, Ojala PM, Rao Z, Xu W, Westermarck J, 2017. Oncoprotein CIP2A is stabilized via interaction with tumor suppressor PP2A/B56 18, 437–450. 10.15252/embr.201642788 [DOI] [PMC free article] [PubMed] [Google Scholar]
- Wang J, Wang W, Kollman PA, Case DA, 2006. Automatic atom type and bond type perception in molecular mechanical calculations 10.1016/j.jmgm.2005.12.005 [DOI] [PubMed] [Google Scholar]
- Wang J, Wolf RM, Caldwell JW, Kollman PA, Case DA, 2004. Development and testing of a general amber force field. J. Comput. Chem 25, 1157–1174. 10.1002/jcc.20035 [DOI] [PubMed] [Google Scholar]
- Wang JZ, Gong CX, Zaidi T, Grundke-Iqbal I, Iqbal K, 1995. Dephosphorylation of Alzheimer paired helical filaments by protein phosphatase-2A and −2B. J. Biol. Chem 10.1074/jbc.270.9.4854 [DOI] [PubMed] [Google Scholar]
- Wlodarchak N, Guo F, Satyshur KA, Jiang L, Jeffrey PD, Sun T, Stanevich V, Mumby MC, Xing Y, 2013a. Structure of the Ca2+-dependent PP2A heterotrimer and insights into Cdc6 dephosphorylation. Cell Res 23, 931–946. 10.1038/cr.2013.77 [DOI] [PMC free article] [PubMed] [Google Scholar]
- Wlodarchak N, Guo F, Satyshur KA, Jiang L, Jeffrey PD, Sun T, Stanevich V, Mumby MC, Xing Y, 2013b. Structure of the Ca2+-dependent PP2A heterotrimer and insights into Cdc6 dephosphorylation. Cell Res 23, 931–46. 10.1038/cr.2013.77 [DOI] [PMC free article] [PubMed] [Google Scholar]
- Xu Y, Chen Y, Zhang P, Jeffrey PD, Shi Y, 2008. Structure of a Protein Phosphatase 2A Holoenzyme: Insights into B55-Mediated Tau Dephosphorylation. Mol. Cell 31, 873–885. 10.1016/j.molcel.2008.08.006 [DOI] [PMC free article] [PubMed] [Google Scholar]
- Xu Y, Xing Y, Chen Y, Chao Y, Lin Z, Fan E, Yu JW, Strack S, Jeffrey PD, Shi Y, 2006. Structure of the Protein Phosphatase 2A Holoenzyme. Cell 127, 1239–1251. 10.1016/j.cell.2006.11.033 [DOI] [PubMed] [Google Scholar]
- Yang Xiaoping, Boehm JS, Yang Xinping, Salehi-Ashtiani K, Hao T, Shen Y, Lubonja R, Thomas SR, Alkan O, Bhimdi T, Green TM, Johannessen CM, Silver SJ, Nguyen C, Murray RR, Hieronymus H, Balcha D, Fan C, Lin C, Ghamsari L, Vidal M, Hahn WC, Hill DE, Root DE, 2011. A public genome-scale lentiviral expression library of human ORFs. Nat. Methods 8 10.1038/nmeth.1638 [DOI] [PMC free article] [PubMed] [Google Scholar]
- Yonekura K, Kato K, Ogasawara M, Tomita M, Toyoshima C, 2015. Electron crystallography of ultrathin 3D protein crystals: Atomic model with charges. Proc. Natl. Acad. Sci. U. S. A 112, 3368–3373. 10.1073/pnas.1500724112 [DOI] [PMC free article] [PubMed] [Google Scholar]
- Zhang K, 2016. Gctf: Real-time CTF determination and correction. J. Struct. Biol 193, 1–12. 10.1016/j.jsb.2015.11.003 [DOI] [PMC free article] [PubMed] [Google Scholar]
- Zheng SQ, Palovcak E, Armache J-P, Verba KA, Cheng Y, Agard DA, 2017. MotionCor2: anisotropic correction of beam-induced motion for improved cryo-electron microscopy. Nat. Methods 14, 331–332. 10.1038/nmeth.4193 [DOI] [PMC free article] [PubMed] [Google Scholar]
Associated Data
This section collects any data citations, data availability statements, or supplementary materials included in this article.
Supplementary Materials
Figure S1. Schematics of NanoBit and NanoBret tagged PP2A systems. (Related to Fig 1). (A) Schematic of split bioluminescence assay (NanoBit) on PP2A-A terminal regions. Increased bioluminescence measures decreased distance between PP2A-A N-terminus and C-terminus consistent with increased B-subunit binding, not specific for a particular B subunit. Different B subunit classes exert different degrees of structural constraint on the PP2A-A scaffold subunit. (B) Split bioluminescence assay (NanoBRET) with tagged B56α and tagged PP2A-A measures direct binding of B56α specifically to the scaffold A subunit. Binding and proximity allow for exogenous substrate cleavage measured as luminescence. (C) Immunoblots for V5 expression, EGFP and WT-A from cell lysates treated with DMSO or 3 μM DT-061 for 24 hours. (D) Quantification of V5 immunoblots reveal no significant change in V5 expression with DT-061 treatment. Statistical analysis is standard Student’s T-test, ns = not significant.
Figure S2. Isolation and validation of recombinant PP2A complexes. (Related to Fig 2). (A) Analysis of the AB56αC holoenzyme complex and its components by SEC. Representative chromatograms of the AB56αC holoenzyme complex, AC dimer and B56α. Peak SEC fractions of the holoenzyme complex were stained with Cy-5 NHS (Lumiprobe) (total protein stain), separated by SDS-PAGE and visualized on a Typhoon FLA 9500 (GE healthcare) (inset). (B) Coomassie stained gel with 2 separately prepared batches of recombinant AB56αC trimer (lanes 1 and 3) and one batch of recombinant AC dimer (lane 2). (C) Recombinant purified complexes from SEC were used to validate the specificity of isoform antibody. B56α antibody specifically recognizes B56α isoform but not B56γ isoform. (D) Chemical structure of DT-061.
Figure S3. Representative results from cryo-EM image processing steps and model validation. (Related to Fig. 3). (A) Motion-corrected micrograph of the PP2A AB56αC holoenzyme complex with DT-061. Particles used for the final 3D reconstruction are shown in blue circles. (B) Fourier transform of micrograph presented in panel (A). (C) Gallery of reference-free two-dimensional class averages within a 192 Å box size. (D) 3D classification of particles after 2D clean-up using the ab initio reference generated by cryoSPARC. The class with most of the helices resolved and clear density for all three subunits (highlighted in red box) was chosen for further refinement. (E) FSC curve for the 3D reconstruction of the cryo-EM map. The average resolution is estimated to be 3.6 Å on the basis of the FSC value of 0.143. (F) FSC curves of the refined model versus the overall 3.6 Å map that it was refined against (black); the model refined in the first of the two independent maps used for the FSC calculation versus the same map (red); and the model refined in the first of the two independent maps versus the second independent map (blue). (G) Color-coded local resolution distribution in Å of the final reconstruction as estimated by Relion-2.1. (H) Local cryo-EM density maps for representative regions of the PP2A holoenzyme complex. (I) Confirmation of the methylation at the C-tail of the C subunit expressed in insect cell using mC antibody. (J) Comparison of C-tail residues with models from two crystal structures of AB56αC trimer (PDB entry: 2IAE (cyan) and 2NPP (pink)). The structures were aligned to the A subunit.
Figure S4. DT061 chemical derivatives have abrogated effects in cell culture and positioning of DT-061 in different B classes and B56 isoforms demonstrates pocket specificity. (Related to Fig. 4 and 5). (A) H358 cells treated with DT-061, NZ-035, NZ-043, NZ-044 dose curves in low serum cell culture conditions for 25 hours. GI50 calculations reveal a significant decrease in apoptosis induced by chemical derivatives as compared to DT-061. (B) All-atom molecular modeling simulation (MDFF) using the available crystal structures of different PP2A complexes with DT-061 docked into the homologous drug-binding pocket that was identified for the B56α-PP2A complex. Ball models display respective residues of DT-061 binding observed in the B56α structure. There is no available pocket able to accommodate the DT-061 density in the heterotrimers composed of either B55α, B56γ, or PR72 B subunits classes.
Figure S5. Comparison of B56 isoform sequences and interface conservation. (Relate to Fig. 5). (A) Sequence alignment of the central conserved core region of B56 isoforms. Each pseudo-heat repeat is labeled with two rectangles representing alpha helices, connected with a grey line that represents intra-repeat loops at the bottom of the alignment. Intra-repeat 2, which contacts the catalytic C subunit, was highlight in the yellow box. Residues involved in A/B, B/C and C-tail interface are highlighted in blue, orange and green respectively. The residue T281 in the B56α isoform is also highlighted. Residues contacting DT-061 are highlighted by red arrows. (B) The shorter intra-repeat loop in the B56α isoform, as compared to the other B56 isoforms, helps to facilitate the accommodation of the C-tail in the presence of DT-061.
Figure S6. DT-061 increases methylation of L309 on the PP2A-C subunit (Related to Fig. 6). (A) Complete western blots for PP2A-C L309 methylation, total-PP2A-C, and vinculin in control or DT treated groups. (B) High magnification image (40x) of mC, tC. IHC from representative tumors. (C) Quantification of methyl-C staining intensity from IHC performed on single dose time-course xenograft tumors (n for each time point = 4–6). (D) Correlation of serum DT-061 with mL309 staining over time reveals positive correlation. (E) DT-061 half-life obtained from serum determined to be 6.3 hours. (F) Correlative analysis between tPP2A-C densitometry and DT-061 serum concentrations, no correlation observed. (G) Quantitation of PME-1 expression by immunoblotting across DT-061 treatment time course in xenograft tumors reveals no significant change in expression at early time points. (H) Quantitation of LCMT-1 expression by immunoblotting across DT-061 treatment time course in xenograft tumors reveals no significant increase in expression. These data indicate that increases in L309 methylation observed after DT-061 treatment are not due to increased LCMT-1 expression.
Figure S7. Overexpression of WT-PP2A-A suppresses tumor growth in lung adenocarcinoma xenograft. (Related to Fig. 7). (A) Comparison of V5-EGFP versus V5-WT-A expressing H358 xenograft tumor growth reveals WT-A overexpression inhibits tumor growth by roughly 27%. (B) V5-WT-A expressing cells treated with DMSO versus DT-061 for 29 days reveals a tumor suppressive effect of DT-061 of about 24%. (C) Quantitation of separate tumor suppressive components in V5-WT-A overexpressing system compared to effect of DT-061 in V5-EGFP cells reveals a similar overall tumor inhibition. (D) Sanger sequencing of V5-WT-A and V5-R183W-A expressing H358 cells. Highlighted region overlies mutated nucleotide (C>T) resulting amino acid mutation.
Table S1. Cryo-EM data collection, refinement and validation statistics (Related to Fig. 3).
Data Availability Statement
The datasets generated during this study are available at RCSB (PDB:6NTS), EMBL-EPI (EMDB:0510) and Mendely Data (http://dx.doi.org/10.17632/5sdnbktpg6.1).