

Abstract
Lightcurves for 45 Near-Earth asteroids (NEAs) obtained at the Center for Solar System Studies (CS3) from 2018 July-September were analyzed for rotation period and signs of satellites or tumbling. NEA 13553 Massakikoyama appears to be in non-principal axis rotation, i.e., tumbling. 2011 UA (D = 0.6 km) is a super-fast rotator with a period of 0.316391 ± 0.000007 h. The period and size place it well above the spin barrier. The period for 2018 RQ2 is multiply ambiguous, with possible solutions of 4.28 h or 5.17 h (monomdal lightcurve) and 8.58 h or 10.60 h (bimodal lightcurve). 2018 KE3 may be a binary asteroid.
CCD photometric observations of 45 near-Earth asteroids (NEAs) were made at the Center for Solar System Studies (CS3) from 2018 July-September.
Table I lists the telescopes and CCD cameras that are combined to make observations. Up to nine telescopes can be used for the campaign, although seven is more common. All the cameras use CCD chips from the KAF blue-enhanced family and so have essentially the same response. The pixel scales ranged from 1.24-1.60 arcsec/pixel.
Table I.
List of available telescopes and CCD cameras at CS3. The exact combination for each telescope/camera pair can vary due to maintenance or specific needs.
| Telescopes | Cameras |
|---|---|
| 0.30-m f/6.3 Schmidt-Cass | FLI Microline 1001E |
| 0.35-m f/9.1 Schmidt-Cass | FLI Proline 1001E |
| 0.35-m f/11 Schmidt-Cass | SBIG STL-1001E |
| 0.40-m f/10 Schmidt-Cass | |
| 0.50-m f/8.1 Ritchey-Chrétien |
All lightcurve observations were unfiltered since a clear filter can cause a 0.1-0.3 mag loss. The exposure duration varied depending on the asteroid’s brightness and sky motion. Guiding on a field star sometimes resulted in a trailed image for the asteroid.
Measurements were made using MPO Canopus. The Comp Star Selector utility in MPO Canopus found up to five comparison stars of near solar-color for differential photometry. Catalog magnitudes were taken from the APASS (Henden et al., 2009) or CMC-15 (Munos, 2017) catalogs.
The nightly zero points for the APASS and CMC-15 catalogs are generally consistent to about ±0.05 mag or better, but occasionally reach >0.1 mag. There is a systematic offset between the two catalogs and so, whenever possible, the same catalog is used for all observations of a given asteroid. Period analysis is done with MPO Canopus, which implements the FALC algorithm by Harris (Harris et al., 1989). The same algorithm is used in an iterative fashion if it appears there is more than one period. This works well for binary asteroids but not for tumbling asteroids.
In the plots below, the “Reduced Magnitude” is Johnson V as indicated in the Y-axis title. These are values that have been converted from sky magnitudes to unity distances by applying −5*log (rΔ) to the measured sky magnitudes with r and Δ being, respectively, the Sun-asteroid and Earth-asteroid distances in AU. Unless otherwise stated, the magnitudes were normalized to the phase angle in parentheses using G = 0.15. The X-axis is the rotational phase, ranging from −0.05 to +1.05.
If the plot includes an amplitude, e.g., “Amp: 0.65”, this is the amplitude of the Fourier model curve and not necessarily the adopted amplitude for the lightcurve.
For the sake of brevity, only some of the previously reported results may be referenced in the discussions on a specific asteroid. For a more complete listing, the reader is directed to the asteroid lightcurve database (LCDB; Warner et al., 2009). The on-line version at http://www.minorplanet.info/lightcurvedatabase.html allows direct queries that can be filtered a number of ways and the results saved to a text file. A set of text files of the main LCDB tables, including the references with bibcode, is also available for download. Readers are strongly encouraged, when possible, to cross-check with the original references listed in the LCDB.
433 Eros.
The rotation period of Eros had long been determined to be about 5.27 h by numerous observers prior to the visit of the NEAR-Shoemaker spacecraft, e.g., Warner (2017a). The data from 2018 were obtained to help find a more exact value for the change in rotation rate, if any, due to the YORP (Yarkovsky–O'Keefe–Radzievskii–Paddack) thermal effect (Rubincam, 2000).

719 Albert.
Recovered in 2001 after being lost for several decades, this 2.5 km NEA was observed by Pravec et al. (2001), who found a period of 5.8011 h. However, the 2001 observations were the last to be reported in the LCDB until the results given here.
The amplitude in 2018 was 0.52 mag compared to 0.94 mag found by Pravec et al. (2001) at the time of maximum amplitude in their observations (2001 Aug 23). The phase angle bisector longitude (see Harris et al., 1984) was about 2° and the phase angle was 46°. In 2018, the values were 257° and 17°, respectively. From this a rough estimate of the longitude for the asteroid’s pole is 250° (or 70°) ± 20°.

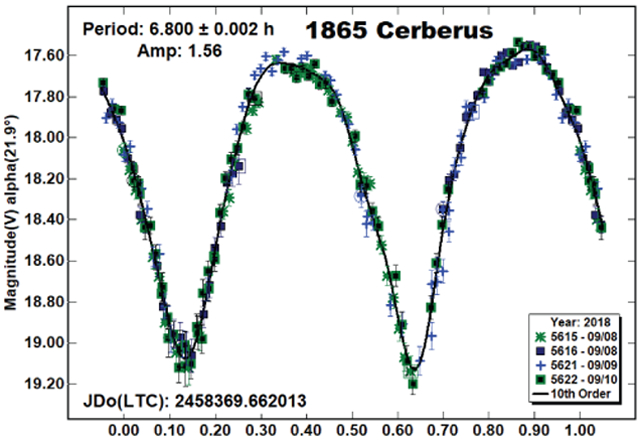
1865 Cerberus.
Among some of the previous synodic period results for Ceberus are Pravec et al. (2008; 6.8039 h) and Skiff (2012; 6.804 h). Our results are in good agreement.
3552 Don Quixote.
This NEA has an orbit that is very “comet-like” and it appears that it really is one. Mommert et al. (2018) reported seeing a tail in visible wavelengths for the first time. There were no obvious signs of cometary activity in our observations and the object did not appear “fuzzier” than nearby stars.

4183 Cuno.
Pravec et al. (1997, 2000) reported a period of about 3.56 h. Warner (2015a) found a similar result. These earlier results were obtained when the lightcurve amplitude was at least 0.47 mag. In 2018, the amplitude was only 0.09 mag and the data errors were almost the same level. As a result, there were several possible solutions. We forced a period near the earlier results and found 3.58 h.

6456 Golombek.
Previous results include Pravec et al. (2005, 2.5013 h; 2018, 2.5016 h). Our results are in good agreement.

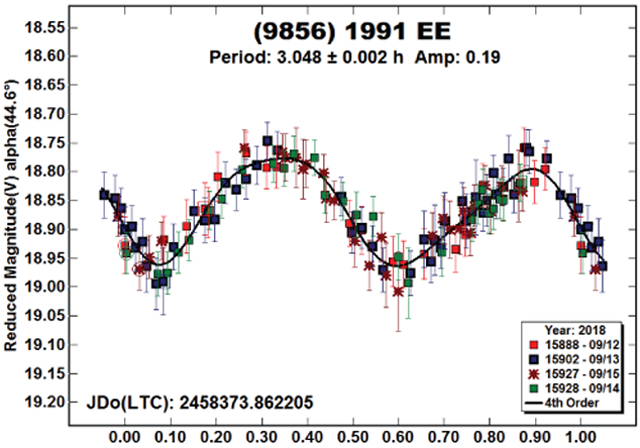
(9856) 1991 EE.
Wisniewski et al. (1997) reported P = 3.045 h for 1991 EE. Warner (2018) observed it in 2018 May and found P = 3.0416 h, A = 0.28 mag. We observed it again in September and found P = 3.048 h, A = 0.19 mag.
13553 Masaakikoyama.
Pravec et al. (2005) found this to be a tumbler, i.e., in non-principal axis rotation. They found a dominant period at about 38 h. Our 2018 data confirm the tumbling state. The data set was insufficient to find the two rotation frequencies even with Pravec’s custom software. MPO Canopus does not allow simultaneous dual period searches and so we provide two lightcurves, each phased to a period that dominated the period spectrum.

(16834) 1997 WU22.
Earlier results include Pravec et al. (2000; 9.345 h), Stephens (2013; 9.374 h), and Warner (2017a; 9.343 h). The Stephens lightcurve is given here since it was not previously published except on the CS3 web site.
Our 2018 data led to a period of 9.348 h, which is within the formal errors of the previous results.

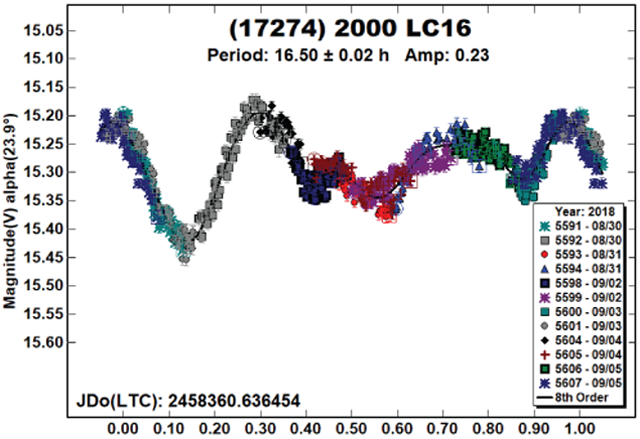
(17274) 2000 LC16.
Our result of 16.50 ± 0.02 h agrees with that reported by Pravec et al. (2000). The amplitude of 0.23 mag is in a “gray area” between small amplitudes where multimodal lightcurves are easily possible and larger amplitude lightcurves where, at low phase angles, a bimodal lightcurve is virtually assured (Harris et al., 2014).
(18109) 2000 NG11.
This is one of the relatively few NEAs observed by two recent Palomar Transient Factory groups: Waszczak et al. (2015) and Chang et al. (2015). They reported periods of, respectively, 4.258 h and 4.25 h. Previous dense lightcurve results include Pravec et al. (2000; P = 4.2534 h, A = 1.13 mag) and Warner (2014a; P = 4.255 h, A = 0.89 mag).

(86324) 1999 WA2.
The period spectrum shows a strong preference for the adopted period of 7.161 h. The lightcurve shape is somewhat asymmetrical but, at larger phase angles, shadowing effects can likely explain some of the anomalies in the expected lightcurve shape.

(86878) 2000 HD24.
This 900-meter NEA was observed by Warner (2014b), who found a period of 23.1 ± 0.5 h. The 2018 data set was of higher-quality, but it was still not possible to get a precise period solution. Our result of P = 15.72 h represents the best fit in the period spectrum, which also includes a nearly equal RMS minimum at about 23 hours. The 2014 data set was reviewed; a reasonable fit of P = 15.65 h was found.
It’s worth noting that the two periods are very close to an integer ratio of 3:2. This usually indicates a rotational alias, which is caused by a miscount of the actual number of rotations over the time span of the data. A rotational alias often occurs with nearly symmetrical lightcurves, where the “wrong half” of a lightcurve is matched to other half.

(115052) 2003 RD6.
This appears to be the first reported rotation period for 2003 RD6. Unfortunately, it’s an ambiguous one. The period spectrum favors two results: 12.08 h and 24.23 h. The lightcurve has been phased to the shorter period. Even a second-order fit for the longer period produced a Fourier model with an amplitude of several magnitudes.
We adopt the shorter period for this paper, but the double period of 24.23 h should be given equal weight.

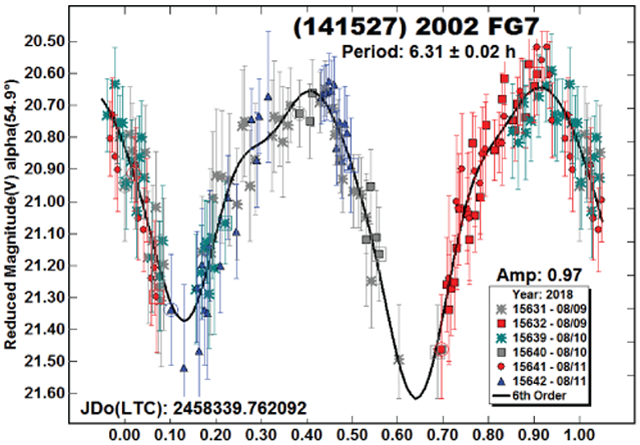
(141527) 2002 FG7.
The phase angle longitude in 2018 differed from the one in 2015 (Warner, 2015b) by 175°, meaning that the 2018 view was of the opposite pole. The gap in coverage and only three nights of data in 2018 allowed only 0.02 h precision for the result. This is statistically the same as the earlier result of 6.306 h.
(283729) 2002 UX, (333889) 1998 SV4, (337248) 2000 RH60.
These appear to be the first reported rotation periods for these three NEAs. The solutions for 2002 UX and 1998 SV4 are considered secure (at least U = 2+ in the LCDB). The solution for 2000 RH60 suffers the fate of being nearly commensurate with an Earth day. Despite this, we consider P = 25.2 h to be more likely correct than not because of the lightcurve amplitude and low phase angle (Harris et al., 2014).


(418929) 2009 DM1.
There were no previous rotation period entries in the LCDB. We consider the solution secure.

(438429) 2006 WN1.
The LCDB had no previous entries of any kind for 2006 WN1.

(441987) 2010 NY65.
Two previous results are from Warner (2016b, 4.979 h; 2017b, 4.973 h). The period spectrum using the 2018 data strongly favors a period of 5.541 h. When forcing the data to a period near 4.97 h, there was a clear mismatch on two nights that could not be corrected by zero point adjustments.

The two periods do not have a simple integer ratio, which helps eliminate a rotational alias. So does the strong asymmetry of the 2018 lightcurve. To see if the discrepancy in periods could be resolved, we took another look at the data from 2016 and 2017. The results did not fully resolve the question.
Forcing the 2016 data to near 5.5 h led to a period of 5.593 h while the 2017 data had a best fit at 5.518 h. These are well outside the limits set by the formal and conservative “10°” errors. The latter is the period difference that results in a 10° rotation difference over the time span of the data set.
The argument for the longer period is reinforced by noting that the two earlier data sets had data from only three consecutive nights. On the other hand, the 2018 data set had five consecutive nights, covering about nine more rotations.

(457260) 2008 RY24.
The 2018 data set produced yet another object with a period that was nearly commensurate with an Earth day. The low amplitude and SNR compounded the problem of finding the correct period. The period spectrum favored the longer period of 8.19 h. However this left a gap in the lightcurve at about 0.7 rotation phase. Such gaps are sometimes caused by the Fourier algorithm finding a period that minimizes the number of overlapping data points. The half-period (4.09 h) lightcurve has no gaps and is monomodal. While we have adopted P = 8.19 h; this is another case where an alternate period should be given equal weight.

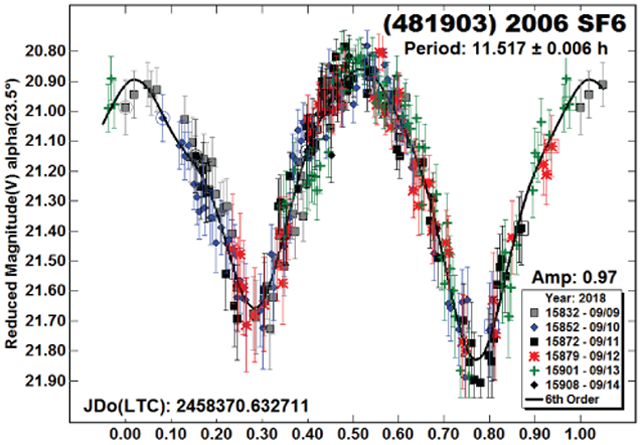
(481394) 2006 SF6, 1999 RB32.
Neither of these NEAs had a previous entry of any kind in the LCDB. The period for 2006 SF6 is considered secure. This is not so for 199 RB32.
There are significant gaps in the lightcurve and the error bars are nearly the amplitude of the lightcurve. Furthermore, the period is nearly commensurate with an Earth day. A period near 24 hours produced a monomodal lightcurve. Given the apparent amplitude of at least 0.27 mag, the longer, bimodal solution was favored.

1999 VQ11.
The period spectrum gave strong preference to the period of 32.21 h. This could be correct or the result of minimizing the number of overlapping data points. The former theory was adopted but the solution is by no means secure.

2001 QA143.
The amplitude of 0.25 mag gave high confidence in the bimodal solution of 11.78 h (Harris et al., 2014) despite missing more than 25% lightcurve.

2005 RB, 2007 RX19.
The two NEAs had no previous entries of any kind in the LCDB. The solutions are considered secure.

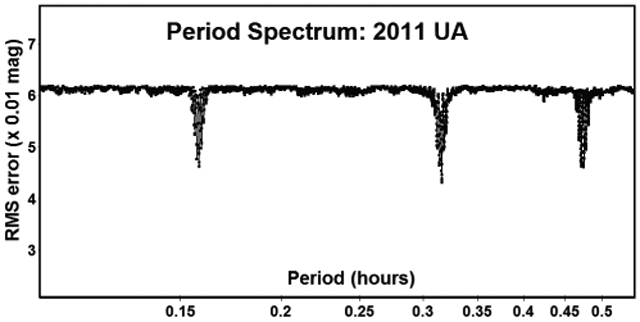
2011 UA.
As the period spectrum shows, there are three very strong solutions. Narrowing down the preferred period relied mostly on the symmetry or asymmetry of the lightcurves.
The shortest solution of about 0.15 h produced a monomodal lightcurve. The low amplitude allowed that possibility (Harris et al., 2014), but the slight asymmetry of the bimodal solution at 0.316391 h eliminated the monomodal solution. This meant that either the bimodal or a quadramodal one with a doubled-period was more likely correct.
A “split-halves” plot was made for the longer period of 0.63280 h. This is where the second half of a lightcurve is superimposed on the first half (see Harris et al., 2014). If this results in the two halves being essentially the same, there is a reasonable chance that the half-period is the correct solution. Based on this, a period of 0.316391 h is adopted here.

Even if the period of 0.15 h or 0.63 h is correct, this still makes the asteroid somewhat unusual. The frequency-diameter plot based on data from the LCDB shows that the asteroid is well above the spin barrier. It is also to the right of the “ascending branch” which starts at about 0.2 km diameter and roughly defines a point where tumbling becomes more possible.
The location on the frequency-diameter plot is very close to the first object discovered (Pravec et al., 2002) in what might be called the “forbidden zone” (the term is ours and not one formally or even informally adopted within the planetary science community). Polishook et al. (2017) did an extensive analysis of the asteroid, including the constraints on the internal structure that would help keep the asteroid from breaking apart given its size and rotation period.

2011 GA62, 2012 OD1.
There were no previous rotation periods in the LCDB for 2011 GA62 or 2012 OD1. The solution for 2011 GA 62 is considered fully secure.

The period for 2012 is not as secure but it is very likely to be close to the correct solution. The large amplitude made this possible despite the large error bars.

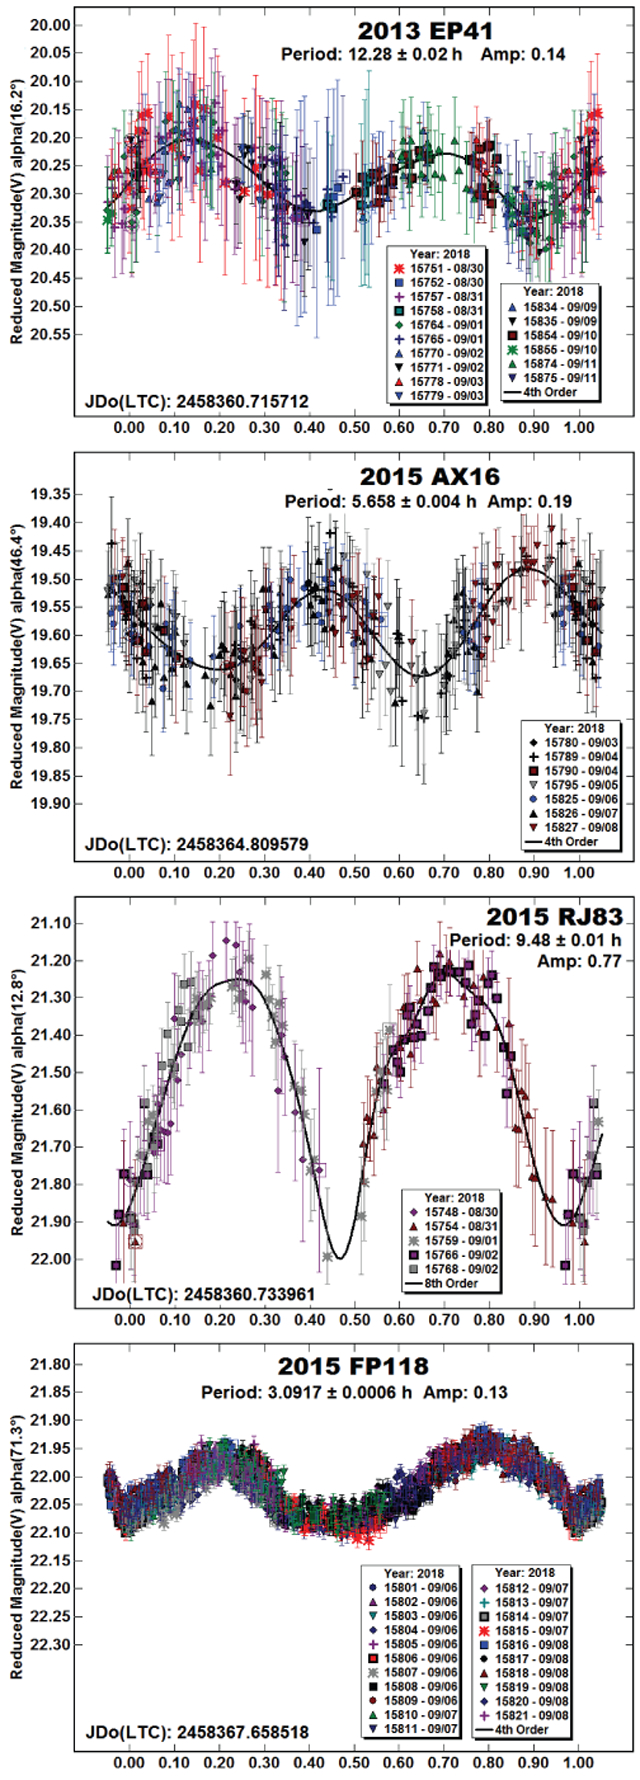
2013 EP41, 2015 AX16, 2015 RJ83, 2015 FP118.
These four NEAs are new additions to the LCDB. Of the four, the solution for 2013 EP41 might be the least secure because of the low amplitude and large error bars.
2016 NF23.
The adopted period of 17.1 h was the best fit in the period spectrum. The result is supported by the slopes of the lightcurve data and model and an amplitude that makes anything other than a bimodal solution unlikely (Harris et al., 2014)

2018 NB.
The period spectrum strongly favored the adopted period of 50.2 h. The half-period, with a monomodal lightcurve, was not considered likely because of the apparent amplitude.

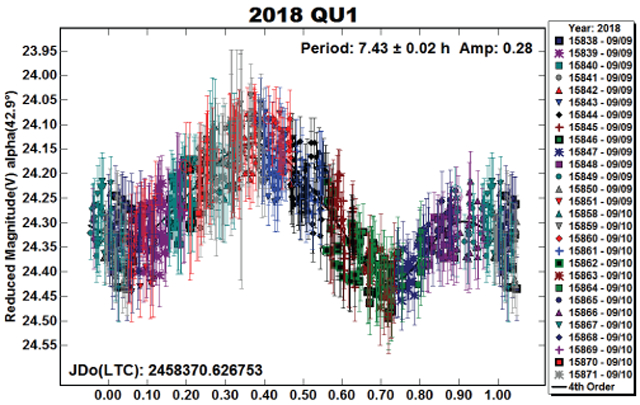
2018 QU1.
There were no previous entries of any kind in the LCDB. Despite the large error bars, the solution is considered secure since the scatter in the data is relatively low and, therefore, the data closely follow the Fourier curve.
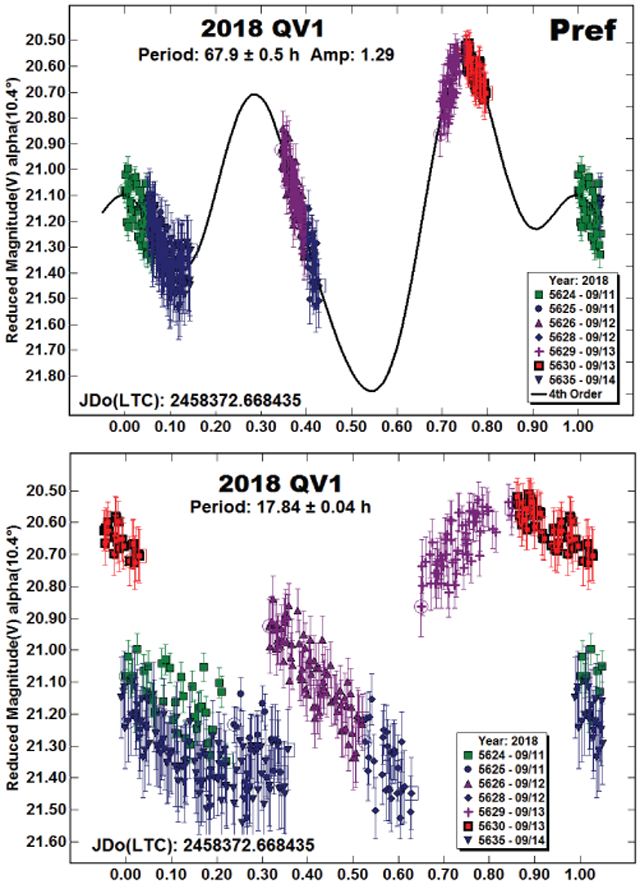
2018 QV1.
The period spectrum favored 67.9 h. To be more certain about this, the data were forced to alternates of 34.1 h and 17.84 h. The lightcurve forced to 17.84 h, shown below, is an improbable result. This reinforces the conclusion that 34.1 h is the approximate half-period of the adopted period of 67.9 h.
Unfortunately, confirming observations are not coming any time soon. The 2018 apparition is the only one between 1995 and 2050 where the asteroid is brighter than V = 18. The brightest apparition from 2019-2050 is V ~ 21.3 in 2049.
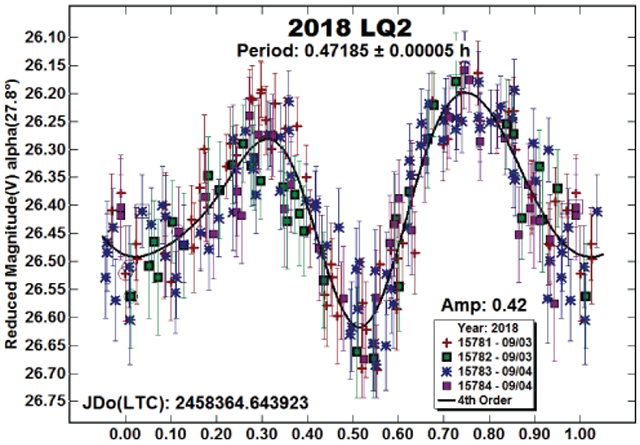
2018 LQ2.
There were no previous entries of any kind in the LCDB. The estimated diameter, assuming an albedo of 0.2, is only 30 meters. At such a small size, it was a good candidate for tumbling. There were no signs of that.
2018 RQ2.
Finding a single period for this 80-meter NEA, and new addition to the LCDB, wasn’t enough. The data fit four nearly likely results. The period spectrum favored 8.58 h (#3), but this had a gap in the bimodal lightcurve that raised concerns that this was a “fit by exclusion” solution, one where the number of overlapping data points is minimized by the Fourier algorithm.
The second more-likely period was the half-period at 4.28 h (#1). However, given the low amplitude and large error bars, a solution of 5.17 h (#2) was examined. This one was chosen over one near 3.8 h because the double period of 10.80 h (#4) produced a bimodal lightcurve with no gaps and had nearly the same RMS fit as the one at 8.58 h. We have adopted P = 8.58 h, mostly because it’s the most favored in the period spectrum.

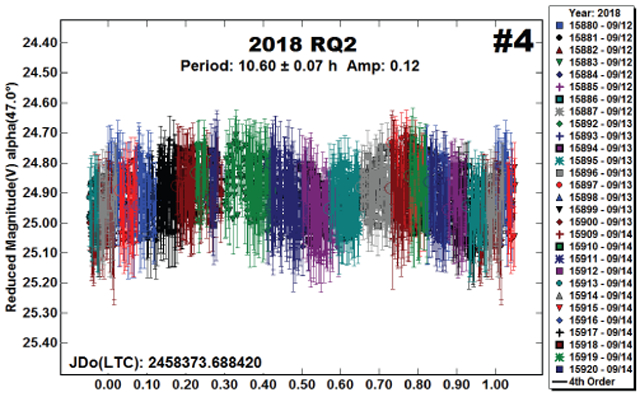
Looking ahead, the only apparition brighter than V = 19 is in 2028. As is the case for so many other NEAs, the observations in 2018 were a once-in-a-lifetime opportunity for those with modest telescopes.
2018 KE3.
The initial observations were made in 2018 mid-August. These led to a period of 4.158 h with no obvious signs of a second period. The follow-up observations three weeks later told a different story.
Those new data indicated the possibility of two periods. One was very similar to the earlier result, P1 = 4.168 h. However, this was superimposed on a longer period, P2 = 47.08 h. Shorter periods for P2 were tried, e.g., ≈24 h. That produced a convincing second-order fit to a monomodal lightcurve. We have adopted 47.08 h for P2.
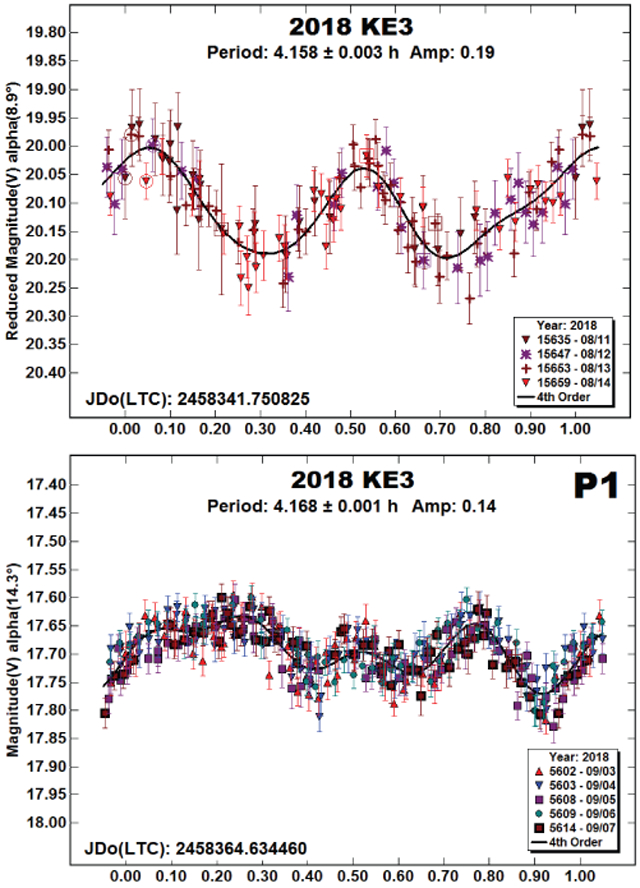

This makes 2018 KE3 a potential new member of the rare class of very wide binaries (see Warner, 2016a).
2018 GA5.
There were no previous entries in the LCDB for this NEA. The solution is weak because of the large error bars.

2018 MM8.
The period spectrum for 2018 MM8 showed several distinct solutions. We used the split-halves plot to try to remove doubt about a period of 5.048 h over one between 2.5-2.9 h. The result showed two distinct halves. Combined with the amplitude of 0.27 mag, P = 5.048 h is considered reasonably secure.


2018 PJ10.
The period spectrum favored 1.75 or 3.5 h. The shorter period produced a bimodal lightcurve with an amplitude of 0.27 mag. This seemed more likely than a quadramodal solution at 3.5 hours. P = 1.75 h puts the asteroid just above the spin barrier in the frequency-diameter plot, but far enough left to be in the ascending branch, making it an “ordinary” and not particularly unusual asteroid.

Table II.
Observing circumstances.
| Number | Name | 2018 mm/dd | Pts | Phase | LPAB | BPAB | Period(h) | P.E. | Amp | A.E. |
|---|---|---|---|---|---|---|---|---|---|---|
| 433 | Eros | 08/18-08/21 | 525 | 40.2,40.3 | 26 | 13 | 5.270 | 0.005 | 0.11 | 0.01 |
| 719 | Albert | 8/08-08/12 | 151 | 44.3,46.0 | 276 | 20 | 5.800 | 0.002 | 1.08 | 0.02 |
| 1865 | Cerberus | 09/08-09/10 | 211 | 21.9,20.6 | 3 | 18 | 6.800 | 0.002 | 1.56 | 0.02 |
| 3552 | Don Quixote | 08/18-08/21 | 219 | 34.8,34.2 | 35 | 18 | 6.665 | 0.005 | 0.58 | 0.02 |
| 4183 | Cuno | 08/09-08/18 | 223 | 5.1,2.0 | 326 | 4 | 3.58 | 0.01 | 0.09 | 0.02 |
| 6456 | Golombek | 07/24-08/03 | 152 | 30.1,24.7 | 328 | 0 | 2.5014 | 0.0002 | 0.14 | 0.01 |
| 9856 | 1991 EE | 09/12-09/15 | 124 | 44.7,41.7 | 32 | −7 | 3.048 | 0.002 | 0.19 | 0.01 |
| 13553 | Masaakikoyama | 08/19-08/26 | 2098 | 23.0,18.2 | 337 | 13 | 58 | 3 | 0.75 | 0.10 |
| 16834 | 1997 WU22 | 09/15-09/18 | 189 | 27.4,26.0 | 27 | 21 | 9.349 | 0.004 | 0.63 | 0.03 |
| 17274 | 2000 LC16 | 08/30-09/05 | 665 | 24.0,25.3 | 323 | 8 | 16.50 | 0.02 | 0.23 | 0.02 |
| 18109 | 2000 NG11 | 08/23-08/25 | 200 | 10.8,9.7 | 339 | −2 | 4.253 | 0.005 | 0.78 | 0.02 |
| 86324 | 1999 WA2 | 08/18-08/28 | 279 | 44.4,51.0 | 287 | 20 | 7.161 | 0.003 | 0.18 | 0.02 |
| 86878 | 2000 HD24 | 08/11-08/21 | 277 | 68.9,89.1 | 16 | 27 | 15.72 | 0.02 | 0.28 | 0.05 |
| 115052 | 2003 RD6 | 09/03-09/08 | 413 | 36.4,31.1 | 360 | 26 | 12.08 | 0.04 | 0.11 | 0.02 |
| 141527 | 2002 FG7 | 08/09-08/10 | 163 | 54.8,56.4 | 353 | 18 | 6.31 | 0.02 | 0.97 | 0.05 |
| 283729 | 2002 UX | 07/31-08/06 | 110 | 40.1,43.3 | 286 | 28 | 5.937 | 0.005 | 0.23 | 0.02 |
| 333889 | 1998 SV4 | 09/05-09/08 | 169 | 35.6,32.3 | 15 | −2 | 2.817 | 0.002 | 0.27 | 0.03 |
| 337248 | 2000 RH60 | 09/12-09/15 | 288 | 10.5,8.9 | 351 | 7 | 25.2 | 0.1 | 0.35 | 0.04 |
| 418929 | 2009 DM1 | 08/27-09/02 | 204 | 19.2,3.5,18.4 | 343 | 15 | 4.590 | 0.005 | 0.17 | 0.03 |
| 438429 | 2006 WN1 | 08/30-09/02 | 208 | 32.3,32.1 | 323 | 16 | 3.407 | 0.002 | 0.18 | 0.02 |
| 441987 | 2010 NY65 | 1607/01-07/03 | 511 | 56.6,51.9 | 259 | 21 | 5.593 | 0.007 | 0.18 | 0.03 |
| 441987 | 2010 NY65 | 1706/27-06/29 | 593 | 71.2,58.3 | 257 | 29 | 5.518 | 0.004 | 0.16 | 0.02 |
| 441987 | 2010 NY65 | 07/02-07/06 | 292 | 48.2,43.3 | 268 | 22 | 5.541 | 0.003 | 0.24 | 0.03 |
| 457260 | 2008 RY24 | 09/04-09/05 | 214 | 30.0,29.9 | 10 | 8 | 8.19 | 0.02 | 0.09 | 0.02 |
| 481394 | 2006 SF6 | 09/09-09/13 | 246 | 23.5,22.8 | 348 | 17 | 11.517 | 0.006 | 0.97 | 0.04 |
| 1999 RB32 | 08/09-08/17 | 170 | 22.9,26.5 | 337 | −1 | 42.7 | 0.2 | 0.27 | 0.03 | |
| 1999 VQ11 | 09/10-09/24 | 152 | 60.6,61.5 | 47 | −3 | 32.21 | 0.02 | 0.79 | 0.10 | |
| 2001 QA143 | 09/11-09/14 | 135 | 22.8,22.9 | 2 | 13 | 11.78 | 0.03 | 0.25 | 0.03 | |
| 2005 RB | 09/03-09/05 | 415 | 16.2,13.7 | 345 | 10 | 8.270 | 0.004 | 0.57 | 0.03 | |
| 2007 RX19 | 09/09-09/11 | 237 | 6.4,4.4 | 353 | 1 | 8.64 | 0.01 | 0.68 | 0.04 | |
| 2011 UA | 08/27-09/02 | 375 | 43.2,35.9 | 179 | −6 | 0.316391 | 0.000007 | 0.13 | 0.03 | |
| 2011 GA62 | 06/22-07/01 | 419 | 30.6,34.5 | 293 | 11 | 2.6511 | 0.0004 | 0.15 | 0.02 | |
| 2012 OD1 | 07/24-08/03 | 274 | 75.5,60.9 | 340 | 29 | 12.63 | 0.02 | 0.63 | 0.05 | |
| 2013 EP41 | 08/30-09/11 | 300 | 16.2,2.8,3.1 | 348 | 3 | 12.28 | 0.02 | 0.14 | 0.02 | |
| 2015 AX16 | 09/03-09/08 | 266 | 46.4,48.5 | 22 | 1 | 5.658 | 0.004 | 0.19 | 0.03 | |
| 2015 RJ83 | 08/30-09/01 | 162 | 12.8,10.9 | 344 | 5 | 9.48 | 0.01 | 0.76 | 0.04 | |
| 2015 FP118 | 09/06-09/08 | 1304 | 70.6,59.0 | 6 | 27 | 3.0917 | 0.0006 | 0.13 | 0.01 | |
| 2016 NF23 | 08/22-08/24 | 572 | 16.4,5.7 | 336 | 0 | 17.1 | 0.2 | 0.39 | 0.05 | |
| 2018 NB | 07/24-07/29 | 396 | 43.9,52.2 | 330 | 0 | 50.2 | 0.2 | 0.39 | 0.04 | |
| 2018 QU1 | 09/09-09/10 | 721 | 44.9,57.4 | 355 | 26 | 7.43 | 0.02 | 0.28 | 0.04 | |
| 2018 QV1 | 09/11-09/14 | 397 | 10.4,13.4 | 342 | 4 | 67.9 | 0.5 | 0.85 | 0.10 | |
| 2018 LQ2 | 09/03-09/04 | 208 | 30.2,28.6 | 338 | 15 | 0.47185 | 0.00005 | 0.42 | 0.03 | |
| 2018 RQ2 | 09/12-09/14 | 1470 | 47.2,56.7 | 15 | 9 | 8.58 | 0.03 | 0.13 | 0.03 | |
| 2018 KE3 | 08/11-08/14 | 124 | 8.9,7.8 | 326 | 0 | 4.158 | 0.003 | 0.19 | 0.01 | |
| 2018 KE3 | 09/03-09/07 | 326 | 14.3,16.1 | 341 | 11 | P4.168 | 0.001 | 0.14 | 0.02 | |
| 2018 KE3 | 47.08 | 0.14 | 0.23 | 0.02 | ||||||
| 2018 GA5 | 08/08-08/17 | 276 | 61.5,54.7 | 81 | −10 | 4.92 | 0.02 | 0.21 | 0.04 | |
| 2018 MM8 | 12/31-12/31 | 180 | 30.2,0.0,28.6 | 0 | 0 | 5.048 | 0.004 | 0.27 | 0.03 | |
| 2018 PJ10 | 08/15-08/15 | 137 | 27.1,27.1 | 338 | 4 | 1.75 | 0.01 | 0.27 | 0.04 |
indicates the data are from 20yy.
indicates the period for the primary in a binary system. The phase iangle (α) is given at the start and end of each date range, unless it reached a minimum, which is then the second of three values. LPAB and BPAB are, respectively the average phase angle bisector longitude and latitude.
Acknowledgements
Observations at CS3 and continued support of the asteroid lightcurve database (LCDB; Warner et al., 2009) are supported by NASA grant 80NSSC18K0851. Work on the asteroid lightcurve database (LCDB) was also partially funded by National Science Foundation grant AST-1507535.
This research was made possible through the use of the AAVSO Photometric All-Sky Survey (APASS), funded by the Robert Martin Ayers Sciences Fund, and by data from CMC15 Data Access Service at CAB (INTA-CSIC) (http://svo2.cab.inta-csic.es/vocats/cmc15/).
The authors gratefully acknowledge Shoemaker NEO Grants from the Planetary Society (2007, 2013). These were used to purchase some of the telescopes and CCD cameras used in this research.
Contributor Information
Brian D. Warner, Center for Solar System Studies / MoreData! 446 Sycamore Ave., Eaton, CO 80615 USA
Robert D. Stephens, Center for Solar System Studies / MoreData! Rancho Cucamonga, CA 91730
References
References from web sites should be considered transitory, unless from an agency with a long lifetime expectancy. Sites run by private individuals, even if on an institutional web site, do not necessarily fall into this category.
- Chang C-K, Ip W-H, Lin H-W, Cheng Y-C, Ngeow C-C, Yang T-C, Waszczak A, Kulkarni SR, Levitan D, Sesar B, Laher R, Surace J, Prince TA (2015). “Asteroid Spin-rate Study Using the Intermediate Palomar Transient Factory.” Ap. J. Suppl. Ser 219, A27. [Google Scholar]
- Harris AW, Young JW, Scaltriti F, Zappala V (1984). “Lightcurves and phase relations of the asteroids 82 Alkmene and 444 Gyptis.” Icarus 57, 251–258. [Google Scholar]
- Harris AW, Young JW, Bowell E, Martin LJ, Millis RL, Poutanen M, Scaltriti F, Zappala V, Schober HJ, Debehogne H, Zeigler KW (1989). “Photoelectric Observations of Asteroids 3, 24, 60, 261, and 863.” Icarus 77, 171–186. [Google Scholar]
- Harris AW, Pravec P, Galad A, Skiff BA, Warner BD, Vilagi J, Gajdos S, Carbognani A, Hornoch K, Kusnirak P, Cooney WR, Gross J, Terrell D, Higgins D, Bowell E, Koehn BW (2014). “On the maximum amplitude of harmonics on an asteroid lightcurve.” Icarus 235, 55–59. [Google Scholar]
- Henden AA, Terrell D, Levine SE, Templeton M, Smith TC, Welch DL (2009). http://www.aavso.org/apass
- Mommert M, Polishook D, Moskovitz N (2018). CBET 4502.
- Munos JL (2017) Carlsberg Meridian Catalog web site. http://svo2.cab.inta-csic.es/vocats/cmc15/
- Polishook D, Moskovitz N, Thirouin A, Bosh A, Levine S, Zuluaga C, Tegler SC, Aharonson O (2017). “The fast spin of near-Earth asteroid (455213) 2001 OE84, revisited after 14 years: Constraints on internal structure.” Icarus 297, 126–133. [Google Scholar]
- Pravec P, Wolf M, Sarounova L (1997, 2000, 2001, 2005, 2008, 2018). http://www.asu.cas.cz/~ppravec/neo.htm
- Pravec P, Kusnirak P, Sarounova L, Harris AW, Binzel RP, Rivkin AS (2002). “Large coherent asteroid 2001 OE84.” Proc. ACM 2002, ESA SP-500, 743–745. [Google Scholar]
- Rubincam DP (2000). “Relative Spin-up and Spin-down of Small Asteroids.” Icarus 148, 2–11. [Google Scholar]
- Skiff BA, Bowell E, Koehn BW, Sanborn JJ, McLelland KP, Warner BD (2012). Minor Planet Bull. 39, 111–130. [Google Scholar]
- Stephens RD (2013) http://www.planetarysciences.org/PHP/CS3_Lightcurves.php
- Warner BD, Harris AW, Pravec P (2009). “The Asteroid Lightcurve Database.” Icarus 202, 134–146. Updated 2018 April. http://www.minorplanet.info/lightcurvedatabase.html [Google Scholar]
- Warner BD (2014a). Minor Planet Bull. 41, 113–124. [PMC free article] [PubMed] [Google Scholar]
- Warner Brian D. (2014b). “Near-Earth Asteroid Lightcurve Analysis at CS3-Palmer Divide Station: 2014 March-June.” Minor Planet Bull. 41, 213–224. [PMC free article] [PubMed] [Google Scholar]
- Warner BD (2015a). “Near-Earth Asteroid Lightcurve Analysis at CS3-Palmer Divide Station: 2014 October-December.” Minor Planet Bull. 42, 115–127. [PMC free article] [PubMed] [Google Scholar]
- Warner BD (2015b). “Near-Earth Asteroid Lightcurve Analysis at CS3-Palmer Divide Station: 2015 March-June.” Minor Planet Bull. 42, 256–266. [PMC free article] [PubMed] [Google Scholar]
- Warner BD (2016a). “Three Additional Candidates for the Group of Very Wide Binaries.” Minor Planet Bul. 43, 306–309. [PMC free article] [PubMed] [Google Scholar]
- Warner BD (2016b). “Near-Earth Asteroid Lightcurve Analysis at CS3-Palmer Divide Station: 2016 April-July.” Minor Planet Bull. 43, 311–319. [PMC free article] [PubMed] [Google Scholar]
- Warner BD (2017a). “Near-Earth Asteroid Lightcurve Analysis at CS3-Palmer Divide Station: 2016 July-September.” Minor Planet Bull. 44, 22–36. [PMC free article] [PubMed] [Google Scholar]
- Warner BD (2017b). “Near-Earth Asteroid Lightcurve at CS3-Palmer Divide Station: 2017 April thru June.” Minor Planet Bull. 44, 335–344. [PMC free article] [PubMed] [Google Scholar]
- Warner BD (2018). “Near-Earth Asteroid Lightcurve Analysis at CS3-Palmer Divide Station: 2018 April-June.” Minor Planet Bull. 45, 366–379. [PMC free article] [PubMed] [Google Scholar]
- Waszczak A, Chang C-K, Ofek EO, Laher R, Masci F, Levitan D, Surace J, Cheng Y-C, Ip W-H, Kinoshita D, Helou G, Prince TA, Kulkarni S (2015). “Asteroid Light Curves from the Palomar Transient Factory Survey: Rotation Periods and Phase Functions from Sparse Photometry.” Astron. J 150, A75. [Google Scholar]
- Wisniewski WZ, Michalowski TM, Harris AW, McMillan RS (1997). “Photometric Observations of 125 Asteroids.” Icarus 126, 395–449. [Google Scholar]