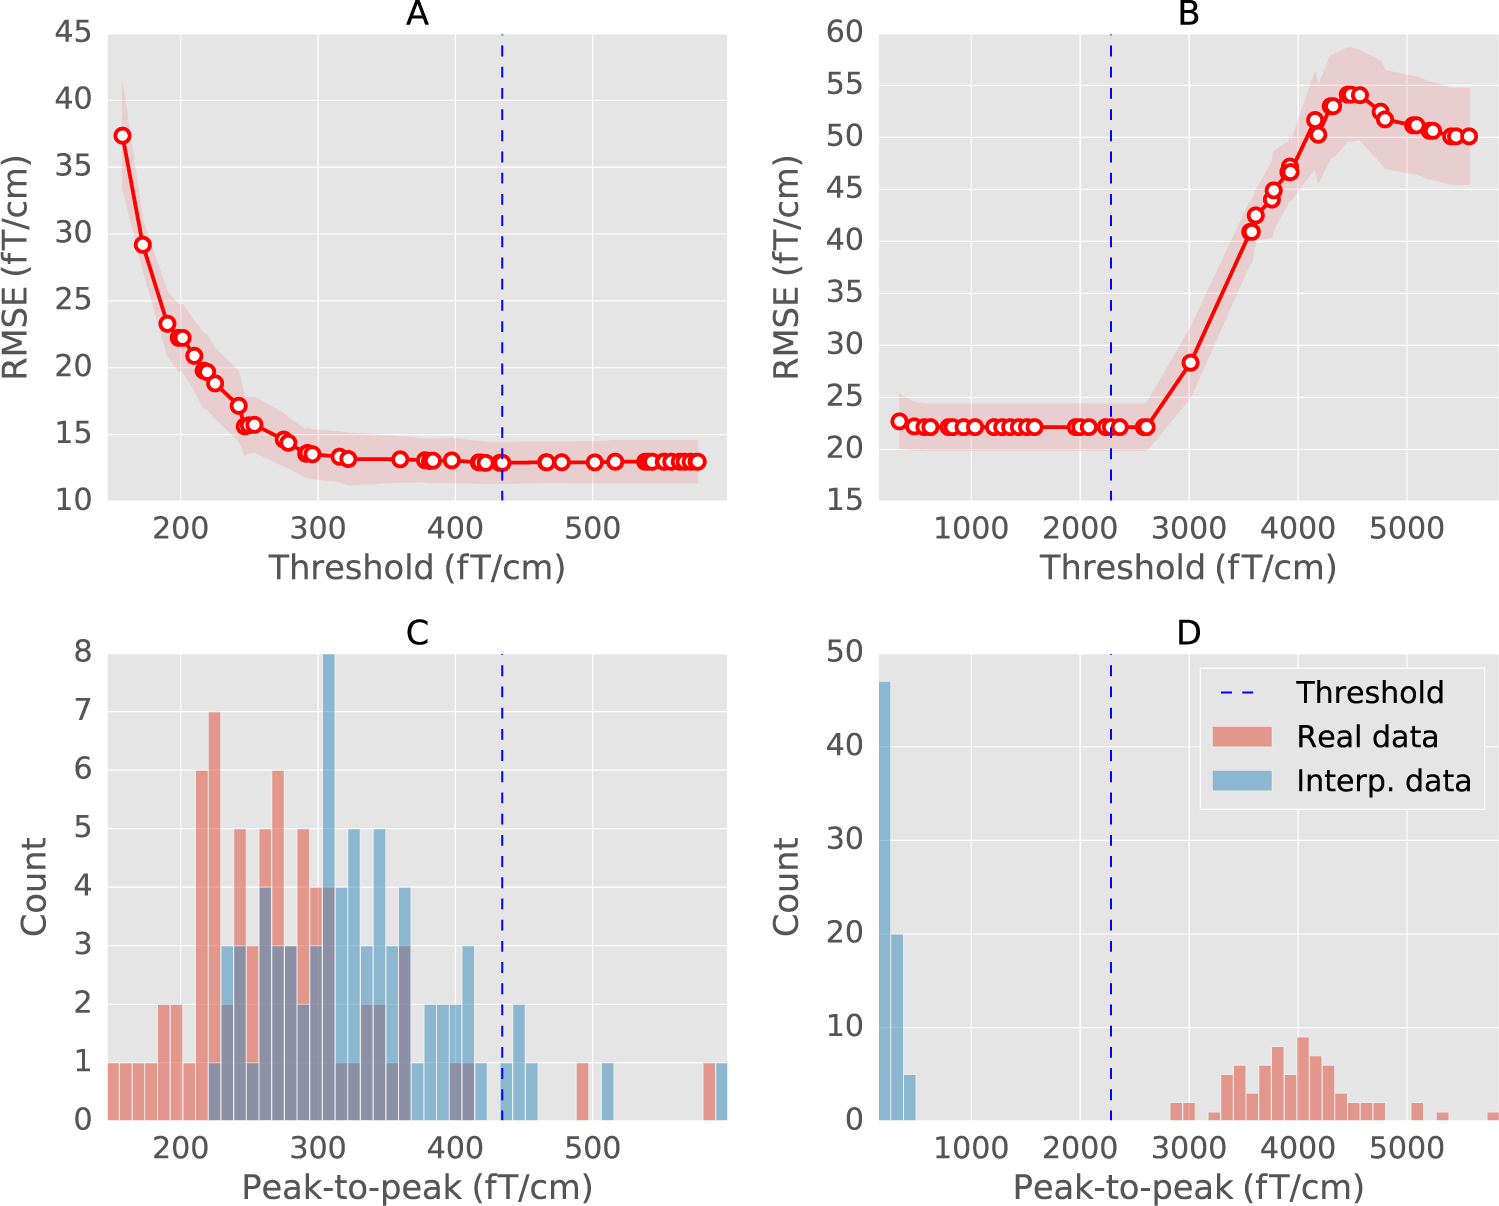
Fig. 3.

(A) and (B) The cross-validation curve obtained with sequential Bayesian optimization (see section on Bayesian optimization for an explanation) for a regular (MEG 2523) and a globally bad sensor (MEG 2443) from the MNE sample dataset. The mean RMSE is shown in red circles with error bounds in red shades. The red shaded region shows the lower and upper bounds between which the optimization is carried out. Vertical dashed line marks the estimated threshold. (C) and (D) Histogram of peak-to-peak amplitudes of trials in the sensor. The histograms are computed separately for the real data (red) and the data interpolated from other sensors (blue). The estimated threshold correctly marks all the trials as bad for the globally bad sensor.
