

Abstract
CCD photometry observations made in 2015 October and November of the Vestoid asteroid 5425 Vojtech showed it to be binary. The primary lightcurve has a period of 2.64759 ± 0.000004 h and an amplitude 0.27 ± 0.02 mag. The orbital period of the satellite is 25.43 ± 0.02 h. Based on mutual events ranging from 0.05 to 0.09 mag, the estimated effective diameter ratio of the two bodies is Ds/Dp ≥ 0.22 ± 0.02.
Based on its orbital parameters, the asteroid 5425 Vojtech is believed to be a member of the Vestoid orbital group (Warner et al., 2009). True Vestoids, those that were part of the original parent body of Vesta, would have an albedo on the order of pv ~ 0.4 However, the orbital space includes a large number of interlopers. This may be the case for Vojtech since its albedo of pv = 0.243 ± 0.074 (Masiero et al., 2012) is more like that of a type S asteroid (Warner et al., 2009).
Vojtech was observed as part of an on-going asteroid lightcurve program at the Center for Solar System Studies (CS3) that concentrates mostly on near-Earth and Hungaria asteroids as well as Jupiter Trojans. When none of those are available, other targets are chosen to avoid idle telescope time.
The only previous lightcurve result in the asteroid lightcurve database (LCDB; Warner et al., 2009) was from Vander Haagen (2012), who reported a bimodal lightcurve with a period of 2.648 h and amplitude of 0.27 mag. That lightcurve showed no obvious signs of a satellite even though the phase angle bisector longitude (see Harris et al., 1984) was only 25° from the one during the 2015 observations. Why this might happen is discussed later.
The observations were made by Stephens using a 0.35-m Schmidt-Cassegrain telescope with Finger Lakes MicroLine PL-1001E CCD camera. The 300-second exposures were unguided and made without a filter. Table I gives the observation circumstances over a span of almost three weeks.
Table I.
Observing circumstances for 5425 Vojtech. The last two columns are the phase angle bisector longitude and latitude (see Harris et al., 1984). The values were computed for 8 h UT, or about the middle of each observing run.
| 2015 mmm/dd | Phase | LPAB | BPAB |
|---|---|---|---|
| Oct 26 | 13.2 | 54.4 | 6.8 |
| Oct 27 | 12.7 | 54.5 | 6.9 |
| Nov 02 | 9.9 | 54.9 | 7.1 |
| Nov 05 | 8.6 | 55.1 | 7.2 |
| Nov 06 | 8.1 | 55.2 | 7.3 |
| Nov 07 | 7.6 | 55.2 | 7.3 |
| Nov 08 | 7.2 | 55.3 | 7.3 |
| Nov 09 | 6.8 | 55.3 | 7.4 |
| Nov 10 | 6.4 | 55.4 | 7.4 |
| Nov 11 | 6.0 | 55.4 | 7.4 |
| Nov 19 | 4.5 | 55.7 | 7.6 |
The raw images were flat-field and dark subtracted before being measured in MPO Canopus. Night-to-night linkage was aided by the Comp Star Selector utility which helps find near-solar color comparison stars, thus reducing color difference issues. Stars were chosen from the MPOSC catalog, which is based on the 2MASS catalog (http://irsa.ipac.caltech.edu/Missions/2mass.html). The J-K magnitudes in 2MASS were converted to V magnitudes using formulae by Warner (2007). Generally, the zero points are within ±0.05 of one another, but larger adjustments can be required to minimize the RMS value from the Fourier analysis.
Period analysis was also done in MPO Canopus, which employs the FALC Fourier analysis algorithm developed by Harris (Harris et al., 1989). The initial observations at the end of October did not show any signs of a satellite. However, starting with the Nov 2 observing run, there were apparent deviations from the single period lightcurve (“No Sub” plot) that required further investigation using the dual-period function.

In the dual-period search process, an initial value is found for the dominant (usually shorter) period. The Fourier model lightcurve is subtracted from the data set in the succeeding search for a second period. The Fourier curve for that second period is subtracted from the data set in a new search for the dominant period. If, for example, the dominant solution produces a trimodal instead of bimodal lightcurve (the latter being the presumptive choice), the initial search is started anew but the period search range is restricted to eliminate finding the trimodal solution. The iterative process continues until both periods stabilize and it produces reasonable lightcurves.
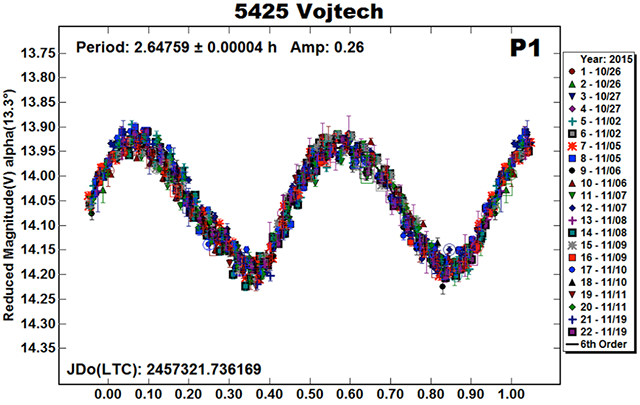
The dual period analysis found a primary lightcurve of P1 = 2.64759 ± 0.00004 h, A1 = 0.27 ± 0.02 mag (“P1” plot). Assuming an equatorial view of the asteroid, this leads to an a/b ratio of the asteroid’s silhouette of 1.28:1. Subtracting this lightcurve from the data set and doing a period search found a solution that clearly shows mutual events (occultations and/or eclipses) due to a satellite (“P2” plot). The lightcurve has a period of PORB = 25.43 ± 0.02 h, AORB = 0.05-0.09 mag.
Outside the events, the lightcurve was essentially flat, which likely indicates a nearly spheroidal shape for the satellite that is probably tidally-locked to the orbital period.

Using the shallower event of 0.05 mag and
where m is the depth of the shallower event in magnitudes, gives Ds/Dp ≥ 0.22 ± 0.02. Since neither event was total, the estimate is a minimum value and could be larger.
Each observing run covered about eight hours, or about 1/3 the orbital period and short enough for the observing window to be placed between the two events and so show no indications of the satellite. Each day, the window moved about 0.06 period phase to the left. Eventually, as happened starting Nov 2, the window started to cover one of the events. The slow migration, however, meant observing the asteroid for a prolonged period to get sufficient coverage of the secondary lightcurve.
It’s likely that Vander Haagen encountered this problem during his observations in 2012 and so, by a stroke of poor luck, observed on four nights when the observing window did not include one of the events.
Acknowledgements
Funding for PDS observations, analysis, and publication was provided by NASA grant NNX13AP56G. Work on the asteroid lightcurve database (LCDB) was also funded in part by National Science Foundation grant AST-1507535.
This publication makes use of data products from the Two Micron All Sky Survey, which is a joint project of the University of Massachusetts and the Infrared Processing and Analysis Center/California Institute of Technology, funded by the National Aeronautics and Space Administration and the National Science Foundation. (http://www.ipac.caltech.edu/2mass/)
Contributor Information
Robert D. Stephens, Center for Solar System Studies (CS3) / MoreData!, 11355 Mount Johnson Ct., Rancho Cucamonga, CA 91737 USA
Brian D. Warner, Center for Solar System Studies – Palmer Divide Station, Eaton, CO USA
References
- Harris AW, Young JW, Scaltriti F, Zappala V (1984). “Lightcurves and phase relations of the asteroids 82 Alkmene and 444 Gyptis.” Icarus 57, 251–258. [Google Scholar]
- Harris AW, Young JW, Bowell E, Martin LJ, Millis RL, Poutanen M, Scaltriti F, Zappala V, Schober HJ, Debehogne H, Zeigler KW (1989). “Photoelectric Observations of Asteroids 3, 24, 60, 261, and 863.” Icarus 77, 171–186. [Google Scholar]
- Masiero JR, Mainzer AK, Grav T, Bauer JM, Cutri RM, Nugent C, Cabrera MS (2012). “Preliminary Analysis of WISE/NEOWISE 3-Band Cryogenic and Post-Cryogenic Observations of Main Belt Asteroids.” Ap. J. Letters 759, L8. [Google Scholar]
- Vander Haagen GA (2012). “Lightcurves of 724 Hapag, 2423 Ibarruri, 4274 Karamanov, 4339 Alamater, and 5425 Vojtech.” Minor Planet Bull. 39, 48–50. [Google Scholar]
- Warner BD (2007). “Initial Results of a Dedicated H-G Program.” Minor Planet Bul. 34, 113–119. [Google Scholar]
- Warner BD, Harris AW, Pravec P (2009). “The Asteroid Lightcurve Database.” Icarus 202, 134–146. Updated 2015 Dec. http://www.minorplanet.info/lightcurvedatabase.html [Google Scholar]