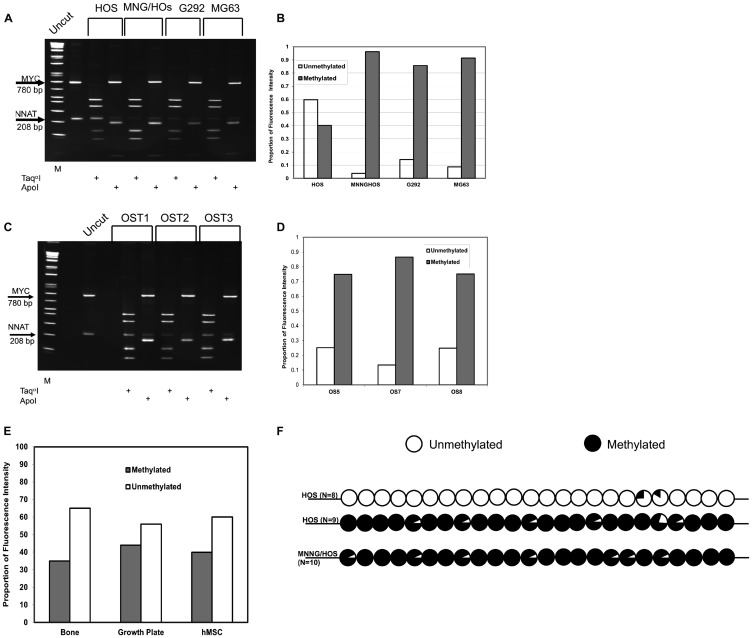
Figure 2. COBRA analysis demonstrates NNAT hypermethylation in osteosarcoma cell lines and primary tumor samples but not in normal bone or bone progenitors.
(A) Genomic DNA from osteosarcoma cell lines was bisulfite modified and PCR-amplified with methylcytosine-specific primers. Products were digested with TaqαI to assess methylation or ApoI to assess the completeness of bisulfite modification. A 280 bp PCR fragment from the MYC CpG island was added to osteosarcoma DNA amplification products as a TaqαI digestion control. Digested DNA was fractionated on a polyacrylamide gel. Restriction fragment lengths are as follows: MYC/TaqαI – undigested 780 bp, digested – 424 bp and 356 bp; NNAT/TaqαI – undigested 208 bp, digested 127 bp and 81 bp. DNA samples are (L to R): 1 kb marker, undigested control PCR products, HOS/TaqαI, HOS/ApoI, MNNGHOS/TaqαI, MNNGHOS/ApoI, G-292/TaqαI, G-292/ApoI, MG-63/TaqαI, MG-63/ApoI. (B) The proportions of methylated versus unmethylated NNAT alleles were quantitated for Figure 2A by analysis of the ethidium bromide-stained gel under UV illumination. The proportion of unmethylated NNAT alleles equals the proportional intensity of the 208 bp NNAT/TaqαI band while the proportion of methylated NNAT alleles equals the sum of the proportional intensities of the 127 bp plus the 81 bp NNAT/TaqαI bands. Shown is a representative result of 3 experiments. (C) COBRA analysis of NNAT allelic methylation in 3 representative osteosarcoma primary tumor samples (OS) was performed as described for Figure 2A. DNA samples are (L to R): 1 kb marker, undigested control PCR products, OS1/TaqαI, OS1/ApoI, OS2/TaqαI, OS2/ApoI, OS3/TaqαI, OS/ApoI. (D) Quantitative analysis of the COBRA Figure 2C was performed as described for Figure 2B. Shown is a representative result of 3 experiments. (E) Quantitative COBRA methylation analysis was performed for normal human bone, human bone growth plate, and cultured human mesenchymal stem cells. Shown is a representative result of 3 experiments. (F) Methylation was determined across the NNAT CpG island by bisulfite sequencing in HOS and MNNG/HOS human osteosarcoma cells. Circles represent the composite methylation status of 24 CpG sites compiled from sequence analysis of multiple independent clones for each cell line where unfilled reflects no methylation and fully filled reflects full methylation. N indicates the number of independent clones sequenced for each cell line.

