

Abstract
Lightcurves for 43 near-Earth asteroids (NEAs) were obtained at the Center for Solar System Studies-Palmer Divide Station (CS3-PDS) from 2014 October through December.
CCD photometric observations of 43 near-Earth asteroids (NEAs) were made at the Center for Solar System Studies-Palmer Divide Station (CS3-PDS) in 2014 October through December. Table 1 lists the telescope/CCD camera combinations used for the observations. All the cameras use CCD chips from the KAF blue- enhanced family and so have essentially the same response. The pixel scales for the combinations range from 1.24-1.60 arcsec/pixel.
Table I.
List of CS3-PDS telescope/CCD camera combinations.
| Desig | Telescope | Camera | |
|---|---|---|---|
| Squirt | 0.30–m f/6.3 | Schmidt–Cass | ML–1001E |
| Borealis | 0.35–m f/9.1 | Schmidt–Cass | FLI–1001E |
| Eclipticalis | 0.35–m f/9.1 | Schmidt–Cass | STL–1001E |
| Australius | 0.35–m f/9.1 | Schmidt–Cass | STL–1001E |
| Zephyr | 0.50–m f/8.1 | R–C | FLI–1001E |
All lightcurve observations were unfiltered since a clear filter can result in a 0.1-0.3 magnitude loss. The exposure duration varied depending on the asteroid’s brightness and sky motion. Guiding on a field star sometimes resulted in a trailed image for the asteroid.
Measurements were done using MPO Canopus. If necessary, an elliptical aperture with the long axis parallel to the asteroid’s path was used. The Comp Star Selector utility in MPO Canopus found up to five comparison stars of near solar-color for differential photometry. Catalog magnitudes were usually taken from the MPOSC3 catalog, which is based on the 2MASS catalog (http://www.ipac.caltech.edu/2mass) but with magnitudes converted from J-K to BVRI using formulae developed by Warner (2007). When possible, magnitudes are taken from the APASS catalog (Henden et al., 2009) since these are derived directly from reductions based on Landolt standard fields. Using either catalog, the nightly zero points have been found to be consistent to about ± 0.05 mag or better, but on occasion are as large as 0.1 mag. This consistency is critical to analysis of long period and/or tumbling asteroids. Period analysis is also done using MPO Canopus, which implements the FALC algorithm developed by Harris (Harris et al., 1989).
In the plots below, the “Reduced Magnitude” is Johnson V as indicated in the Y-axis title. These are values that have been converted from sky magnitudes to unity distance by applying −5*log (rΔ) to the measured sky magnitudes with r and Δ being, respectively, the Sun-asteroid and Earth-asteroid distances in AU. The magnitudes were normalized to the given phase angle, e.g., alpha(6.5°), using G = 0.15, unless otherwise stated. The X-axis is the rotational phase, ranging from −0.05 to 1.05.
For the sake of brevity, only some of the previously reported results may be referenced in the discussions on specific asteroids. For a more complete listing, the reader is directed to the asteroid lightcurve database (LCDB; Warner et al., 2009). The on-line version at http://www.minorplanet.info/lightcurvedatabase.html allows direct queries that can be filtered a number of ways and the results saved to a text file. A set of text files of the main LCDB tables, including the references with bibcodes, is also available for download. Readers are strongly encouraged to obtain, when possible, the original references listed in the LCDB for their work.
2340 Hathor.
Initial observations in 2014 mid-October found two possible results, as seen in the period spectrum.

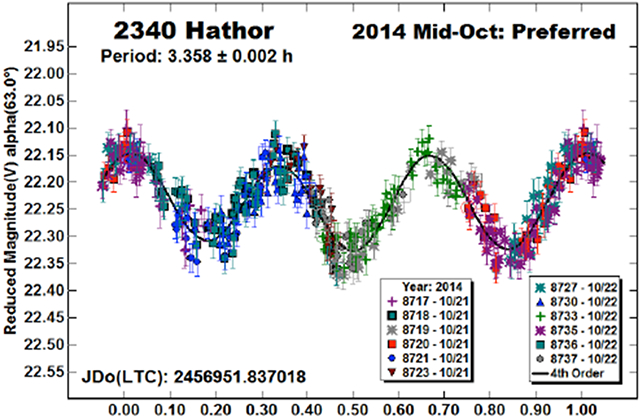

The bimodal lightcurve had a period of 2.239 h while a lightcurve with a complex asymmetric trimodal shape had a period of 3.358 h. Pravec et al. (private communications) had a more extensive data set that confirmed the longer period. The large phase angle of more the 60° likely lead to shadowing that produced the more complex lightcurve.
Additional observations at CS3-PDS in 2014 late October and early November, at a phase angle of only 7°, firmly established the longer period as seen in the second period spectrum. It’s interesting to note that the shape of bimodal lightcurve, with the incorrect period, resembles the shape of the lightcurve obtained at lower phase angles and with the longer period.


3200 Phaethon.
Most results found in the LCDB have a period of about 3.6 h, the same that was found using CS3-PDS data from 2014 November and December.

4183 Cuno.
An extensive data set from 2000 (Pravec et al, 2000) found a period of 3.559 h with slight variations in the period and significant changes in the amplitude over almost 6 weeks.


The period spectrum based on the CS3-PDS data from 2014 October showed two nearly equal solutions. The “split halves” plot (see Harris et al., 2014, for a discussion) shows that the lightcurve is nearly symmetrical over the two halves of the longer period, making the half-period a possibility. Usually an amplitude of more than 0.4 mag favors a bimodal solution. At the given the phase angle, that rule doesn’t always hold but, in this case, the short period monomodal lightcurve is considered correct.
(12538) 1998 OH.
This asteroid also showed a period spectrum that favored two solutions. There is just enough asymmetry in the split halves plot such to adopt the longer period as the more likely choice but the shorter period cannot be formally excluded.


(36017) 1999 ND43.
Pravec et al. (1999) found a period of 11.4 h for this NEA. However, it has a rating of U = 1 in the LCDB, making it “likely wrong.” The data from 2014 December lead to a more likely period of 5.79 h, but it is not definitive.

(53430) 1999 TY16.
Ye (2009) found a period of 9.582 h and Skiff (2012) found 9.58 h. The period of 9.60 h reported here is in good agreement with those earlier results.

(85713) 1998 SS49.
This NEA was observed by the author in 2014 September (Warner, 2015). At that time, the solution was ambiguous, being 5.370 h or 2.686 h. The additional data from November did not fully resolve the ambiguity, mostly due to the low amplitude (0.06 mag). Even so, the asymmetry in the lightcurve tends to favor the longer period.

(85804) 1998 WQ5.
Oey (2006) found a period of 3.0089. Using data obtained about two months earlier, Higgins (2011) found a period of 3.71 h. The period spectrum from the CS3-PDS 2014 December data is not much help. The “preferred” lightcurve is forced to the favored period of 6.028 h. The “alternate” lightcurve was forced a period near the one found by Oey.


(86326) 1999 WK13.
There were no previous results in the LCDB for 1999 WK13. The period spectrum showed several periods of nearly equal strength. Given the large phase angle and low amplitude, it is not possible to exclude a monomodal solution of 3.18 ± 0.01 h and amplitude 0.10 mag.

(90075) 2002 VU94.
This NEA was first observed by the author in 2014 August (Warner, 2015). The period was 7.88 h and amplitude 0.63 mag at phase angle (α) 40°. Observations about two months later found P = 7.90 h and amplitude of 0.31 mag. Since the amplitude of a lightcurve decreases with phase angle, the smaller amplitude at α = 4 ° is expected.

(100756) 1998 FM5.
Previous results include Krugly et al. (2002a, 6.364 h, A = 1.14 mag) and Pravec et al. (1998; 6.35 h, A = 1.0 mag). The period found here is in good agreement. The amplitude, A = 0.80 mag, is significantly lower, probably because the data were obtained at much lower phase angles than in the other two cases.

(103067) 1999 XA143.
Galad et al. (2005) found a period of 9.8490 h for 1999 XA143. The period found using CS3-PDS data is in near perfect agreement. The amplitudes from the two data sets were the same, which is not unexpected since the viewing aspects were also nearly identical.

(136897) 1998 HJ41.
The period of 15.30 h is close to being commensurate with an Earth day (3:2). The period spectrum strongly favored the period, but it is adopted with some caution.

(137032) 1998 UO1.
A definitive period for this asteroid has been elusive over the years. Wolters et al. (2008) found 3.0 h; Skiff (2012) found 4.42 h; and Pravec et al. (2014a) found 2.916 h. The period spectrum from CS3-PDS data in 2014 October-November shows several possibilities. A period of 2.925 h is adopted here but one of 3.934 h cannot be formally excluded given the high phase angle and low amplitude.


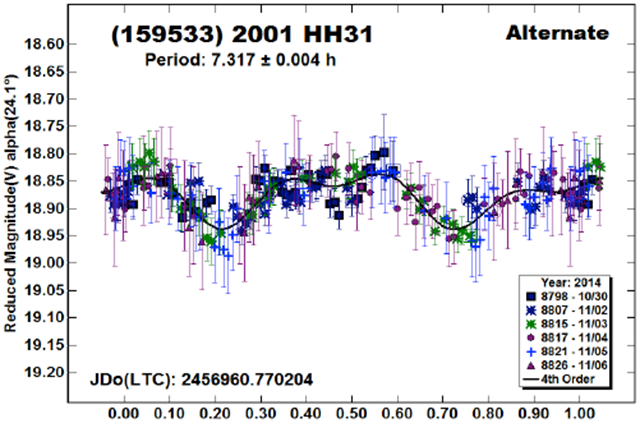
(159533) 2001 HH31.
A period is 3.660 h is adopted here but the double period of 7.318 h cannot be formally excluded.

(162004) 1991 VE.
Pravec et al. (2012) reported this to be a tumbling asteroid with periods of 13.4802 h and 17.316 h. The CS3-PDS data from 2014 December lead to a period of 13.52 h but did not show obvious signs of tumbling.

(163818) 2003 RX7.
Torppa et al. (2005) reported a period of 2.6 h (U = 1 in the LCDB). The period of 5.649 h reported here is considered secure.

(175114) 2004 QQ.
There were no previous entries in the LCDB for 2004 QQ.

(209924) 2005 WS55.
This is a case where two distinct solutions were found using data sets obtained only two months apart. If the two differed by 0.5 rotations per Earth day, this could be attributed to a rotational alias, i.e., a miscount of the number of rotations over the span of the observations. That was not the case here.
The period spectrum using data from 2014 November only does not show a clear-cut solution. The lightcurve is forced to the best fit period of 3.378 h.


On the other hand, the period spectrum based on data from 2014 December shows a sharply defined solution with a period of 2.726 h. The two are close to a 5:4 ratio. Given that both data sets had at least three back-to-back nights and the runs on each night were longer than either period, a rotational alias seems unlikely.
Both solutions cannot be right. The best conclusion is that the lower amplitude lightcurve leads to an ambiguous set of solutions and that the period favored by the period spectrum is spurious. The shorter period of 2.726 h is adopted for this paper.


(214088) 2004 JN13.
Pravec et al. (2014a) reported P = 6.342 h, A = 0.40 mag from data in early 2014 Nov. The CS3-PDS data from late 2014 November lead to P = 6.33 h, A = 0.20 mag while those from mid-December produced P = 6.336 h, A = 0.17 mag. The decrease in amplitude followed the decrease in phase angle over the apparition, i.e., from 100° down to 8°.


(374158) 2004 UL.
Data for this NEA were obtained from 2014 Oct 28 through Nov 3. No single period could be found to fit the data, even when manipulating zero points far more than the usual tolerances. This strongly suggests that the asteroid is “tumbling” (see Pravec et al., 2005, 2014b). The lightcurve shows the data forced to fit the most dominant period found by MPO Canopus, which is not designed to use the complex algorithms required to handle tumbling asteroids. Using a rule of thumb from Pravec et al. (2014b), the damping time for tumbling for this asteroid is about 1 Gyr.

(410195) 2007 RT147.
There were no previous entries in the LCDB for this asteroid. The period appears to be nearly commensurate with an Earth day, making it very difficult to complete the lightcurve from a single station. Furthermore, there are indications (the mismatch at 0.5 rotation phase) of tumbling. The rule of thumb damping time for the asteroid exceeds the age of the Solar System. More important is that the collisional lifetime is much less, and so tumbling is even more likely.

(413038) 2001 MF1.
Previous results for 2001 MF1 include Krugly et al. (2002b, 6.572 h), Pravec et al. (2001, 6.569 h), and Warner (2015, 6.568 h). The Warner observations were in 2014 July and showed an amplitude of 1.22 mag at α = 51°. The December data, at α = 11°, have amplitude of 0.64 mag and more equal minimums in the lightcurve.

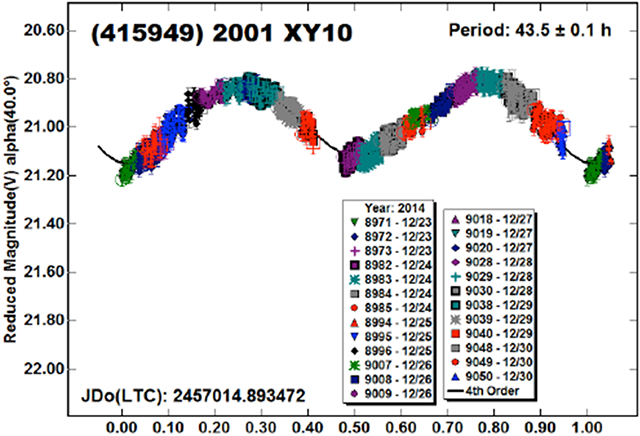
(415949) 2001 XY10.
There were no previous entries in the LCDB for (415949) 2001 XY10. The size and period both favor the possibility of tumbling but there were no indications of such although it’s possible that a more extensive data set, one covering more than one cycle, would prove otherwise.
(416224) 2002 XM90.
This appears to be the first reported lightcurve for (416224) 2002 XM90.

2005 SX4.
The period spectrum based on data from 2014 October shows several solutions that are related to one another as being P and 2*P. The two favored solutions were about 10 h or 20 h. Using the split halves plot for the longer period shows a marked asymmetry between the two halves, making the half-period unlikely, despite the good fit seen in the lightcurve forced to the shorter solution. A period of 21.64 h is adopted for this paper but the period of 10.88 h cannot be formally excluded.


2007 TG25.
No previous results were found in the literature.

(418797) 2008 VF, 2010 MR.
There were no previous entries in the LCDB for these two asteroids.


2014 TV.
Initial observations in 2014 October used exposures of 2 minutes and showed what appeared to be a period of about 44 hours. Radar observations (Patrick Taylor, private communications) showed the period was likely between 30 and 90 seconds. If so, the long exposures would lead to rotational smearing and the results would be meaningless (see Pravec et al, 2000b). Ten seconds were used for the run on October 16.

The period spectrum covering 0.001 to 0.05 hours (3.6 to 180 seconds) shows several possibilities, the most likely being 0.02190 h (78.8 sec). The corresponding lightcurve has a complex quadramodal shape. The split halves plot confirms the strong asymmetry of that solution, making the half-period (~39 sec) less likely. However, the shorter period cannot be formally excluded, especially if considering the possibility of rotational smearing.


2014 UR.
The period of 2.37 h shown here is just one of several possibilities. It should be considered doubtful, at best.

2014 VM, 2014 VQ.
There were no previous entries in the LCDB for 2014 VM and 2014 VQ.


2014 VH2.
Assuming the period of 38.9 h is correct, it is much greater than the rule of thumb for a damping time equal to the age of the Solar System (see Pravec et al., 2005, 2014b). However, the collisional lifetime is much less, so tumbling may be possible. It’s possible that the asymmetry in the lightcurve is due to low-level tumbling. A more extensive data set from multiple longitudes and with less scatter would be required to confirm whether or not the asteroid tumbling.

2014 RL12, 2014 RQ17. 2014 TL17, 2014 TX57.
There were no previous entries in the LCDB for these four asteroids. Radar observations were made of 2014 RQ17. The results from those observations are pending. The incomplete coverage of the lightcurve for 2014 TL17 makes the solution somewhat uncertain. This is another case where the long period would suggest the possibility of tumbling.


2014 SM143.
The photometry data for this radar target were noisy. Partly because of this, the period spectrum showed a number of solutions that were marginally below the average flat line. The period of 2.910 h is adopted for this paper on the presumption of a bimodal lightcurve. Given the low amplitude and high phase angle, this may not be valid, but a half-period of 1.45 h for an asteroid with an estimated size of 260 meters would make it an extraordinary object.

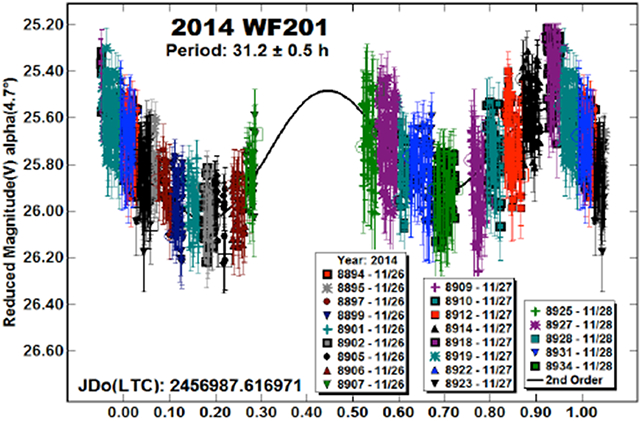
2014 WF201.
The estimated size of this object is about 20 meters, making it possible that the rotation period was << 1 hour, possibly on the order of minutes if not seconds. For this reason and its rapid sky motion, exposures were kept to 30 seconds. While the solution of 31.2 h seems valid, there is some doubt since about 90% of objects in this size range have very short periods, which makes this an unusual asteroid.
2014 SQ261.
There were no previous entries in the LCDB for this asteroid.

2014 SC324.
This is a confirmed tumbler (Petr Pravec, private communications). The lightcurve shows the dominant period. The second period is ambiguous, the most likely one being 0.6003 ± 0.0002 h (Pravec, private communications). The ratio of the amplitudes of the second order harmonics for the two periods is only 0.21, indicating low-amplitude tumbling as seen as slight mismatches over the span of the lightcurve.

Table II.
Observing circumstances.
| Number | Name | 2014 mm/dd | Pts | Phase | LPAB | BPAB | Period | P.E. | Amp | A.E. | Grp |
|---|---|---|---|---|---|---|---|---|---|---|---|
| 2340 | Hathor | 10/21-10/22 | 353 | 63.0,54.2 | 60 | 1 | 3.358A | 0.002 | 0.18 | 0.02 | NEA |
| 2340 | Hathor | 10/30-11/03 | 598 | 7.4,13.5 | 36 | −5 | 3.35 | 0.002 | 0.11 | 0.02 | NEA |
|
| |||||||||||
| 3200 | Phaethon | 11/27-12/15 | 469 | 9.3,21.5 | 62 | 12 | 3.6039 | 0.0002 | 0.12 | 0.01 | NEA |
| 4183 | Cuno | 10/01-10/10 | 218 | 37.7,39.6 | 77 | 7 | 3.558A | 0.002 | 0.53 | 0.03 | NEA |
| 12538 | 1998 OH | 10/22-10/25 | 176 | 5.1,3.8 | 33 | 6 | 5.833A | 0.005 | 0.12 | 0.02 | NEA |
| 36017 | 1999 ND43 | 12/19-12/25 | 122 | 40.8,39.5 | 64 | 15 | 5.79 | 0.02 | 0.28 | 0.02 | NEA |
| 53430 | 1999 TY16 | 12/19-12/25 | 185 | 49.6,49.7 | 35 | 6 | 9.6 | 0.01 | 0.53 | 0.03 | NEA |
| 85713 | 1998 SS49 | 11/20-11/24 | 368 | 86.4,96.8 | 115 | 23 | 5.66A | 0.01 | 0.06 | 0.01 | NEA |
| 85804 | 1998 WQ5 | 12/20-12/24 | 909 | 19.9,17.1 | 111 | 4 | 6.028A | 0.005 | 0.05 | 0.01 | NEA |
| 86326 | 1999 WK13 | 12/19-12/24 | 194 | 42.7,42.6 | 52 | −8 | 6.36A | 0.02 | 0.14 | 0.02 | NEA |
| 90075 | 2002 VU94 | 10/13-10/14 | 151 | 4.2,4.3 | 18 | 6 | 7.9 | 0.01 | 0.31 | 0.02 | NEA |
| 100756 | 1998 FM5 | 10/13-10/14 | 181 | 5.3,5.4 | 21 | −7 | 6.369 | 0.005 | 0.8 | 0.03 | NEA |
| 103067 | 1999 XA143 | 01/02-01/04 | 265 | 23.0,21.7 | 126 | −3 | 9.85 | 0.01 | 0.49 | 0.03 | NEA |
| 136897 | 1998 HJ41 | 10/28-10/30 | 214 | 36.8,37.0 | 8 | 14 | 15.3 | 0.05 | 0.54 | 0.03 | NEA |
|
| |||||||||||
| 137032 | 1998 UO1 | 10/24-10/27 | 165 | 58.5,54.6 | 346 | 15 | 2.935A | 0.003 | 0.1 | 0.01 | NEA |
| 137032 | 1998 UO1 | 10/24-11/13 | 230 | 58.5,43.0 | 300 | 16 | 2.943 | 0.001 | 0.08 | 0.01 | NEA |
|
| |||||||||||
| 159533 | 2001 HH31 | 10/30-11/06 | 214 | 24.1,17.8 | 49 | −15 | 3.66A | 0.002 | 0.11 | 0.01 | NEA |
| 162004 | 1991 VE | 12/25-12/28 | 255 | 41.8,42.2 | 124 | 14 | 13.52 | 0.01 | 1.11 | 0.03 | NEA |
| 163818 | 2003 RX7 | 10/21-10/27 | 219 | 62.3,70.5 | 72 | 15 | 5.649 | 0.004 | 0.11 | 0.02 | NEA |
| 175114 | 2004 QQ | 10/12-10/20 | 302 | 74.5,57.6 | 67 | 17 | 8.879 | 0.003 | 0.11 | 0.01 | NEA |
|
| |||||||||||
| 209924 | 2005 WS55 | 10/28-11/04 | 157 | 46.2,47.5 | 89 | 24 | 3.37 8A | 0.003 | 0.11 | 0.02 | NEA |
| 209924 | 2005 WS55 | 12/23-12/26 | 178 | 57.7,58.3 | 139 | −7 | 2.726 | 0.001 | 0.25 | 0.02 | NEA |
|
| |||||||||||
| 214088 | 2004 JN13 | 11/29-11/29 | 335 | 0.0,0.0 | 0 | 0 | 6.33 | 0.01 | 0.17 | 0.02 | NEA |
| 214088 | 2004 JN13 | 12/14-12/15 | 756 | 7.9,7.9 | 78 | −5 | 6.336 | 0.005 | 0.20 | 0.02 | NEA |
|
| |||||||||||
| 374158 | 2004 UL | 10/28-11/03 | 421 | 15.2,30.8 | 22 | −9 | 38 | 2 | 1.2 | 0.1 | NEA |
| 410195 | 2007 RT147 | 10/23-11/13 | 385 | 10.3,9.4,14.4 | 37 | −8 | 48.05 | 0.05 | 1.08 | 0.05 | NEA |
| 413038 | 2001 MF1 | 12/19-12/24 | 198 | 12.3,9.5 | 94 | 13 | 6.56 | 0.002 | 0.64 | 0.03 | NEA |
| 415949 | 2001 XY10 | 12/23-12/30 | 1155 | 40.0,31.2 | 110 | 14 | 43.5 | 0.1 | 0.35 | 0.03 | NEA |
| 416224 | 2002 XM90 | 12/25-12/27 | 288 | 27.4,27.8 | 111 | 17 | 7.666 | 0.005 | 1.02 | 0.03 | NEA |
| 418797 | 2008 VF | 11/22-11/24 | 274 | 13.4,17.6 | 51 | −5 | 7.35 | 0.02 | 0.11 | 0.02 | NEA |
| 2005 SX4 | 10/21-10/29 | 222 | 8.9,11.4 | 32 | −7 | 21.64A | 0.05 | 0.25 | 0.03 | NEA | |
| 2007 TG25 | 10/01-10/06 | 255 | 9.2,5.4 | 16 | −4 | 11.076 | 0.005 | 0.78 | 0.05 | NEA | |
| 2010 MR | 10/11-10/20 | 218 | 48.2,46.6 | 347 | 9 | 2.4645 | 0.0005 | 0.22 | 0.03 | NEA | |
| 2014 TV | 10/16-10/16 | 80 | 25.5,25.5 | 30 | −11 | 0.02190A | 0.00002 | 0.32 | 0.03 | NEA | |
| 2014 UR | 10/19-10/19 | 792 | 6.7,6.7 | 24 | 3 | 2.37 | 0.02 | 0.13 | 0.05 | NEA | |
| 2014 VM | 11/24-11/25 | 210 | 29.4,28.6 | 87 | −3 | 10.86 | 0.05 | 0.13 | 0.02 | NEA | |
| 2014 VQ | 12/31-12/31 | 276 | 29.4,28.6 | 0 | 0 | 0.11603 | 0.00005 | 0.62 | 0.04 | NEA | |
| 2014 VH2 | 11/24-11/29 | 434 | 6.6,9.7 | 60 | 1 | 38.9 | 0.5 | 0.31 | 0.04 | NEA | |
| 2014 RL12 | 12/23-12/26 | 251 | 29.7,25.0 | 113 | −2 | 5.206 | 0.005 | 0.08 | 0.01 | NEA | |
| 2014 RQ17 | 10/12-10/13 | 154 | 61.7,63.6 | 348 | 14 | 0.5216 | 0.0001 | 0.99 | 0.05 | NEA | |
| 2014 TL17 | 10/17-10/21 | 339 | 29.0,36.5 | 10 | 11 | 39 | 3 | 0.53 | 0.05 | NEA | |
| 2014 TX57 | 11/16-11/20 | 202 | 14.9,15.2 | 47 | 1 | 5.421 | 0.003 | 0.12 | 0.02 | NEA | |
| 2014 WZ120 | 11/25-11/29 | 977 | 0.0,36.2 | 39 | 4 | 3.363 | 0.002 | 0.06 | 0.01 | NEA | |
| 2014 SM143 | 10/16-10/20 | 15 | 62.8,98.4 | 62 | −15 | 2.91 | 0.005 | 0.09 | 0.02 | NEA | |
| 2014 WF201 | 11/26-11/28 | 1151 | 0.0,17.6 | 42 | 5 | 16.9 | 0.5 | 0.45 | 0.1 | NEA | |
| 2014 SQ261 | 10/16-10/20 | 122 | 11.0,7.8 | 33 | −3 | 9.256 | 0.005 | 0.57 | 0.03 | NEA | |
| 2014 SC324 | 10/21-10/23 | 856 | 18.7,7.3 | 22 | 2 | 0.36156D | 0.00002 | 0.69 | 0.03 | NEA | |
preferred period for an ambiguous solution.
dominant period of a tumbling asteroid. Pts is the number of data points used in the analysis. The phase angle (±) is given at the start and end of each date range, unless it reached a minimum, which is then the second of three values. If a single value is given, the phase angle did not change significantly and the average value is given. LPAB and BPAB are, respectively the average phase angle bisector longitude and latitude, unless two values are given (first/last date in range). Grp is the orbital group of the asteroid. See Warner et al. (LCDB; 2009).
Acknowledgements
Funding for PDS observations, analysis, and publication was provided by NASA grant NNX13AP56G. Work on the asteroid lightcurve database (LCDB) was also funded in part by National Science Foundation Grant AST-1210099.
This research was made possible through the use of the AAVSO Photometric All-Sky Survey (APASS), funded by the Robert Martin Ayers Sciences Fund.
References
- Galád A; Pravec P; Kušnirák P; Gajdoš Š; Kornoš L; Világi J (2005). “Joint Lightcurve Observations of 10 Near-Earth Asteroids from Modra and ONDŘEJOV.” Earth, Moon, and Planets 97, 147–163. [Google Scholar]
- Harris AW, Young JW, Bowell E, Martin LJ, Millis RL, Poutanen M, Scaltriti F, Zappala V, Schober HJ, Debehogne H, Zeigler KW (1989). “Photoelectric Observations of Asteroids 3, 24, 60, 261, and 863.” Icarus 77, 171–186. [Google Scholar]
- Harris AW, Pravec P, Galad A, Skiff BA, Warner BD, Vilagi J, Gajdos S, Carbognani A, Hornoch K, Kusnirak P, Cooney WR, Gross J, Terrell D, Higgins D, Bowell E, Koehn BW (2014). “On the maximum amplitude of harmonics on an asteroid lightcurve.” Icarus 235, 55–59. [Google Scholar]
- Henden AA, Terrell D, Levine SE, Templeton M, Smith TC, Welch DL (2009). http://www.aavso.org/apass
- Higgins DJ (2011). http://www.david-higgins.com/Astronomy/asteroid/lightcurves.htm
- Krugly Yu.N., Belskaya IN, Shevchenko VG, Chiorny VG, Velichko FP, Mottola S, Erikson A, Hahn G, Nathues A, Neukum G, Gaftonyuk NM, Dotto E (2002a). “The Near-Earth Objects Follow-up Program. IV. CCD Photometry in 1996-1999.” Icarus 158, 294–304. [Google Scholar]
- Krugly Yu.N., Belskaya IN, Chiorny VG, Shevchenko VG, Gaflonyuk NM (2002b). “CCD photometry of near-Earth asteroids in 2001.” In: Proceedings ACM 2002, ESA SP 500, 903–906. [Google Scholar]
- Oey J (2006). “Lightcurves analysis of 10 asteroids from Leura Observatory.” Minor Planet Bul. 33, 96–99. [Google Scholar]
- Pravec P, Wolf M, Sarounova L (1998, 1999, 2000a, 2001, 2012, 2014a). http://www.asu.cas.cz/~ppravec/neo.htm
- Pravec P, Hergenrother C, Whiteley R, Sarounova L, Kusnirak P (2000b). “Fast Rotating Asteroids 1999 TY2, 1999 SF10, and 1998 WB2.” Icarus 147, 477–486. [Google Scholar]
- Pravec P, Harris AW, Scheirich P, Kušnirák P, Šarounová L, Hergenrother CW, Mottola S, Hicks MD, Masi G, Krugly Yu. N., Shevchenko VG, Nolan MC, Howell ES, Kaasalainen M, Galad A, Brown P, Degraff DR, Lambert JV, Cooney WR., Foglia S (2005). “Tumbling asteroids.” Icarus 173, 108–131. [Google Scholar]
- Pravec P, Scheirich P, Durech J, Pollock J, Kusnirak P, Hornoch K, Galad A, Vokrouhlicky D, Harris AW, Jehin E, Manfroid J, Opitom C, Gillon M, Colas F, Oey J, Vrastil J, Reichart D, Ivarsen K, Haislip J, LaCluyze A (2014b). “The tumbling state of (99942) Apophis.” Icarus 233, 48–60. [Google Scholar]
- Skiff BA, Bowell E, Koehn BW, Sanborn JJ, McLelland KP, Warner BD (2012). “Lowell Observatory Near-Earth Asteroid Photometric Survey (NEAPS) - 2008 May through 2008 December.” Minor Planet Bul. 39, 111–130. [Google Scholar]
- Torppa J, Aksnes K, Dai Z, Grav T, Hahn G, Laakso T, Lagerkvist C-I, Muinonen K, Niemelaa J, Naaraanen J, Rickman H, Virtanen J (2005). “Spins and Shapes of Potentially Hazardous Asteroids.” Bul. Amer. Astron. Soc 37, 643. [Google Scholar]
- Warner BD (2007). “Initial Results of a Dedicated H-G Program.” Minor Planet Bul. 34, 113–119. [Google Scholar]
- Warner BD, Harris AW, Pravec P (2009). “The Asteroid Lightcurve Database.” Icarus 202, 134–146. [Google Scholar]
- Warner BD (2015). “Near-Earth Asteroid Lightcurve Analysis at CS3-Palmer Divide Station: 2014 June-October.” Minor Planet Bul. 42, 41–53. [PMC free article] [PubMed] [Google Scholar]
- Wolters SD, Green SF, McBride N, Davies JK (2008). “Thermal infrared and optical observations of four near-Earth asteroids.” Icarus 193, 535–552. [Google Scholar]
- Ye Q, Shi L, Lin H-C (2009). “CCD Lightcurve Analysis of (53430) 1999 TY16.” Minor Planet Bul. 36, 126. [Google Scholar]