

Abstract
Artisanal and small-scale gold mining (ASGM) is a significant contributor of mercury (Hg) contamination and deforestation across the globe. In the Colorado River watershed in Madre de Dios, Peru, mining and deforestation have increased exponentially since the 1980s, resulting in major socioeconomic shifts in the region and a national state of emergency in response to concerns for wide-scale mercury poisoning by these activities. This research employed a watershed-scale soil particle detachment model and environmental field sampling to estimate the role of land cover change and soil erosion on river transport of Hg in a heavily ASGM-impacted watershed. The model estimated that observed decreases in forest cover increased soil mobilization by a factor of two in the Colorado River watershed during the 18-year period and by four-fold in the Puquiri subwatershed (the area of most concentrated ASGM activity). If deforestation continues at its current exponential rate through 2030, the annual mobilization of soil and Hg may increase by an additional 20–25% relative to 2014 levels. While, the estimated total mass of Hg transported by rivers is substantially less than the estimated tons of Hg used with ASGM in Peru, this research shows that deforestation associated with ASGM is an additional mechanism for mobilizing naturally-occurring and anthropogenic Hg from terrestrial landscapes to aquatic environments in the region, potentially leading to bioaccumulation in fish and exposure to communities downstream.
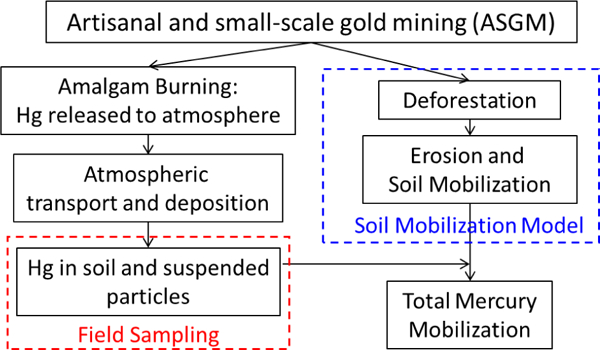
Graphical Abstract
Introduction
Artisanal and small-scale gold mining (ASGM) is one of the largest anthropogenic sources of mercury (Hg) to the atmosphere and contributes to substantial deforestation globally.1 During the ASGM process, elemental Hg is often added to excavated soil or sediment to amalgamate and separate out the gold. Recovery of the mercury is often incomplete, resulting in large amounts released to the environment and deposited to local soils and waterways. In Peru’s Region of Madre de Dios (MDD), ASGM has increased dramatically since the 1980s, leading to political distress, human health concerns, and environmental degradation from deforestation.2, 3 Previous work in the region has documented substantial human health impacts in the region that include risks of occupational Hg exposure to individuals in ASGM areas and dietary Hg exposure through fish consumption, even hundreds of kilometers downstream where mining is not conducted.2, 4–7 We previously observed accumulation of Hg in commonly eaten fish species to levels that exceeded health guidelines, indicating a risk for communities depending on fish from the river for sustenance.5, 6 Because of these risks, the Peruvian government has recently implemented drastic policies to control mining and Hg exposure in the region.8 Many other regions in Latin America, Africa, and Asia are also hosts to similar types of ASGM activities, with varying degrees of political unrest and impacts on surrounding landscapes and communities.9, 10 With the implementation of the Minamata Convention on Mercury, signatory countries will need to work towards reducing Hg use and develop strategies for preventing Hg exposure to vulnerable communities.11
While the impact of ASGM activity on human health is well established, there is more uncertainty on the environmental fate of Hg released from ASGM. The release of Hg from ASGM sites to downstream rivers varies between amalgamation methods, spatial extent (i.e., local, watershed, or country scale), and location of mining activities. Several studies have shown that total Hg concentrations in water increased in areas immediately adjacent to mining areas due to intentional or inadvertent waste disposal.12, 13 However, at locations further downstream from mining sites (e.g., watershed and country scale), Hg contents in water and sediment are only modestly elevated (and sometimes not significantly different) from areas upstream of mining or designated for conservation.14–16 Moreover, total Hg concentrations in surface waters downstream of ASGM are strongly associated with suspended particle concentrations.17, 18 For example in Guyana, high suspended solids loadings and thick layers of deposited sediment have been observed downstream of ASGM activity. However, many factors can influence suspended solid concentrations, including geology, soil composition, and hydrologic regimes.17
Our previous study in MDD revealed increased total Hg contents in river sediments and in fish downstream of ASGM activity.5 However, Hg concentrations in the river sediments were surprisingly low given the large number of ASGM mines located throughout the watershed. (Hg concentrations in river sediments were 0.023 mg kg−1 downstream of the major mining areas and 2.5-times greater than river locations upstream of mining.) Particulate Hg concentrations in the water column depended strongly on the concentration of suspended particles, which showed a strong correlation with the Hg content of the suspended particles. In addition, recent studies in rivers of the Amazon Basin suggest that Hg levels in sediment downstream of ASGM are a result of soil erosion and runoff rather than Hg released directly from ASGM processing.16, 19 With these results combined with observations of only moderately elevated Hg in the MDD River and tributaries, one might presume that Hg levels in the river are caused by natural particle transport processes rather than anthropogenic contamination.16, 20 This view might be an oversimplification of ASGM-impacted watersheds because it does not include the well documented impact of deforestation on erosion, soil and Hg mobilization, and trace metal transport in the region.21–23
In MDD, ASGM has been a driver of deforestation, leading to nearly 500 square kilometers of forest loss between 1999 and 2012.3, 24 However, the relationship between deforestation from ASGM and downstream Hg concentrations has yet to be explored directly in watersheds impacted by ASGM, including in MDD. This study examines the hypothesis that deforestation from ASGM leads to increased soil mobility, sediment loading, and Hg transport across the watershed and to downstream communities.
In order to better understand mobilization of Hg, we applied a watershed-scale soil erosion and transport model, developed by Pelletier (2012), based on soil grain size distribution, land cover, and regional precipitation, among other parameters, to compare particle mobilization across subcatchments in the watershed.25 The analysis was combined with river water quality measurements, including particulate and dissolved (<0.45 μm) Hg and other trace metal and other elements of concern (As, Pb, Cu, and Fe) concentrations in surface water, taken over three field campaigns in 2015–2016. These additional elements were included because they pose public health risks and are affected by particulate transport. We also examined trace metals and volatile organic carbon concentrations in groundwater due to concerns for natural gas deposits in the region. The overarching goal was to examine relative Hg loadings from subcatchments with and without active mining and establish relationships with forested land cover. This model was then used to test scenarios and understand, in a spatially-explicit context, the implications of future deforestation for Hg loadings in the watershed.
Methods
Study Site
The Colorado River is a major tributary to the MDD River and its watershed hosts much of the known ASGM activity for the region, particularly in the Huepetuhe mining area (Figure 1). The Colorado River receives inputs from first and second order streams that form at the headwaters of the Amazon Basin. These include the Upper Colorado, Cupodne, Huasoroco, and Puquiri Rivers. Watershed boundaries shown in Figure 1 were established by the watershed delineation tool in ArcGIS 10.3 (Esri, Redlands, CA) with digital elevation maps obtained from the U.S. Geological Survey Earth Explorer database (https://earthexplorer.usgs.gov).
Figure 1.

The Colorado River Watershed and sub-watersheds in the Department of Madre de Dios, Peru, in which the direction of water flow is generally north- and eastward. Surface water (SW) sampling locations (red circles) at the outlet of each watershed and several mid watershed points. Ground water (GW) samples (yellow circles) were taken in two communities, Puerto Luz (GW 1–5) and Delta-1 (GW 6–8). The Huepetuhe and Delta-1 mining areas are shaded yellow. The Huasoroco River outlet drains the Cupodne, Upper Colorado, and Huasoroco watersheds. The Middle Colorado River Outlet drains the Upper Colorado River, Cupodne, Huasoroco, and Middle Colorado River watersheds. The Puquiri River Outlet drains the Puquiri Watershed. The Lower Colorado River Outlet (Pour Point, SW9) drains the entire Colorado River Watershed, including the Puquiri Watershed. Base map sources: Esri, DigitalGlobe, GeoEye, i-cubed, USDA FSA, USGS, AEX, Getmapping, Aerogrid, IGN, IGP, swisstopo, and the GIS User Community.
The Huepetuhe mine is one of the largest mining areas in the region and is located along the upstream section of the Puquiri River. The size of this area has remained relatively constant since 1999, while deforestation from mining near Delta-1 (located further downstream on the Puquiri River) has increased during this time.24 MDD is largely Amazon lowland rainforest. Thus, areas of mining on the Colorado River and Puquiri Rivers can be detected through satellite imagery. Prevailing winds in Madre de Dios are reported to originate from the northwest, which is relevant for atmospheric Hg emissions from ASGM activities.26
Field Sampling Methods
Field sampling was conducted in February 2015 for river surface water at 9 locations and for groundwater at 8 locations sites, as shown in Figure 1. During April and June 2016, additional samples were collected again at surface water site locations SW7, SW8, and SW9. The surface water sites were identified based on their location at a river confluence for a subcatchment to the watershed. During each sampling event, surface water was collected in triplicate at mid-channel at each site. Groundwater samples at sites GW1 to GW5 were ground-to-surface seepages at the town of Puerto Luz. Sites GW6 to GW8 were drinking water wells of approximately 4 – 5 meters depth in the town of Delta-1. Altogether, the field sampling yielded 42 surface water samples and 24 groundwater samples (one site was dry during the time of sampling).
All surface and ground water samples included whole unfiltered samples and aliquots that were filtered onsite (0.45 μm) and stored in fluoropolymer-lined bottles. Aliquots were also filtered through a 0.45-μm glass fiber membrane that was saved for later analysis of total suspended solids (TSS). All water and filter samples were frozen until transport to the laboratory at Duke University for preservation and analysis (typically <3 weeks after collection). Additional details of collection methods are described in the Supporting Information (SI) Section 1.
Natural gas exploration was under way upstream of our study region during our initial sampling. Thus, additional ground water samples were collected in 40 mL precombusted glass vials and stored at 4 °C prior to analysis within three weeks after collection for analysis of volatile organic compounds (VOCs).
Chemical Analyses
Analysis of water samples included Hg concentration by cold vapor atomic fluorescence spectrometry. Recoveries of a matrix-matched spiked reference were 97% ± 6% (n=16) of the spike value. Other major and trace elements (Na, K, Ca, Mg, Mn, Fe, Cu, As, Pb) were analyzed by inductively coupled plasma mass spectrometry (ICP-MS), with average recoveries from the matrix spikes for each element between 92 and 118% (n=13 for each element). Major anions (Cl−, SO42−, NO3−) were analyzed by ion chromatography with recoveries of calibration check standards between 100 and 103% (n=4 for each element). More information on analysis recovery and detection limits can be found in SI Section 1 (Table S1.1). TSS was quantified by gravimetric analysis of dried filter samples. Filter blanks were analyzed and measured 2.6 ± 0.14 mg/L. To quantify potential presence of VOCs and other hydrocarbons common near natural gas deposits, analyses were performed by purge-and-trap gas chromatography flame ionization detector (FID). All chemical analysis methods are described in detail in SI Section 1 (Tables S1.2, S1.3, S1.4).
Soil Mobilization Model
We applied a soil detachment and transport model developed by Pelletier (2012) to the Colorado River watershed to estimate changes in soil yield from deforestation, and its potential variation, from each subwatershed.25 This model describes long-term soil yield from a watershed using relatively fine-scale spatial data on relevant soil detachment and discharge parameters.25 While this model does not describe all sources of soil mobilization in the watershed (e.g., in-stream erosion, direct mobilization through mining), it does describe how topography, local rainfall, and land cover can impact total soil mobilization. The total soil yield from a watershed is described as the result of soil detachment and subsequent soil transport. The total soil detachment rate (DT; kg m−2 y−1) is the sum of individual detachment rates (Dd) for each grain size class, i.e., d = sand, silt, or clay size fractions:
| (1) |
Individual detachment rates are expressed as a function of soil bulk density (ρb, kg m−3), mass fraction of grain size category (fd; sand, silt, or clay; unitless), topographic slope (S; unitless), annual precipitation, as determined by the sum of mean monthly precipitation (P; m), and mean monthly leaf area index (LAI; unitless), as described by the following:
| (2) |
where c1 is a dimensionless parameter representing local soil erosion rates from hillslopes within each pixel. Detachment rates in the Colorado River watershed were calculated for the years 1986, 1999, 2008, 2011, and 2014, identified based on the availability of clear satellite imagery for the study region. LAI from a single month was assumed to be representative for the entire period of simulation because LAI does not have a strong seasonal dependence in the tropics. Therefore, detachment was calculated on an annual basis.
Soil discharge is described by the Rouse number (R#), a ratio of the sediment fall velocity to upward velocity turbulent fluctuations, which determines whether the detached soil will remain in suspension and will be transported downstream. If R# is less than 1.2, the model assumes that soil particles are transported downstream. Conversely, for R# greater than 1.2, sediment remains in local storage. The value of R# is estimated for each grain size class (d), based on settling velocity (Ws) and slope (S):
| (3) |
where c2 is a parameter (s m−1) representing local flow conditions over long periods of time. Parameters c1 and c2 in eqs (2) and (3) were set to 0.15 and 300 s m−1, respectively. These values were obtained from the optimization of the model across 128 watersheds in Pelletier (2012).25
Soil bulk density (ρb) values in the Amazon region have been reported to range from approximately 740 to 1,580 kg m−3, with samples in the Peruvian Amazon at approximately 1,400 kg m−3.27–29 Because limited data exists for MDD, we used the Harmonized World Soil Database (HWSD) global average value of 1,500 kg m−3 for the soil bulk density (ρb), which was very similar to other values in the Amazon region.30, 31 According to the HWSD, the Colorado River watershed is comprised of three zones with distinct mixtures of the main grain size classes (i.e., sand, silt, and clay fractions) from which we assigned values of grain size fractions (fd) (Figure S1). For this analysis, soil bulk density was assumed to be relatively constant over the model period (1985 – 2030). The settling velocity (WS) was based on average settling velocity for the size class in previously calculated and experimental data of overland sediment flow with soil entrainment: WS = 7.1x10⁻² m s−1 for sand (> 50 µm diameter), WS = 1.5x10⁻² m s−1 for silt (2 – 50 µm ), and WS = 2.0x10⁻⁴ m s−1 for clay (0–2 µm).32 Slope (S) was determined using a 900 m2 resolution ASTER global Digital Elevation Map (DEM) downloaded from USGS Earth Explorer.
Mean monthly precipitation for the region was based on data collected between March 2012 and October 2013 from 11 precipitation gauges in MDD provided by the Peru’s Ministerio del Ambiente (MINAM) and an additional rain gage from the Tropical Ecology Assessment and Monitoring Network (Figure S2).33 Rain gauge observations were interpolated with ordinary Kriging using a stable semivariogram function with a constant trend.
Leaf area index (LAI) was calculated from Normalized Difference Vegetation Index (NDVI, Figure S3) values obtained from Landsat 5 data for each of the following years: 1986, 1999, 2008, and 2011. An additional image for 2014 was selected from Landsat 8. Anniversary dates were used when possible; however, due to the constant cloud cover in the region, the closest clear image with cloud cover less than 10% was used (12 July 1986, 2 September 1999, 8 September 2008, 3 September 2011, and 10 August 2014). See SI Section 2 for more information on mean monthly precipitation and remote sensing data analysis.
The uncertainties of the soil yield calculations were evaluated in multiple ways. First, to account for the inherent uncertainty in model output, the modeled soil detachment was multiplied by 0.39 and 3.3, corresponding to the interquartile range of estimation error in soil yield of the 128 watersheds examined by Pelletier.25 This range includes the spatial uncertainty in model input parameters. Second, temporal variations in rainfall data were considered through longer time records of precipitation data at Salvacion (2003–2008) and Pilcopata (1984 – 1989). Both of these communities are located near, but outside of the Colorado River study area. Finally, the Pelletier model soil yield output was compared to outputs of the Revised Universal Soil Loss Equation (RUSLE)34, an empirical model of rill and sheet erosion and typically applied to small catchments, land development, and other land planning applications. See SI Section 3 for details of these calculations and model comparison.
Calculation of mercury loadings
The flux of Hg (kg Hg km−2 y−1) from each subcatchment area was calculated using the soil detachment rate D (kg m−2 y−1) determined by the Pelletier model and the average TSS (mg/L) and total Hg (ng/L) measured in unfiltered surface water samples averaged across all samples (including 3 sampling events where available):
| (4) |
This calculation assumes that soil particles are the dominant source of Hg to the riverway, which is supported by the strong relationship between TSS and HgT throughout the watershed and in previous studies with HgT levels above 2 ng/L.5, 16 Soil Hg content was assumed to be constant across the three grain size classes. Hg in the soils at intensely mined upland sites were probably dissolving and desorbing from soil particles mobilized from this region; however we assumed that downstream at our sampling locations (all 25 km or greater from the closest mine), Hg dissolution and resorption of Hg between the river sampling sites was limited or generally at steady state. This assumption is based on previous ultrafiltration studies that observed relatively constant particulate-dissolved Hg distribution coefficients along multiple locations in the same river system.35–37 With these assumptions, we used the ratio of aqueous HgT/TSS to represent Hg content in the soil. Total Hg was selected because it was measured directly (rather than as the difference between total and dissolved Hg), and because, especially at higher concentrations (> 2 ng L−1), more than 90% of Hg was sorbed to particles. While there is likely to be some redistribution, this is negligible compared to the differences in total Hg concentrations among sites and changes in D.
Scenario Construction
Future unmanaged deforestation activities could have great implications for Hg loadings in the watershed. The importance of spatial distribution of deforestation was assessed by applying the soil erosion model with projected changes in land cover (see SI Section 4). The historical dependence (from 1986–2014) of deforested land cover (defined by LAI < 4) was fit to an exponential function: Deforested Area (km2) = 2×10−37 e0.045×t (t in years, R2 = 0.98, Figure S4.1). (In well forested areas of the Amazon basin, average LAI is 5.7).38 This function was used to project total deforested area to 2020 and 2030, where this total area was divided into 102, 103, or 104 new mines each with the size of 7.3, 0.073, and 7.3×10⁻⁴ km2, respectively. This value was selected because the majority of current and past mining areas in Peru is less than 0.05 km2 and more than 95% of ASGM areas are less than 0.5 km2, and artisanal mining areas are by definition less than 10 km2.39 The locations of the newly deforested mining areas were placed as random circles along either the Colorado River or Puquiri River, and were assigned LAI=2. Because mining is likely to emerge along accessible locations, newly deforested area was constrained to locations near waterways. Because mining concession might be able to control the location of new mines, we tested scenarios for location of new mines: (1) only in the Puquiri watershed, (2) along waterways in the Mid-Colorado watershed (and outside the Puquiri watershed), and (3) evenly dispersed in the Puquiri watershed and along Mid-Colorado waterways (Figure S4.2). These scenarios were compared to a baseline forest cover in 2014, assuming that forest rehabilitation in the ASGM-active areas is challenging, as has been shown in the Amazon.40, 41
Computational Analysis and Statistics
Geospatial modeling was performed in ArcGIS 10.3. All other statistical analyses were performed in Microsoft Excel. Error bars, unless otherwise noted, represent one standard deviation. The standard deviation of parameters derived from multiple inputs were calculated based on propagated standard deviation of input terms.
Results and Discussion
Field Measurements for Suspended Solids and Trace Metals
Total suspended solids (TSS) concentrations in the Puquiri River (SW8) and the outlet (or ‘Pour Point’) of the Colorado River (SW9) were significantly higher compared to the TSS concentrations in upstream sites (Figure 2a). The Puquiri River and Colorado River outlet also contained significantly higher Hg concentrations (15 – 50 ng/L) than the other sub watersheds (Figure 2b). At the outlets of these other sub watersheds (sites SW1 thru SW7), Hg concentrations in unfiltered water samples were between 0.9 to 2 ng/L and similar to Hg concentrations in filtered water samples (0.45 μm nominal pore size), suggesting that Hg was primarily in dissolved and colloidal forms at these locations. Other trace elements including Pb, As, and Cu also showed an increase in concentrations at sites with greater suspended solids (Figure 2c; Figure S6). Each of these trace elements (Hg, As, Pb, and Cu) can be associated with particles in freshwater,42 and river transport of these metal/metalloids can be reasonably expected to vary with sediment transport.
Figure 2.

Surface waters (SW) collected at major tributary confluences of the Colorado River (Co) watershed in February 2015, April 2016, and June 2016: (a) total suspended solids (TSS) and (b) total mercury (HgT). Samples for SW2 through SW5 were only collected during February 2015. NS designates ‘no sample’ collected and DS indicates a dry site. (c) Correlation between TSS and total Hg, As, Pb, and Cu, concentration for all sites over three seasons. Error bars indicate one standard deviation of triplicate samples collected from a single site and single event.
Seasonal differences were observed for the three sites where sampling was repeated throughout the field campaign (in February 2015, April and June 2016). The mid-Colorado River (SW7) was dry and had no water in the channel at the sampling location during the June sampling, which means that sediment transported from upstream will likely settle in this area for at least part of the year.
With our observed correlations between Hg concentration in unfiltered river water samples and TSS, we estimated the content of Hg in suspended solids by dividing the unfiltered Hg concentration by TSS. This approach appears justified at sites with relatively high TSS values (1150 and 840 mg/L at SW8 and SW9, respectively) and the filter-passing Hg was approximately 5% of the unfiltered Hg (Figure S1.1). In contrast at the other sites (SW1 to SW7), unfiltered and filter-passing Hg concentrations were similar at each site, indicating that our calculation neglects the soluble Hg fraction in the water column. However in freshwater locations, Hg in filtered freshwater samples can comprise large percentages (30 to 80%) of colloidal Hg phases (>10 kDa and <0.45 μm).35, 36, 43, 44 With these uncertainties in mind, we used this calculated Hg content in suspended solids mainly for comparison of Hg transport potential between sites.
The suspended solid Hg content values varied between 0.01 and 0.04 mg kg−1 for all sites in the first season and between 0.01 and 0.11 mg kg−1 overall (Figure S1.2). In our previous study in an adjacent region that included the Middle Colorado River and Puquiri River, we directly quantified the Hg contents in solids filtered from the samples and observed similar values (averaging 0.022 mg kg−1).5 Altogether, the Hg contents in suspended particles remained within one order of magnitude among samples.5 As, Pb, and Cu contents in the suspended particles varied slightly more throughout the watershed and between seasons, ranging from 0.8 to 11.6 mg kg−1, 0.3 to 14.1 mg kg−1, and 2.6 to 68.3 mg kg−1 respectively, but generally increased with increased TSS (Figure S1.2).
Overall, the results showed that TSS values spanned more than two orders of magnitude in concentration range while the trace element content per mass of solids remained within a narrower range of values, indicating that TSS was a major factor in trace element mobilization in the river and less driven by localized enrichment from ASGM or other direct releases. Because the mass of Hg per mass of suspended solids in the river water was similar throughout the Colorado River watershed, regardless of proximity to mining activity, and other trace metals exhibit similar associations in the study region, we conclude that soil particles eroding from upland landscapes is a major contributor to Hg mobilization.
Other measurements of major cations and ions in surface water were consistent with a previous compendium of surface water quality in the Amazon basin45 and did not reveal major differences between sampling sites (Figures S1.3 and S1.4). Hg concentrations in ground water samples were all less than 5 ng L−1, indicating that groundwater seepage was not a major source of Hg to the surface water in the downstream areas of the study region (Figure S1.5). Moreover, other analytes (As, Se, Pb, Cu, Cd, Hg, VOCs) in groundwater samples were at least 40 times lower than drinking water quality thresholds established by the World Health Organization (Figure S1.5–S1.8, Table S1.5), indicating that direct exposure via drinking water may not be major problem relative to dietary and occupational Hg exposures. One notable exception was the appearance of trans-1,2-dichloroethane in samples GW2, 3, and 4 well above the WHO’s recommended exposure limit of 50 μg/L (see Figure S1.8). While groundwater was not the focus of this research, to our knowledge, this is the first available trace element and VOC data for drinking water sources for these communities.
Calculated Sediment Flux Increased with Deforestation
The association of Hg with suspended particles could occur through several mechanisms: mobilization of Hg-bound soil particles from upland terrain, adsorption of Hg to suspended particles from dissolved forms, and resuspension of Hg-bound particles in the river channel. Given the strong relationship between particle loads and Hg concentration in the river surface waters, we applied a soil detachment and transport model as a means to more closely examine the impacts of deforestation and topography on particle mobilization in the watershed. While there are other drivers for soil mobilization and sources of suspended solids, this model allows us to examine how changes in land cover impact particle mobilization in different sub-watersheds. The variables representing first-order controls of soil detachment processes (annual precipitation, soil grain size distribution, soil bulk density, slope, and LAI) all varied with location in the Colorado River watershed. LAI also varied with time (Figure 3a). In the study region, deforestation increased exponentially between 1986 and 2014 (Figure S4.1). Deforested area (LAI < 4) increased by 3.3 times between 1986 and 2014, corresponding to a loss of 116 km2. The disappearance of forested area is especially apparent in the Puquiri subwatershed and Middle Colorado River where deforested area accounted for more than 60% of total forest loss in the watershed during this time frame. This forest loss was primarily along major waterways in the subcatchment (Figure S2.3).
Figure 3.

(a) Deforested area (km2) in each subwatershed between 1986 and 2014 calculated based on leaf area index (LAI) < 4; (b) Percent change in soil detachment relative to the year 1986 in each sub watershed during selected years 1999 to 2014 and estimated from the Pelletier soil detachment model. Error bars correspond to average inter-annual variability in rainfall (14%).
When observed values of LAI were used in the soil detachment/transport model, they resulted in estimated localized sediment flux values between 0 and 260 metric tons (t) km−2 yr−1 from well-forested landscapes and more than 1,000 t km−2 yr−1 in heavily deforested landscapes (Figure 4). The modeled sediment export was relatively constant throughout time in the Cupodne, Upstream Colorado, Huasoroco, and Downstream Colorado subwatersheds. However, in the Puquiri subwatershed, soil detachment increased more than 3-fold between 1986 and 2014 (Figure 3b). The model results indicate clear soil detachment patterns, with the greatest detachment occurring in the locations with the greatest mining activity (Figures 4 and 5a).
Figure 4.

Soil detachment rate in t km−2 yr−1 for 5 selected years between 1986 and 2014 based on soil detachment model in Colorado River Basin, Madre de Dios, Peru. Red indicates little or no soil detachment (0 – 100 t km−2 yr−1) and green and blue indicate increased soil detachment (> 1000 t km−2 yr−1). Subwatersheds are outlined in black.
Figure 5.

Calculated soil detachment rates in subcatchments of the Colorado River Basin and the relative contributions of each subcatchment for total mass loading of detached soil, as determined by: (a, b) Pelletier soil detachment model; and (c, d) RUSLE soil erosion model.
Similar trends in soil erosion yield were observed from the RUSLE model output: The contribution of the Puquiri subcatchment for overall erosion appears to increase substantially over the years (Figure 5c). However, we note that the RUSLE model output for eroded soil mass is about 100 times less than the output from the Pelletier model. RUSLE was designed for managed landscapes (e.g. agricultural plots) and is likely underestimating erosion in heavily forest areas (see SI Section 3 for more details). While there are discrepancies in the magnitude of soil erosion rates, both models are consistent in showing the relative contribution of mined and unmined subcatchments to soil loading (Figure 5b and 5d). Altogether, the model analyses suggest that the extensive deforestation associated with mining activities in the Puquiri and Colorado River basins was likely leading to substantial increases in soil erosion between 1986 and 2014.
Sensitivity and Uncertainty of Input Parameters and Model Result
The modeled total sediment yield from the Colorado River Basin (90 – 775 t km−2 yr−1) is within range for the 7 watersheds examined by Pelletier in South America (25 – 1000 t km−2 yr−1).18 We note the total area of the Colorado River Basin is within the range of watersheds originally modeled by Pelletier, and the subcatchments are smaller than this range. With this limitation in mind, we view the usefulness of the model output primarily for comparison between subcatchments and order-of-magnitude estimates of erosion rates.
Note that the model output is a value (as shown in Figure 4) and a range corresponding to the model estimate error (as described above). Additional spatial uncertainty from the interpolated rainfall was estimated by comparing estimated rainfall with measured rainfall from a rain gauge that was not included in the interpolation. Average rainfall in Salvacion (40 km northwest of the study area) between 2003 and 2008 was within 5% of the interpolated rainfall value (4.7 m yr−1 measured compared with 4.5 m yr−1 estimated).
The model inputs (apart from LAI) were held constant over time and therefore introduce additional temporal uncertainty into the model. Temporal variability is likely to be small for the slope, soil bulk density, and grain size distribution, and therefore these parameters can be reasonably held constant over time. Annual precipitation, however, does vary annually and especially during regional climate events. The model utilized geographically interpolated rain gauge data obtained from a limited time frame (2012–2013), which provides a source of uncertainty over time. To assess variability in precipitation over time, rainfall data was collected from neighboring gauges during longer time periods and including El Niño events. The relative standard deviations of average annual precipitation (standard deviation divided by the mean, in percent) among years were 14% and 12% for Salvacion and Pilcopata, respectively. Assuming the same relative standard deviation (14%) for annual precipitation between years within the Colorado River watershed study area, we calculated a range of soil detachment values to include interannual variability.
The Pelletier soil detachment model is especially sensitive to LAI as an input parameter because the detachment rate D is related to LAI by an exponential function (Eq. 2). In contrast, D has a linear dependence on soil bulk density, grain size distribution, and precipitation rate and has a power law dependence (exponent approximately equal to 1.25) on S. Thus, based on this model, differences in detachment rates throughout the watershed are primarily driven by changes in LAI.
Incorporating Field Observations into Sediment Transport Model
Increased erosion rates induced by mining-associated deforestation have important implications for Hg and other metals released into the environment. We recognize that the calculated Hg flux is based on water quality data from grab samples over three distinct sampling periods and additional important variables including Hg concentration and water flow rate can vary drastically over time and with weather events. Nevertheless, the field data and sediment transport model suggest major differences between subcatchments that host mining activity and subcatchments that do not host observable mining activity. Namely, increased deforestation from ASGM coincided with greater sediment and Hg flux through the watershed. Madre de Dios currently has high levels of Hg in fish in areas impacted by ASGM in the region.5 Therefore, the influx of Hg to downstream regions from ASGM and deforestation causes great concern for accumulation in the environment and in fish populations.
Our analyses indicate that ASGM poses a dual threat for mercury contamination: 1) direct release of mercury from accidental emissions or inappropriate disposal; and 2) soil mobilization driven by deforestation. Here we integrated field observations of Hg content in the river system and sediment transport modeling to connect soil particle loadings and deforestation from ASGM to Hg transport. Based on the suspended solids and metals concentrations in the Puquiri River and downstream, we hypothesize that deforestation associated with ASGM in the upstream areas contributed to erosion and trace metal transport to the downstream area. Increased Hg levels in mobilized sediments/soils in heavily mined regions were probably also contributors. However, we did not observe large location-specific differences in solid phase Hg content in suspended particles. For example, SW8 drained the heavily mined Puquiri watershed while site SW7 drained a watershed with less deforested landcover (and presumably less mining) (Figure 3). In February 2015, the Hg content in suspended solids was greater at SW8 (0.024 mg/kg) than at SW7 (0.011 mg/kg) (Figure S1.2), as would be expected based on differences in mining activity. However, the opposite trend was observed during the April 2016 sampling event. These results suggest that if the mining sites (such as those upland of SW8) contained highly concentrated Hg particles in the soils and these particles were mobilized from the mines, then the solid-bound Hg experienced ‘dilution’ processes (e.g., dissolution, desorption, and resorption). These processes then resulted in relatively similar Hg contents on suspended particles at our sampling sites, which were located dozens of kilometers downstream of mining. With these observations, amalgamation-related Hg release to soils was not the only contributor to total Hg mass export from the watershed (as determined by Eq. 4). Rather, the differences in TSS and particle loading were major contributors to the wide range of total Hg fluxes between subcatchments.
With the soil mobilization rates as predicted by the Pelletier erosion model and the measured Hg contents in suspended solids within the Colorado River Basin, we estimate between 16 – 130 kg of Hg was mobilized in the watershed in 2014, of which 4.1 – 35 kg Hg were mobilized in the Puquiri subwatershed. Changes in the landscape between 1986 and 2014 (primarily in the Puquiri subwatershed) led to a doubling of soil detachment in the Colorado River basin. Moreover, the average Hg detached over the watershed in 2014 was between 4.9 and 41 g km−2 yr−1, a range that is consistent with observations of mined and mixed use watersheds of similar size in the western U.S. 46
Soil and Hg River Export under Future Mining Scenarios
Management strategies that address direct Hg release can likely curb future increases in soil mercury concentrations. However, without addressing deforestation caused by mining, Hg mobilization could continue from ASGM affected areas, leading to sustained river export of mercury to downstream systems. As expected, the projected increase in deforestation through 2030 resulted in an increase of soil mobilization in the watershed (Figure 6). The extent of mobilization depends on the location of the mining. In the scenario where deforestation continues only in the Puquiri watershed through 2030, soil mobilization is potentially greater than if new deforestation occurs only in the mid-Colorado River watershed (280 t km−2 yr−1 compared to 260 t km−2 yr−1), representing a 19% and 11% change in total discharge respectively. At the same time, concentrating mining in the mid-Colorado River watershed led to an 89% increase in detachment within the Cupodne watershed, suggesting a dramatic change in total discharge and river ecology resulting from new mining in the region. While the total mining area remains the same for both scenarios, the spatial distribution appears to affect the magnitude of total soil mobilization from the watershed.
Figure 6.

Soil detachment calculated at the 2014 baseline year and projected soil detachment values in 2030. The projections assumed that deforestation rates at baseline continue to 2030 and were modeled with the same total area of newly deforested land, but with 3 different geographic distributions: dispersed evenly throughout the Middle Colorado and Puquiri sub-watersheds, located only in Middle Colorado sub-watershed, and located only in the Puquiri sub-watershed.
This spatial distribution analysis suggests that other watershed characteristics, in addition to deforestation, exacerbate soil mobility. For example, precipitation rates were lower in the Puquiri watershed compared to precipitation in the mid-Colorado River Watershed, and greater precipitation would overall increase soil mobilization in the mid-Colorado (Figure S2). However, soil in the Puquiri watershed was also estimated to comprise lower percentage of sand and greater percentages of silt and clay fraction as compared to the Colorado watershed (Figure S1). Smaller particles (e.g., silt and clay fractions) tend to have greater mobility and the calculations indicate that geographical differences in particle size distribution have a greater influence on soil detachment than regional differences in precipitation.
The projected total soil detachment and Hg loading from new mining was calculated based on 1,000 new mining areas by 2030, totaling 116 km2 of newly deforested area for ASGM activity. The greatest soil mobilization and associated Hg exports were predicted for new mining continuing only in the Puquiri subwatershed (Figure 6). In this scenario, the total Hg yield from the pour point of the Colorado River would reach between 6.0 and 50 g km−2 yr−1 by 2030 as compared to between 4.9 and 41 g km−2 yr−1 in 2014. In the Puquiri subwatershed, Hg would increase from between 4.6 and 39 g km−2 yr−1 in 2014 to between 6.7 and 56 g km−2 yr−1 in 2030. This projection yields between 19 and 151 kg of Hg mobilized annually in the Colorado River watershed by 2030, an average of 23% increase in Hg mobilization in the watershed.
Uncertainty in the scenario testing was determined from impact of randomly placed mine locations and impact of mine size on total detachment. The model output of future soil detachment was relatively consistent across realizations of the model, with the relative standard deviation <3%, with three replicated model runs of randomly located mines of the same mine size. When triplicate simulations were performed across three values for mine size (for a total of 9 simulations), the relative standard deviation in total detached soil was 11%. There was no apparent trend in detachment with increasing mine size.
Soil Fraction and Transport
Another output of the soil transport model is the Rouse number (R#) at each location, which can be used to determine the transport potential of detached soil size fractions. A R# value greater than 1.2 indicates local storage of soil. Conversely, a R# value less than 1.2 indicates that the size fraction will remain suspended and be transported downstream. Based on model calculations, only the clay size fraction (0–2 μm particle diameter) had R# less than 1.2, leading to a total watershed transport of between 19 and 160 t km−2 yr−1. The delivery ratio, which is the percent of total soil detached that reaches the basin outlet, was 22% and primarily driven by clay detachment and transport. The areas with high soil transport corresponded with the regions with the greatest detachment, within the mining areas in the Puquiri subwatershed (Figure S4.4). Particles in the larger size fractions would locally detach but were predicted to settle within the watershed without transport downstream. It is important to note, however, that this evaluation does not include storm and intense rainfall events that will dramatically increase soil transport to include particles in the sand and silt size fractions. Regardless, the modeled R# values indicated that clay is the only size fraction that will be transported from the watershed during baseline flow conditions.
In the Amazon, iron-rich soils, especially in fine-grain soils, can represent an important source of Hg from terrestrial to aquatic ecosystems.47 In addition, anthropogenic releases of mercury tend to sorb to particles and are typically associated with the clay size fraction because of high specific surface area relative to larger size fractions.48 Therefore, regardless of the source of Hg, sediment transport of the clay size fraction may be especially important for Hg mobility in this region, and the Hg content of individual size fractions should be assessed.49 The downstream area of the Colorado River watershed, including a large portion of the Puquiri watershed, has the largest percentage in the clay size fraction (up to 26%) and coincides with areas of mining, suggesting that current mining areas are especially vulnerable to erosion. Data on size-dependent distribution of Hg contents would help to improve the calculations of Hg export from the watershed.
We recognize that the soil grain size composition (estimated from a global database) was a substantial source of uncertainty for the model outcome, due to the importance of this input parameter for estimates of soil detachment and settling within the watershed. Future work in the MDD should examine size fraction in soil cores throughout the region, aim to establish more accurate soil grain size maps, and better understand locations of intense erosion rates. Historical, global mapping has not accurately described bulk density and particle size following mining activity. Surface water measurements of particle size will drastically improve sediment transport modeling in the region and help identify potential areas of high trace metal concentrations with greater detail.
Implications for ASGM Management
This study is, to the best of our knowledge, the first application of soil detachment models to help evaluate the impact of deforestation on erosion potential and river transport of Hg from ASGM sites. There are certainly other factors in the region that impact erosion and suspended solids concentrations in the region, including bank erosion and soil mobilization through mining. However, as outlined in previous sections, this approach is helpful for regional policy makers to understand the relationship between deforestation and erosion in the region, especially when there is a lack of resources for intensive site monitoring in sparsely populated locations. Publicly available remote sensing data (e.g., land cover, rainfall) could be used with this type of modeling to help inform evaluations of the potential impacts of ongoing ASGM activities for Hg and sediment transport, prioritize monitoring sites, and assist in the development of control strategies and policies.
Our analysis of the MDD region in Peru shows that deforestation from ASGM can exacerbate Hg transport and carry anthropogenic Hg and geogenic Hg from land surfaces to water bodies. This region appears to be especially sensitive to mercury bioaccumulation in fish; Hg contents in fish are of public health concern for local communities despite relatively low Hg concentrations in sediment.5, 6 A large increase in soil and Hg mobilization could have substantial impacts on public health in the region. In addition, the model calculations of soil detachment are likely to be conservatively low, as they only consider the impact of changing land cover (i.e., deforestation) and no other anthropogenic impacts that influence particle transport nor heavy rainfall events that are likely to increase sediment mobilization. For example, large quantities of soil and sediment are moved mechanically as a result of ASGM. This process is likely causing significant release of particles to surface waters as well as tailing piles that are susceptible to continuous erosion. Furthermore, soil and mercury are detached and moved downstream in the mining process itself. Thus, actual changes in soil and Hg mobilization rates will likely be greater than the estimates produced solely from deforestation. For this reason, future management strategies should restrict soil release directly into waterways from the different processes at play.
In Peru, policy makers are considering strategies to mitigate the negative effects of illegal mining. Past regulations have included restrictions on the sale of gasoline and other supplies, but efforts have had limited effect in curtailing mining.50 More recently, the national government has committed to a constant large-scale military presence to arrest illegal miners, physically remove families from mining areas, and to secure land for other investments or reforestation, which has been associated with the slowing of local deforestation.51 The results of this study inform current and future policy in that management strategies for mining will need to simultaneously consider policies on logging industries and deforestation.
This research also indicates an apparent gap in understanding the mass balance of Hg used in ASGM settings. Unconfirmed sources estimate that Madre de Dios miners have been using 30 to 50 tons of Hg annually in recent years.3, 52, 53 In contrast, our calculations suggest that between 16 and 130 kg of Hg is released annually through deforestation. However, significant uncertainty exists for Hg releases, particularly to the atmosphere. We also have a limited understanding of how far Hg is transported following release. Once released to the atmosphere, we can expect some Hg to be deposited on surrounding land surfaces in the MDD region and additional Hg to be transported further distances (i.e. globally). Completing the Hg mass balance for ASGM throughout the globe will provide invaluable information for scientist, policy makers, and the mining community.
Despite these uncertainties, the results of this study have implications for policies to manage mining activities and deforestation in Peru and throughout the globe. For example, land use designations and mining concessions could be placed strategically within a watershed while considering the impacts of erosion and downstream impacts. An understanding of soil composition, hydrological regimes, and watershed slope will be needed, as these characteristics play vital roles in total soil mobilization. Overall, this study helps guide decision makers in ASGM-active watersheds by demonstrating that reductions in Hg exposure risk and Hg loadings can be achieved by policies that jointly address mining and forest management practices.
Supplementary Material
Acknowledgements
Support for this study was provided by the Hunt Oil Company and the National Institute of Environmental Health Sciences (R21ES026960). SD was supported by the Duke Global Health Institute (DGHI) Doctoral Scholars Program and U.S. Environmental Protection Agency, Science to Achieve Results (STAR) Fellowship, No. 91778701–0. The views expressed in this document are solely those of the authors and do not necessarily reflect those of the Agency. WKP and AB were supported by the National Atmosphere and Space Agency (NNH13ZDA001N-Health). In field data collection was assisted by Peru’s Ministerio del Ambiente (MINAM), the Reserva Comunal Amarakaeri (RCA), the Federación Nativa del Rio Madre de Dios y Afluentes (FENAMAD), and the community of Puerto Luz, especially Andres Moqui. We also thank Laura Rogers, Rachel Whitson, Brooke Hassett, and Kaitlyn Porter for assistance in the field and laboratory.
Footnotes
Supporting Information Available. Additional descriptions of sample analysis methods and ancillary water quality data (Section 1), input parameters for model calculations (Section 2), Comparison of Pelletier and RUSLE models (Section 3), and soil erosion scenario testing (Section 4).
References
- 1.UNEP Global Mercury Assessment 2013: Sources, Emissions, Releases and Environmental Transport; UNEP Chemicals Branch, Geneva, Switzerland: 2013. [Google Scholar]
- 2.Ashe K, Elevated mercury concentrations in humans of Madre de Dios, Peru. PloS one 2012, 7, (3), e33305. [DOI] [PMC free article] [PubMed] [Google Scholar]
- 3.Swenson JJ; Carter CE; Domec JC; Delgado CI, Gold mining in the Peruvian Amazon: global prices, deforestation, and mercury imports. PloS one 2011, 6, (4), e18875. [DOI] [PMC free article] [PubMed] [Google Scholar]
- 4.Yard EE; Horton J; Schier JG; Caldwell K; Sanchez C; Lewis L; Gastanaga C, Mercury exposure among artisanal gold miners in Madre de Dios, Peru: a cross-sectional study. Journal of medical toxicology : official journal of the American College of Medical Toxicology 2012, 8, (4), 441–8. [DOI] [PMC free article] [PubMed] [Google Scholar]
- 5.Diringer S; Feingold BJ; Ortiz EJ; Gallis JA; Araujo-Flores JM; Berky A; Pan WKY; Hsu-Kim H, River Transport of Mercury from Artisanal and Small-Scale Gold Mining and Risks for Dietary Mercury Exposure in Madre de Dios, Peru. Environ. Sci.: Processes Impacts 2015, 17, (2), 478–487. [DOI] [PubMed] [Google Scholar]
- 6.Wyatt L; Ortiz E; Feingold B; Berky A; Diringer S; Morales A; Jurado E; Hsu-Kim H; Pan W, Spatial, Temporal, and Dietary Variables Associated with Elevated Mercury Exposure in Peruvian Riverine Communities Upstream and Downstream of Artisanal and Small-Scale Gold Mining. Int. J. Environ. Res. Public Health 2017, 14, (12). [DOI] [PMC free article] [PubMed] [Google Scholar]
- 7.Feingold BJ; Berky A; Hsu-Kim H; Rojas E; Pan WK, Population-based dietary exposure to mercury through fish consumption in the Southern Peruvian Amazon. Environmental Research 2019, 108720. [DOI] [PMC free article] [PubMed]
- 8.Resolucion Ministerial: Plan de Accion de Salud en el Marco del Estado de Emergencia en Once Distritos de las Provincias de Tambopata, Manu y Tahumanu del Departamento de Madre de Dios 2016; Decreto Supremo N° 034-2016-PCM In Ministerio de Salud, Republica del Peru: Lima, Peru, 2016; Vol. No. 354–2016 MINSA.
- 9.Selin H, Global Environmental Law and Treaty-Making on Hazardous Substances: The Minamata Convention and Mercury Abatement. Global Environmental Politics 2014, 14, (1), 1–19. [Google Scholar]
- 10.Gibb H; O’Leary KG, Mercury Exposure and Health Impacts among Individuals in the Artisanal and Small-Scale Gold Mining Community: A Comprehensive Review. Environmental health perspectives 2014, 122, (7), 667–72. [DOI] [PMC free article] [PubMed] [Google Scholar]
- 11.UNEP Minimata Convention on Mercury: Text and Annexes; United Nations Environment Programme: 2013. [Google Scholar]
- 12.Lechler PJ; Miller JR; Lacerda LD; Vinson D; Bonzongo JC; Lyons WB; Warwick JJ, Elevated mercury concentrations in soils, sediments, water, and fish of the Madeira River basin, Brazilian Amazon: a function of natural enrichments? The Science of the Total Environment 2000, 260, 87–96. [DOI] [PubMed] [Google Scholar]
- 13.AMAP/UNEP Technical Background Report for the Global Mercury Assessment 2013.; Arctic Monitoring and Assessment Programme, Oslo, Norway/UNEP Chemicals Branch, Geneva, Switzerland, 2013. [Google Scholar]
- 14.Howard J; Trotz MA; Thomas K; Omisca E; Chiu HT; Halfhide T; Akiwumi F; Michael R; Stuart AL, Total mercury loadings in sediment from gold mining and conservation areas in Guyana. Environmental monitoring and assessment 2011, 179, (1–4), 555–73. [DOI] [PubMed] [Google Scholar]
- 15.Ouboter PE; Landburg GA; Quik JH; Mol JH; van der Lugt F, Mercury levels in pristine and gold mining impacted aquatic ecosystems of Suriname, South America. Ambio 2012, 41, (8), 873–82. [DOI] [PMC free article] [PubMed] [Google Scholar]
- 16.Moreno-Brush M; Rydberg J; Gamboa N; Storch I; Biester H, Is mercury from small-scale gold mining prevalent in the southeastern Peruvian Amazon? Environ. Pollut 2016, 218, 150–159. [DOI] [PubMed] [Google Scholar]
- 17.Mol JHA; Ouboter PE, Downstream effects of erosion from small-scale gold mining on the instream habitat and fish community of a small neotropical rainforest stream. Conservation Biology 2004, 18, (1), 201–214. [Google Scholar]
- 18.Guentzel JL; Portilla E; Keith KM; Keith EO, Mercury transport and bioaccumulation in riverbank communities of the Alvarado Lagoon System, Veracruz State, Mexico. Sci Total Environ 2007, 388, (1–3), 316–24. [DOI] [PubMed] [Google Scholar]
- 19.Adler Miserendino R; Guimarães JRD; Schudel G; Ghosh S; Godoy JM; Silbergeld EK; Lees PSJ; Bergquist BA, Mercury Pollution in Amapá, Brazil: Mercury Amalgamation in Artisanal and Small-Scale Gold Mining or Land-Cover and Land-Use Changes? ACS Earth and Space Chemistry 2017, 2, (5), 441–450. [Google Scholar]
- 20.Martinez G; McCord SA; Driscoll CT; Todorova S; Wu S; Araujo JF; Vega CM; Fernandez LE, Mercury Contamination in Riverine Sediments and Fish Associated with Artisanal and Small-Scale Gold Mining in Madre de Dios, Peru. Int. J. Environ. Res. Public Health 2018, 15, (8), 1584. [DOI] [PMC free article] [PubMed] [Google Scholar]
- 21.Gamby R; Hammerschmidt C; Costello D; Lamborg C; Runkle J, Deforestation and cultivation mobilize mercury from topsoil. Sci Total Environ 2015, 532, 467–473. [DOI] [PubMed] [Google Scholar]
- 22.Mainville N; Webb J; Lucotte M; Davidson G; Betancourt O; Cueva E; Mergler D, Decrease of soil fertility and release of mercury following deforestation in the Andean Amazon, Napo River Valley, Ecuador. Science of the Total Environment 2006, 368, 88–98. [DOI] [PubMed] [Google Scholar]
- 23.Lindell L; Astrom ME; Sarenbo S, Effects of forest slash and burn on the distribution of trace elements in floodplain sediments and mountain soils of the Subandean Amazon, Peru. Applied Geochemistry 2010, 25, 1097–1106. [Google Scholar]
- 24.Asner GP; Llactayo W; Tupayachi R; Luna ER, Elevated rates of gold mining in the Amazon revealed through high-resolution monitoring. Proceedings of the National Academy of Sciences of the United States of America 2013, 110, (46), 18454–9. [DOI] [PMC free article] [PubMed] [Google Scholar]
- 25.Pelletier J, A spatially distributed model for the long-term suspended sediment discharge and delivery ratio of drainage basins. Journal of Geophysical Research 2012, 117, FO2028. [Google Scholar]
- 26.O’Day PA; Carroll SA; Randall S; Martinelli RE; Anderson SL; Jelinski J; Knezovich JP, Metal Speciation and Bioavailability in Contaminated Estuary Sediments, Alameda Naval Air Station, California. Environ. Sci. Technol 2000, 34, (17), 3665–3673. [Google Scholar]
- 27.Arevalo-Gardini E; Canto M; Alegre J; Loli O; Julca A; Baligar V, Changes in soil physical and chemical properties in long term improved natural and traditional agroforestry management systems of cacao genotypes in Peruvian Amazon. PloS one 2015, 10, (7), e0136784. [DOI] [PMC free article] [PubMed] [Google Scholar]
- 28.Bernoux M; Arrouays D; Cerri C; Volkoff B; Jolivet C, Bulk Densities of Brazilian Amazon Soils Related to Other Soil Properties. Soil Science Society of America Journal 1998, 62, (3), 743–749. [Google Scholar]
- 29.Cerri C; Coleman K; Jenkinson DS; Bernoux M; Victoria R; Cerri CC, Modeling soil carbon from forest and pasture ecosystems of Amazon, Brazil. Soil Science Society of America Journal 2003, 67, 1879–1887. [Google Scholar]
- 30.FAO/IIASA/ISRIC/ISS-CAS/JRC Harmonized World Soil Database (version 1.2); Rome, Italy and IIASA, Laxenburg, Austria, 2009. [Google Scholar]
- 31.Chen Y; Shah N; Huggins FE; Huffman GP, Transmission Electron Microscopy Investigation of Ultrafine Coal Fly Ash Particles. Environ. Sci. Technol 2005, 39, (4), 1144–1151. [DOI] [PubMed] [Google Scholar]
- 32.Tromp-van Meerveld HJ; Parlange JY; Barry DA; Tromp MF; Sander GC; Walter MT; Parlange MB, Influence of sediment settling velocity on mechanistic soil erosion modeling. Water Resources Research 2008, 44, (6), W06401. [Google Scholar]
- 33.Parks JM; Johs A; Podar M; Bridou R; Hurt RA; Smith SD; Tomanicek SJ; Qian Y; Brown SD; Brandt CC; Palumbo AV; Smith JC; Wall JD; Elias DA; Liang L, The genetic basis for bacterial mercury methylation. Science 2013, DOI: 10.1126/science.1230667. [DOI] [PubMed] [Google Scholar]
- 34.Renard KG; Foster GR; Weesies G; McCool D; Yoder D, Predicting soil erosion by water: a guide to conservation planning with the Revised Universal Soil Loss Equation (RUSLE). United States Department of Agriculture, Washington, DC: 1997; Vol. 703. [Google Scholar]
- 35.Babiarz CL; Hurley JP; Hoffmann SR; Andren AW; Shafer MM; Armstrong DE, Partitioning of total mercury and methylmercury to the colloidal phase in freshwaters. Environ. Sci. Technol 2001, 35, (24), 4773–4782. [DOI] [PubMed] [Google Scholar]
- 36.Choe K-Y; Gill GA; Lehman R, Distribution of particulate, colloidal, and dissolved mercury in San Francisco Bay estuary. 1. Total mercury. Limnology and Oceanography 2003, 48, (4), 1535–1546. [Google Scholar]
- 37.Stordal MC; Gill GA; Wen L-S; Santschi PH, Mercury phase speciation in the surface waters of three Texas estuaries: Importance of colloidal forms. Limnology and Oceanography 1996, 41, (1), 52–61. [Google Scholar]
- 38.McWilliam ALC; Roberts JM; Cabral OMR; Leitao MVBR; de Costa ACL; Maitelli GT; Zamparoni CAGP, Leaf area index and above-ground biomass of terra firme rain forest and adjacent clearings in Amazonia. Functional Ecology 1993, 7, 310–317. [Google Scholar]
- 39.Finer M; Novoa S, Large-scale vs. Small-scale Deforestation in the Peruvian Amazon. Monitoring of the Andean Amazon Project. maaproject.org 2016, 32. [Google Scholar]
- 40.Roman-Danobeytia F; Huayllani M; Michi A. Flor; Loayza-Muro R; Vazquez T; Rodriguesz L; Garcia M, Reforestation with four native tree species after abandoned gold mining in the Peruvian Amazon. Ecological Engineering 2015, 85, 39–46. [Google Scholar]
- 41.Peterson GD; Heemskerk M, Deforestation and forest regeneration following small-scale gold mining in the Amazon: the case of Suriname. Environmental Conservation 2001, 28, (2), 117–126. [Google Scholar]
- 42.Riscassi AL; Hokanson KJ; Scanlon TM, Streamwater Particulate Mercury and Suspended Sediment Dynamics in a Forested Headwater Catchment. Water, Air, & Soil Pollution 2011, 220, (1–4), 23–36. [Google Scholar]
- 43.Cai Y; Jaff R; Jones RD, Interactions between dissolved organic carbon and mercury species in surface waters of the Florida Everglades. Applied Geochemistry 1999, 14, (3), 395–407. [Google Scholar]
- 44.Guentzel JL; Powell RT; Landing WM; Mason RP, Mercury associated with colloidal material in an estuarine and an open-ocean environment. Marine Chemistry 1996, 55, (1), 177–188. [Google Scholar]
- 45.Stallard RF; Edmond JM, Geochemistry of the Amazon 2. The Influence of Geology and Weathering Environment on the Dissolved Load. Journal of Geophysical Research 1983, 88, (C14), 9671–9688. [Google Scholar]
- 46.Domagalski J; Majewski MS; Alpers CN; Eckley CS; Eagels-Smith CA; Schenk L; Wherry S, Comparison of mercury mass loading in streams to atmospheric deposition in watersheds of Western North America: Evidence for non-atmospheric mercury sources. Science of the Total Environment 2016, 568, 638–650. [DOI] [PubMed] [Google Scholar]
- 47.Roulet M; Lucotte M; Canuel R; Farella N; Courcelles M; Guimaraes J-R; Mergler D; Amorim M, Increase in mercury contamination recorded in lacustrine sediments following deforestation in the central Amazon. Chemical Geology 2000, 165, (3–4), 243–266. [Google Scholar]
- 48.Gabriel MC; Williamson DG, Principal biogeochemical factors affecting the speciation and transport of mercury through the terrestrial environment. Environmental Geochemistry and Health 2004, 26, 421–434. [DOI] [PubMed] [Google Scholar]
- 49.Grigal D, Mercury sequestration in forests and pealands: a review. J Environ Qual 2003, 32, (2), 393–405. [DOI] [PubMed] [Google Scholar]
- 50.Guidi R Illegal gold miners in Madre de Dios, Peru, paralyze the region with protests. http://news.mongabay.com/2015/12/illegal-gold-miners-in-madre-de-dios-peru-paralyze-the-region-with-protests/
- 51.Schwartz L, The Other Man-Made Disaster Ravaging the Amazon: Peru’s aggressive campaign to eradicate illegal gold mining in the Amazon has yielded mixed results. The Nation 2019, https://www.thenation.com/article/peru-la-pampa-illegal-gold-mining/.
- 52.Gardner E, Peru battles the golden curse of Madre de Dios. Nature 2012, 486, (7403), 306–7. [DOI] [PubMed] [Google Scholar]
- 53.Brooks W; Sandoval E; Yepez M; Howell H Peru Mercury Inventory 2006: U.S. Geological Survey Report 2007–1252. http://pubs.usgs.gov/of/2007/1252
Associated Data
This section collects any data citations, data availability statements, or supplementary materials included in this article.