

Abstract
Malaria, a vector-borne disease, is a significant public health problem in Keonjhar district of Odisha (the malaria capital of India). Prediction of malaria, in advance, is an urgent need for reporting rolling cases of disease throughout the year. The climate condition do play an essential role in the transmission of malaria. Hence, the current study aims to develop and assess a simple and straightforward statistical model of an association between malaria cases and climate variates. It may help in accurate predictions of malaria cases given future climate conditions. For this purpose, a Bayesian Gaussian time series regression model is adopted to fit a relationship of the square root of malaria cases with climate variables with practical lag effects. The model fitting is assessed using a Bayesian version of R2 (RsqB). Whereas, the predictive ability of the model is measured using a cross-validation technique. As a result, it is found that the square root of malaria cases with lag 1, maximum temperature, and relative humidity with lag 3 and 0 (respectively), are significantly positively associated with the square root of the cases. However, the minimum and average temperatures with lag 2, respectively, are observed as negatively (significantly) related. The considered model accounts for moderate amount of variation in the square root of malaria cases as received through the results for RsqB. We also present Absolute Percentage Errors (APE) for each of the 12 months (January–December) for a better understanding of the seasonal pattern of the predicted (square root of) malaria cases. Most of the APEs obtained corresponding to test data points is reasonably low. Further, the analysis shows that the considered model closely predicted the actual (square root of) malaria cases, except for some peak cases during the particular months. The output of the current research might help the district to develop and strengthen early warning prediction of malaria cases for proper mitigation, eradication, and prevention in similar settings.
Keywords: Malaria, Forecasting, Climate, Bayesian statistical modeling, Gaussian time series regression, MCMC, Odisha
Introduction
Malaria (vector-borne disease), has a substantial public health concern in most of the tropical countries of the world. It is the most prevalent vector-borne disease, as nine out of ten malaria deaths occur in Africa, Latin America, and Asia. In India itself, approximately 225 million cases, and nearly one million deaths occur every year due to malaria disease (Kant 2011; Hay et al. 2008, 2011). However, it is the fourth leading cause of death in children and pregnant women in developing nations (Martens and Hall 2000; Rowe et al. 2013). World Health Organisation (WHO) estimated millions of malaria cases and approximately 660,000 deaths during 2009 and 2010 (WHO 2013). Despite the global contraction in the past (Gething et al. 2010), the disease still imposes a worth mentioning health and socioeconomic burden to many developing and underdeveloped nations (WHO 2013). Five species of parasites affect human, but two of them, Plasmodium vivax (pv) and Plasmodium falciparum (pf) pose more threats (WHO 2013; Lingala 2017). Though, about 60–65% of infections are caused due to pv, while 35–40% of cases are related to pf (Lal et al. 2000).
India is a sub-tropical country showing spatial variability in rainfall, temperature, and humidity. Some of the Indian states, Madhya Pradesh, Odisha, Andhra Pradesh, West Bengal, Gujarat, North Eastern States, Bihar, and Maharashtra, are endemic for pf. These states contribute around 80% of total malaria cases in the country. In Odisha only, 27% malaria cases and 18% of deaths were reported (NVBDCP 2013) due to malaria. It has also been noticed that, out of thirty districts of Odisha, major cases are documented from the Southern, Western and Northern part of the state, which is mostly covered with forest and hilly areas (Pradhan et al. 2016).
Vector and Water-borne diseases have a significant influence on human health due to climate change (Reiter 2001; Sutherst 2004; Gould and Higgs 2009). The Intergovernmental Panel on Climate Change (IPCC) reported that projected changes in climate (the spatiotemporal variations in rainfall and temperature) would alter the geography (natural habitat) and pattern of mosquitoes. Human activities, climatological variables, and natural calamities provide high breeding mosquito (vector) condition (see Solomon et al. 2007). Several studies reported that temperature and rainfall have significant relation with mosquitoes breeding and its infection (Lindsay and Birley 1996; Reiter 2001; Hoshen and Morse 2004; Dhingra et al. 2011; Parham and Michael 2010; Caminade et al. 2014). The ambient temperature plays a significant role in the life-cycle of the malaria vector. Climate change prevails the variability in temperature, rainfall, and relative humidity, which further influences the modification in behaviour and geographical distribution of malaria vectors by altering the length of life-cycle (Gebere-Mariam 1984; Ayanlade et al. 2013).
The study of modeling of malaria cases and climate variables is being widely conducted. In literature, statistical tools and models such as autocorrelation and cross-correlation, regression models, time series models, time series regression models, spatio-temporal models, have been used for the modelling and prediction of malaria and its association with the meteorological variates. Zhai (2018) used an empirical statistical model based on binary logistic regression for predicting malaria outbreaks given climate variables. It suggested including factors other than the meteorological variables for the increased accuracy of prediction. Imai et al. (2016) utilized the negative binomial regression model and presented associations of malaria cases and global and local climate conditions with different lag effects. Anokye et al. (2018) and Anwar et al. (2016) applied ARIMA time series model and cross-correlation function. They showed that the prediction of malaria cases, if based on meteorological factors, shall be increased. Zhao et al. (2014) studied the association over thirty countries in hot and cold weather conditions considering a distributed lag non-linear model. The model is formulated with lag ranges instead of a single lag effect of climate variables. The study by Alemu et al. (2011) applied correlation and linear regression analyses to measure the strength of a linear association between the variables. Huang et al. (2011a) used correlation analysis and SARIMA time series analysis for modeling the variables. Krefis et al. (2011) considered correlation and linear regression analysis with ranges of lag effects of climate variables on log-transformed malaria cases. Xiao et al. (2010) used correlation analysis and non-linear time series regression (auto-regressive Poisson regression) modeling and evaluated the prediction ability of the model. Bi et al. (2003) utilized correlation analysis, ARIMA time series, and generalized least square models to assess the association of climate variables on log-transformed malaria cases.
In recent decades, the Bayesian modeling approach is also being attempted to assess the climate covariates and to know the predictants in driving malaria (Umer et al. 2019; Abiodun et al. 2019; Ssempiira et al. 2018; Wangdi et al. 2018; Shimaponda-Mataa et al. 2017; Alegana et al. 2016; Diboulo et al. 2015; Arab et al. 2014; Villalta et al. 2013; Zayeri et al. 2011; Zacarias and Andersson 2011; Huang et al. 2011b; Nkurunziza et al. 2010; Clements et al. 2009). Most of these works are based on the spatio-temporal modeling, which might require extensive data and study of the problem. However, few of them applied time series regression modeling of malaria cases given climate factors.
A few pieces of research were also conducted in modeling the association of malaria cases and climate variables in India. However, there is no research on Bayesian modeling and applications in evaluating the relationship between malaria cases and climate variables in India. Lee et al. (2016) utilized linear regression model for spatio-temporal analysis of an effect of climate variables on malaria incidences. Nath and Mwchahary (2012) considered correlation analysis and linear regression modeling of association of malaria cases and climate variables-rainfall, temperature, the relative humidity for the Kokrajhar districts of Assam, India. Upadhyayula et al. (2015) used principal component analysis and Hoteling’s T2 statistics to assess the climatic determinant for malaria transmission. They found that temperature and rainfall are the most influencing climate factors for the high rate of malaria transmission over the East Siang district of Arunachal Pradesh. Further, Kumar et al. (2014) applied ARIMA time series for modeling and forecasting the malaria cases using climatic predictors.
Among the methodologies used in the literature, correlation analysis is an initial step to know the climate variables to be included in the study of malaria based on significant of their correlation with the cases. However, if used alone, it does not provide a general model approach for prediction of the number of disease incidences. ARIMA is a useful modeling tool for time series data with stationary behaviour. Non-stationary time series data may also be modeled using the model with the differencing technique. Some temporal data may be required with twice or thrice differencing for final stationary pattern necessary for the application of time series models. Time series regression models are suitable for modeling linear and non-linear relationships between variables. It also provides a natural inclusion of explanatory variables with lag effects. Spatio-temporal models are a step ahead in modeling associations, as they use temporal as well as spatial interdependence between variables. These models include more than one spatially correlated location of variables, hence, requiring necessary spatial and temporal characteristics of data for the study. However, India is diverse in Orography, socio-economic factor, human activity, Land Use Land Cover and weather conditions. These factors may add complexity in quick and straightforward modeling.
The time series regression modeling has been applied to time series data of various field of study under different titles such as transitional, Markov conditional regression model (Fokianos and Kedem 2004; Benjamin et al. 2003; Mukhopadhyay et al. 2019). In this paper, we have used a Gaussian time series regression model for modeling a suitable association between the square root (Chaves and Pascual 2006, 2007) of malaria cases and climatological variables. The model is simple to understand and easy to apply for modeling a temporal relationship between the response (square root of malaria cases) and covariates (climatological variables). We use Bayesian analysis of the model for the estimation of regression parameters and prediction of malaria cases. The Bayesian approach enables one to provide probabilistic statements about parameters of interest and unknown variables given a set of observations, henceforth, the uncertainty in prediction could also be quantified. It is achieved via, basically, finding out posterior distributions of model parameters of interest and unknowns and then predicting future observations with uncertainty through the computation of predictive posterior distributions (Gelman et al. 2013). These Bayesian computation problems may not always be tractable. However, it could be eased with the use of Markov Chain Monte Carlo (MCMC), a simulation-based method that is believed to provide accurate results in the long run (Gilks et al. 1996; Congdon 2006). We have applied MCMC techniques to carry out the Bayesian analysis of the problem under study.
Very sparse or no research on modelling of malaria have been reported yet for the study of the association between malaria cases and climate covariates for the state of Odisha. A purpose of modeling an association between malaria cases and climate variables is to get a time ahead prediction of malaria in advance. The model may be implemented for knowing the malaria epidemic in advance, and shall help to Govt. authorities’ policy makers and others to apply quick and efficient mitigation, and adaptation. The tropical climate of the state, characterized by high temperature, moderate to extreme/high rainfall, high humidity and short winter (mild temperature) with little or no rain favours the malaria transmission. The rising temperature is likely to speed up the lifecycle of malaria causing mosquito and make the vectors bite very frequently, thereby increasing the probability of malaria transmission (Martens et al. 1995). Rainfall also affects malaria transmission by increasing relative humidity and altering temperature (Pampana 1969). Therefore, the main objective of this paper is as follows:
To build a simple yet accurate time series regression modeling of the relationship between malaria cases and climatological variables for the Keonjhar District of Odisha, using a Bayesian approach.
To evaluate the accuracy of the built model via the use of a Bayesian version of R2 technique.
To check the predictive ability of the model using an appropriate cross-validation technique.
The output of the current research shall help the policy makers to develop and strengthen the early warning prediction of malaria cases, hence could be applied for proper mitigation, eradication, and prevention in similar settings.
The layout for the rest of the paper is as follows. Section 2 contains the study area, description of data, methods describing Bayesian modeling of data and analysis and techniques to measure the predictive ability of the model, followed by result and discussions in Sect. 3. Section 4 presents the conclusion and prospect of this research.
Study area, data and methods
Study area
In India, 30% of deaths are due to malaria disease. The state (Odisha) locates on the east coast of India between 81.27′ and 87.29′ E longitudes and 17.49′–22.34′ N latitudes, with a 3.46% population of the Country (Dhangadamajhi et al. 2015; Census 2011). Due to the humid tropical climate, the state receives massive to average rainfall between June to September from southwest monsoon and a little between December to January from the Northeast monsoon. It comprises of three central regions such as the plateaus, mountains, coastal plains and 34.23% of the area is covered with forest (Department of forest and environment, Government of Odisha). Most of its districts have a mass of forest cover, and it accounts for 4.7 million hectares (https://www.odishafdc.com/odishaforest_ofdc.php). The average annual rainfall ranges between 150 and 200 cm, and the annual mean temperature ranges between 22 and 27 °C. The Pre-monsoon months, the month of April to June (mid), are usually sweltering and dry with the maximum temperature up to 40–46 °C. The winter minimum temperature may fall as low as 10 °C or below at some areas of the state. Keonjhar (Fig. 1) is a landlocked district of northern Odisha, half-covered with forest. In Keonjhar, the months of May and December are the hottest and the coldest months of the year respectively, and it receives an average annual rainfall of 1534 mm. The Odisha state contributes about 56.35% of malaria cases (Dash 2009), and 43.06% of death of the country (Dhangadamajhi et al. 2015; NVBDCP 2013). The Eastern Ghat region of the state show high endemicity of Malaria, followed by Northern plateau, and the Keonjhar district (considered study area) belong to this geographic location (Dhangadamajhi et al. 2015; Pradhan and Meherda 2019) only. In contrast, districts lies along the coast, have demonstrated few incidences of malaria cases. Keonjhar is among the highest reporting malaria cases from northern district of Odisha and considered for current study. The literacy rate of Keonjhar district is 59.24% (state owns 63.8%), the health and income index is 0.34 and 0.547 respectively, while the Human Development Index (HDI) ranks at 24 [CTRAN Consulting (Bhubaneswar), TMST—Orissa Health Support Plan (2009)].
Fig. 1.

Study area showing the geographical location of Keonjhar, a district of Orissa, India
Data
Keonjhar is among the highest malaria reporting districts of Odisha. We have obtained the monthly cases of malaria for Keonjhar from National Vector Borne Disease Control Program (NVBDCP), Odisha, for the period since January 2003 till December 2013. On the other hand, the monthly data in observation for rainfall (RF) are also acquired from the India Meteorological Department (IMD), available at a surface grid resolution of 0.25° × 0.25° (Pai et al. 2014; Parth Sarthi et al. 2015, 2016). The major role of temperature, rainfall and relative humidity in the malaria transmission have been reported by the earlier researchers (Pampana and others 1969; Martens et al. 1995; Parida and Bhatia 2015; Pradhan and Meherda 2019) and supports mosquitogenic condition. Hence, for the current study, the climate variables, temperature, relative humidity, and temperature are taken in account to perform the modeling study. The monthly data for minimum temperature (Tmin), maximum temperature (Tmax), average temperature (Tave), and relative humidity (RH) are found from Odisha met centre (monthly data entry), while data for RH is taken from the National Centre for Environmental Prediction (NCEP) (Kalnay et al. 1996).The data for RH are available at a surface grid resolution of 1° × 1° (Kalnay et al. 1996). The ambient temperature and RH of Odisha is favourable for the perennial transmission of malaria in many parts. The monthly data for climate variables, RF, Tmin, Tmax, Tave, and RF are shown in Fig. 2.
Fig. 2.

Monthly data for temperature (Tmax, Tmim, Tave) in °C, relative humidity (%) and rainfall (mm)
The Fig. 3 shows the annual cycle of climate covariates (Tmax, Tmin, Tave, RH, and RF) and malaria cases (monthly average) during the study period over Keonjhar, Odisha. During January the minimum temperature in Tmax, Tmin, and Tave, and during May the maximum of heat in all three forms are observed. The highest temperature (for study period) in Tmax is 37.8 °C, and the lowest temperature in Tmin is 12.8 °C. In the annual cycle of rainfall, the month of July receives the highest rainfall (~ 334 mm) and a little rain is received in the December month. Similarly, for the annual cycle for relative humidity in Keonjhar, it is observed that during July, August and September have the highest values. However, most of the months have RH more than 30%. The monthly average cases during the study period are also confirmed, and it is interesting to note that the highest cases are reported during July, with the lowest count during January. Malaria cases are found to be increasing gradually and gaining the peaks during July, and after that, start decreasing.
Fig. 3.

Annual cycle of a Malaria cases and climatic variables b–d for the study period 2003–2013 in Keonjhar district, Orissa, India
Methods
We apply the cross-correlation analysis with lag effect as a prerequisite for fitting an association between malaria cases and climate co-variates; its results are shown in Table 1. The cross-correlation analysis of monthly malaria incidence and meteorological data time series exposed the time lag(s) of meteorological factors preceding malaria at which the series showed strongest correlation (Huang et al. 2011a). Lag correlations are obtained with effects- zero to five. The maximum correlation value of 0.60, 0.58, 0.58, 0.60 and 0.47 are found for malaria cases and Tmin, Tmax, Tave, RH and RF with the effective lag months of 2, 3, 2, 0 and 1, respectively. These figures of lag effects are consistent with the past studies (see, Zhou et al. 2004; Huang et al. 2011b; Krefis et al. 2011; Colón-González et al. 2016; Imai et al. 2016). They have reported the lags of 0–5 months for temperature, 0–2 months for relative humidity and 0–3 months for rainfall for association with malaria cases.
Table 1.
Lag correlation for Malaria cases and climate covariates in Keonjhar, Orissa, India, Jan 2003–Dec 2013
| lag 0 | lag 1 | lag 2 | lag 3 | lag 4 | lag 5 | |
|---|---|---|---|---|---|---|
| Tmin | 0.31 | 0.52 | 0.60* | 0.51 | 0.27 | -0.03 |
| Tmax | − 0.08 | 0.21 | 0.49 | 0.58* | 0.48 | 0.26 |
| Tave | 0.14 | 0.40 | 0.58* | 0.56 | 0.39 | 0.11 |
| Relative humidity | 0.60* | 0.52 | 0.27 | 0.01 | − 0.24 | − 0.40 |
| Rainfall | 0.44 | 0.47* | 0.34 | 0.20 | − 0.02 | − 0.21 |
*Highest correlation
The observed malaria cases are time series exhibiting the pattern of seasonality and irregularity. We consider the square root transformation of the observed malaria cases for the current study that does not change the time-series behaviour of data, as displayed in Fig. 4. Moreover, squaring a time series data also stabilizes variance in data and make it suitable to model count data with linear models. Krefis et al. (2011) considered the log transformation of malaria count data to model an association of malaria cases with precipitation.
Fig. 4.

Presentation of monthly cases of Malaria [actual (solid line) and square root (dotted line)] for Keonjhar district of Orissa for the period of January 2003–December 2013 (color figure online)
We apply a Bayesian Gaussian time series regression model to fit a relationship of the square root of malaria cases with the climate variables. The model description is as follows:
where, for month t, the term is the square root of the malaria cases, and are the population means and population variances of , respectively, and and are temperatures-minimum, maximum and average with lag effects 2, 3 and 2, respectively. Whereas, denotes the relative humidity with zero lag effect and refers to rainfall with lag effect of 1 month. The terms α and are the regression coefficients of the model. The prior densities over the regression coefficients are considered as independent Gaussian densities, with mean zero and precision, 0.1 (variance = 10), and a conjugate (non-informative) gamma prior density with hyper-parameters values 0.01 and 0.01, respectively, is applied over the precision parameter τ. This set of prior densities is chosen to allow data to dominate in the posterior inference of the parameters.
For the Bayesian analysis of the problem under study, posterior point estimates (such as mean, median) and 95% Highest Posterior Density (HPD) intervals are considered. The HPD intervals represent more probable values of parameters within the interval than the values outside the interval. The execution of MCMC simulations for the Bayesian analysis of the problem under study is carried out with a quick software, OpenBUGS 3.2.3 version, with three chains, 150,000 runs, 60,000 burn-in period and ten thin. These figures on chain-runs, burn-in period, and thin are chosen to ensure the accuracy of convergence of MCMC simulations. The convergence of MCMC simulations can be assessed using BGR plots (Spiegelhalter et al. 2003). However, the accuracy of the Bayesian model fitting to data is assessed with the Bayesian version of R2 measurement, which we denote as RsqB, and is given as:
where, , and, , with as the mean of data. In this Bayesian version of the definition of R2, the is found for the posterior mean of
The effectiveness of the fitted Bayesian model to the square of malaria cases is checked via cross-validation technique. Since the time series data have dependence structure, the usual method of cross-validation that requires randomness in data might not provide valid results. The cross-validation technique, i.e., ‘rolling forecasting origin’ (Hyndman Rob and Athanasopoulos 2018) designed for time series data, is applied here. To use this cross-validation technique with changing the origin of the forecast, twenty-one datasets of test data of size four and training data of sizes (starting with 45–125), are considered. Since the training and test datasets are to be treated as independent, they have been kept three data-points apart (keep in mind that the maximum lag considered in the analysis is three), and hence 4 months ahead to 8 months ahead predictions are computed. The Mean of Absolute Percentage Error (MAPE) per MCMC simulations and standardized residuals are used as measures of accuracy of prediction via the cross-validation technique. The measures are defined as follows:
One, Absolute percentage error, (size of test dataset),and Mean Absolute Percentage Error, , and two, the standardized residuals, , . Theoretically, the standardized residuals follow standard Gaussian density, and 99% of these residuals should lie within − 3 to 3 limits.
Results and discussion
The data analysis is carried out in two stages: firstly, the model fitting with the Bayesian approach and secondly, an assessment of prediction ability of the model via cross-validation technique. The results of model fitting using the Bayesian approach are demonstrated in Table 2. The table shows the posterior summaries of the parameters and regression coefficients of the considered model. The posterior mean values of intercept parameter α and regression coefficients and were obtained as negative, whereas those of and are found as positive. The 95% HPD regions of α (− 6.238, 4.806) and include zero value. Hence the respective covariates, intercept, and RF with lag 1 are found insignificantly associated with the square root of malaria cases. However, association of the covariates, square root of malaria cases with lag 1, Tmax with lag 3 and RH with lag 0 are attained as significantly positive, and association of other covariates, Tmin with lag 2 and Tave with lag 2 with the square root of malaria cases are found significantly negative as the 95% HPD regions of their respective regression coefficients exclude zero value. The theoretical basis of this justification of insignificant/significant association may be found in Thulin (2014).
Table 2.
Results of MCMC simulation runs for parameters of the model under study
| Parameters | Point estimates | MC error (3) | 95% HPD region | Start (7) | Sample (8) | |||
|---|---|---|---|---|---|---|---|---|
| Mean (1) | SD (2) | Val2.5pc (4) | Median (5) | Var97.5pc (6) | ||||
| α | − 0.7617 | 2.816 | 0.01945 | − 6.238 | − 0.7649 | 4.806 | 60001 | 27000 |
| 0.6722 | 0.06653 | 7.304E−4 | 0.5404 | 0.6727 | 0.8018 | 60001 | 27000 | |
| − 1.204 | 0.4254 | 0.008197 | − 2.043 | − 1.205 | − 0.3601 | 60001 | 27000 | |
| − 0.4767 | 0.2403 | 0.003895 | − 0.9475 | − 0.4771 | − 0.01072 | 60001 | 27000 | |
| 1.944 | 0.4597 | 0.00942 | 1.042 | 1.94 | 2.855 | 60001 | 27000 | |
| 0.08289 | 0.03526 | 2.924E−4 | 0.01366 | 0.08287 | 0.1519 | 60001 | 27000 | |
| 6.524E−4 | 0.005177 | 4.191E−5 | − 0.009477 | 6.644E−4 | 0.01072 | 60001 | 27000 | |
| 0.04176 | 0.005177 | 3.176E−5 | 0.03192 | 0.04156 | 0.05272 | 60001 | 27000 | |
Therefore, the posterior mean of the precision parameter is close to 0.04, but its 95% HPD region is small. The posterior mean of the variance parameter (inverse of is nearly 24. To check how well the considered model captures the variation in data, a Bayesian Version of , is calculated based on MCMC simulations. The result is displayed in Table 3. The posterior mean value of RsqB obtained is 0.6738. It indicates that the considered Gaussian time series regression model accounts for nearly 67% of the variation in the square root of malaria cases. A model selection criterion, Deviance Information Criterion (DIC) is also applied and is found as 779.0 with an effective number of parameters pD equalled to 7.201.
Table 3.
Posterior estimates of RsqB based on MCMC simulations
| RsqB | Mean | SD | MC_error | val2.5pc | median | val97.5pc | Start | Sample |
|---|---|---|---|---|---|---|---|---|
| 0.6738 | 0.00932 | 9.068E−5 | 0.6507 | 0.6756 | 0.6864 | 60,001 | 27,000 |
The accuracy measurements of prediction ability of the model, absolute percentage errors (APEs) and standardized residuals for each test data points of each of 21 cross-validation datasets are calculated based on the MCMC simulations on the prediction of test data points. The measurements-results on standardized residual and APEs for the cross-validation datasets are arranged in series. The series are displayed against the corresponding indices of months of prediction in Figs. 5 and 6. The time indices of prediction months are considered from 49 (correspond to January, 2007) to 132 (correspond to December, 2013). The standardized residuals plotted against time indices in Fig. 5 lie within − 3 to + 3 except for two values 3.023 and 3.844 at time indices 80 and 84. As expected, the residuals do not show any specific pattern or trend against time indices. It is evident from Fig. 6 that most of the APEs corresponding to test data points are found below 25%, the maximum value of APE is obtained as 35.69% at time index 119 for the month of November, 2012. Since the observed malaria cases have a seasonal pattern, it is worth to check the values of APEs for each of the 12 Months, i.e., January to December, in a combined plot; the combined plot for APEs is displayed in Fig. 7. It shows that APEs are found below 25% during the month April, May, July, and September, whereas during June and August the APEs are found scattered ranging from value 10.46–30.48% and 10.76–29.78%, respectively. We also found MAPE measurements for each test dataset. Except two (around 24% and 27%), all MAPE measurements are below 20%.
Fig. 5.

Presentation of standardized residuals for test data points against the corresponding time indices of prediction months during 2007–2013
Fig. 6.

Presentation of absolute percent errors for test data points against the corresponding time indices of prediction months during 2007–2013
Fig. 7.
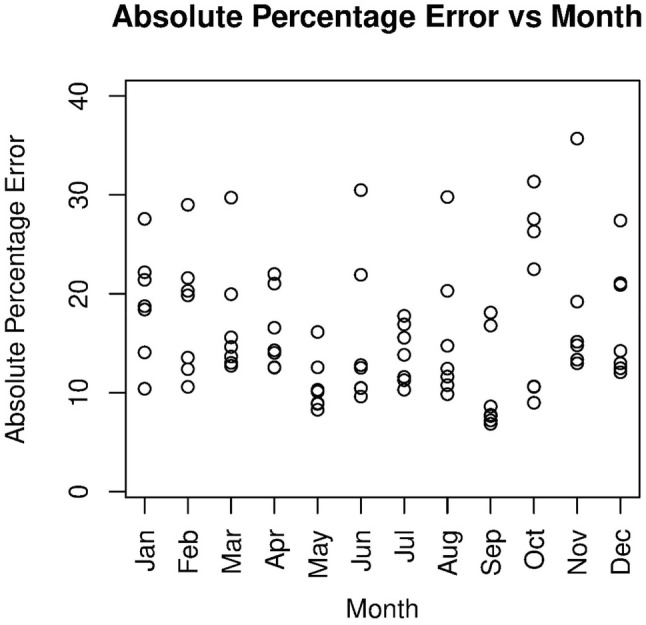
Month-wise display of absolute percent errors (APE) for test data points during the period 2007–2013
To note that the cross-validation results for each dataset are obtained based on model fittings for different training datasets with varying sizes. The calculation of standardized score involves posterior mean values of τ, which are obtained sepeartely for different training datasets. Hence, APE values and standardized residual values may not be in accordance to form a series of two parallel measurements.
The predicted values, posterior mean and HPD intervals of the test data points of 21 cross-validation datasets are displayed with the actual observations in Fig. 8. Standard deviations of the MCMC samples on predictions of test data points are obtained, ranging from 4.5 to 7. The 95% HPD interval of the prediction includes most of the actual (test) data points. Only five data points are on the boundary or outside the limit of the 95% HPD interval. These points lie more dispersed than other points from their (fitted) mean. Hence, the considered model closely predicted the actual (square root of) malaria cases, except for some extreme cases.
Fig. 8.

Comparison of predicted, lower and upper bounds of 95% HPD and actual cases displayed against the time indices of prediction months during 2007–2013 (color figure online)
The results here support the study findings of previous work such as Woube (1997), Bhattacharya et al. (2006) and Nath and Mwchahary (2012). They reported that the effect of rainfall in the transmission of malaria is least influencing, very complex, and non-linear. Moreover, for Indian Malaria, a moderate amount of rain is more pleasant for malaria incidences (WHO 1997). However, rainfall does impact malaria transmission (life cycle of malaria vector) while affecting the other climate variables like relative humidity and temperature. The rain often causes the creation of small pools which serve mosquitoes for their breeding sites. It also leads to increased humidity which enhances mosquito survival (Lauderdale et al. 2014). Whereas, more rainfall and accretion of surface water possibly wash out or destroy mosquitos’ density (Shimaponda-Mataa et al. 2017). Mosquito activity and their survival are also directly dependent on the moisture present in the environment (i.e., relative humidity). Mosquitoes become more active when humidity rises and most often they prefer to feed during night time, as humidity is the highest for a day during the night. The average relative humidity (55 ≤ RH ≤ 80), an encouraging factor to malaria transmission, also has a significant influence in the life cycle of mosquito and behaviour of biting humans (Huang et al. 2011a). Similarly, the temperature ranges 24–28 °C remain the most suitable, both for pv and pf transmission (Reiter 2001), with impacting the parasite development (Paaijmans et al. 2010). The current study reveals that Tmax with lag 3 attained as significantly positive. It implies that Tmax may contribute to the mature of the parasite (Zhao et al. 2014; Clements et al. 2009). Apart from the aforementioned factors (the climate variables), other covariates, e.g. wind speed, wind direction, sunshine hours, residual spray etc. may also influence the transmission of malaria to little extent. However, they are not added to the model to avoid further complexity and subsiding the model predictability and lack of proper data recordings is also one of the reasons. In general, the Indoor Residual Spraying (IRS) along with DDT is an effective method to control/reduce malaria, but number of problems encountered, and the exact data are hard to get (World Health Organization 1997).
There are other studies which resulted in different findings for modeling association between infectious and malaria cases and climate or meteorological variables using a Bayesian approach. A Bayesian spatial study by Umer et al. (2019) found Tmin having positive and Rainfall having negative effect on malaria cases in Pakistan. Minimum temperature and rainfall were observed as having significantly positive association with malaria cases in work with semiparametric Poisson regression by Shimaponda-Mataa et al. (2017) in Zambia. Zayeri et al. (2011) applied Bayesian spatial modelling and found humidity and minimum and maximum temperatures as positively correlated but rainfall as negatively correlated with the incidences of disease in Iran. Huang et al. (2011a) have compared some Bayesian spatio-temporal regression models based on many combinations of meteorological variables. They also found rainfall as the most significant covariate affecting annual malaria cases in Central China. Nkurunziza et al. (2010) have presented Bayesian generalized linear modeling and generalized additive modeling of the association of meteorological variables with malaria incidence rates. The authors found that the minimum temperature, with lag effect 1, had a positive, a strong association with malaria incidences. Whereas, maximum temperature and rainfall were found having an adverse impact on monthly malaria cases in Burundi, Africa. The other climate factors (sunshine, wind speed, wind direction, diurnal temperature range, evaporation etc.) also have a role in the transmission of malaria (Midega et al. 2012; Li et al. 2013; Hundessa et al. 2017; Endo and Eltahir 2018a, b; Kotepui and Kotepui 2018), however, rainfall, temperature and relative humidity are the major climatic determinants (Cash et al. 2013). The limitation of the current study may be the lack of these data for the analysis.
Conclusions
Odisha is the highest malaria reporting state of India. The malaria disease causes several deaths in the state. Climatic variables are among the essential factors which impact malaria transmission. The current study aims to fit a relationship between malaria incidence and climate covariates (Tmax, Tmin, Tave, RH, and RF) with optimal lag effects for Keonjhar district of Odisha using a Bayesian Gaussian time series regression model. The climate variables are found correlated with malaria cases at lags of two, three, two, zero, and one for Tmax, Tmin, Tave, RH, and RF, respectively. However, the model exhibits that the malaria cases with lag one, maximum temperature with lag three and relative humidity with lag zero are attained as significantly and positively related with malaria transmission, whereas, the minimum temperature and the average temperature with lag two, respectively, are found as significantly negatively associated with the (square root of) malaria cases. Rainfall with lag one is obtained as having an insignificant effect on the transmission of malaria. The effectiveness of fitted Bayesian model to the square of malaria cases is tested via cross-validation technique. It is found that the considered model fitted and predicted the malaria cases satisfactorily. Along with the considered climate variates, other environmental and demographic factors such as sunshine hour, wind speed, and forest cover also play an essential role in malaria transmission. Considering the other climate covariates too, the complexity of malaria transmission may be understood broadly. However, this inclusion may pose a trade-off between complexity and accuracy as it may complex the model, and the precision of results may also be lowered. However, if data on other climate and demographic variates are available, prediction results might be more accurate with the addition of the variables to the model.
This study is expected to provide evidence to support the strength of climate-driven disease modeling and to determine the validity of using climate covariates to create a general forecasting model for similar settings and demographic characteristics. The findings of the research might be relevant from a public health perspective to better understand the modeling of malaria and climate, and such study may be implied for similar settings.
Author’s contribution
PK and RV designed the research, MK and VG helped in data pre-processing and basic analysis. RV and PK did further analysis, performed modeling and drafted the manuscript with PPS. MK, VG and PPS revised the manuscript.
Funding
There is no funding for current research work.
Compliance with ethical standards
Conflict of interest
There is no conflict of interest for this research.
Footnotes
Publisher's Note
Springer Nature remains neutral with regard to jurisdictional claims in published maps and institutional affiliations.
Contributor Information
Praveen Kumar, Email: praveen221288@gmail.com.
Richa Vatsa, Email: vatsa.richa@gmail.com.
References
- Abiodun GJ, Makinde OS, Adeola AM, et al. A dynamical and zero-inflated negative binomial regression modelling of malaria incidence in Limpopo province, South Africa. Int J Environ Res Public Health. 2019 doi: 10.3390/ijerph16112000. [DOI] [PMC free article] [PubMed] [Google Scholar]
- Alegana VA, Kigozi SP, Nankabirwa J, et al. Spatio-temporal analysis of malaria vector density from baseline through intervention in a high transmission setting. Parasites Vectors. 2016;9:1–10. doi: 10.1186/s13071-016-1917-3. [DOI] [PMC free article] [PubMed] [Google Scholar]
- Alemu A, Abebe G, Tsegaye W, Golassa L. Climatic variables and malaria transmission dynamics in Jimma town, South West Ethiopia. Parasit Vectors. 2011;4:30. doi: 10.1186/1756-3305-4-30. [DOI] [PMC free article] [PubMed] [Google Scholar]
- Anokye R, Acheampong E, Owusu I, Isaac Obeng E. Time series analysis of malaria in Kumasi: using ARIMA models to forecast future incidence. Cogent Soc Sci. 2018;4:1–13. doi: 10.1080/23311886.2018.1461544. [DOI] [Google Scholar]
- Anwar MY, Lewnard JA, Parikh S, Pitzer VE. Time series analysis of malaria in Afghanistan: using ARIMA models to predict future trends in incidence. Malar J. 2016 doi: 10.1186/s12936-016-1602-1. [DOI] [PMC free article] [PubMed] [Google Scholar]
- Arab A, Jackson MC, Kongoli C. Modelling the effects of weather and climate on malaria distributions in West Africa. Malar J. 2014;13:1–9. doi: 10.1186/1475-2875-13-126. [DOI] [PMC free article] [PubMed] [Google Scholar]
- Ayanlade A, Olugbade Adeoye N, Babatimehin O. Intra-annual climate variability and malaria transmission in Nigeria. Bull Geogr. 2013;21:7–19. doi: 10.2478/bog-2013-0016. [DOI] [Google Scholar]
- Benjamin MA, Rigby RA, Stasinopoulos DM. Generalized autoregressive moving average models. J Am Stat Assoc. 2003;98(461):214–223. doi: 10.1198/016214503388619238. [DOI] [Google Scholar]
- Bhattacharya S, Sharma C, Dhiman RC, Mitra AP. Climate change and malaria in India. Curr Sci. 2006;90:369–375. [Google Scholar]
- Bi P, Tong S, Donald K, et al. Climatic variables and transmission of malaria: a 12-year data analysis in Shuchen County, China. Public Health Rep. 2003;118:65–71. doi: 10.1016/S0033-3549(04)50218-2. [DOI] [PMC free article] [PubMed] [Google Scholar]
- Caminade C, Kovats S, Rocklov J, et al. Impact of climate change on global malaria distribution. Proc Natl Acad Sci USA. 2014;111:3286–3291. doi: 10.1073/pnas.1302089111. [DOI] [PMC free article] [PubMed] [Google Scholar]
- Cash BA, Rodó X, Ballester J, et al. Malaria epidemics and the influence of the tropical South Atlantic on the Indian monsoon. Nat Clim Change. 2013;3:502–507. doi: 10.1038/nclimate1834. [DOI] [Google Scholar]
- Chaves LF, Pascual M. Climate cycles and forecasts of cutaneous leishmaniasis, a nonstationary vector-borne disease. PLoS Med. 2006;3:1320–1328. doi: 10.1371/journal.pmed.0030295. [DOI] [PMC free article] [PubMed] [Google Scholar]
- Chaves LF, Pascual M. Comparing models for early warning systems of neglected tropical diseases. PLoS Negl Trop Dis. 2007 doi: 10.1371/journal.pntd.0000033. [DOI] [PMC free article] [PubMed] [Google Scholar]
- Clements ACA, Barnett AG, Cheng ZW, et al. Space-time variation of malaria incidence in Yunnan province, China. Malar J. 2009;8:1–12. doi: 10.1186/1475-2875-8-180. [DOI] [PMC free article] [PubMed] [Google Scholar]
- Colón-González FJ, Tompkins AM, Biondi R, et al. Assessing the effects of air temperature and rainfall on malaria incidence: an epidemiological study across Rwanda and Uganda. Geospat Health. 2016;11:379. doi: 10.4081/gh.2016.379. [DOI] [PubMed] [Google Scholar]
- Congdon P. Bayesian statistical modellingd. 2. Chichester: Wiley; 2006. [Google Scholar]
- CTRAN Consulting (Bhubaneswar), TMST—Orissa Health Support Plan (2009) An analysis of health status of Orissa in specific reference to health equity
- Dhangadamajhi G, Hazra R, Ranjit M. Malaria in Odisha and future perspectives. Phot J Infect Dis. 2015;114:289–304. [Google Scholar]
- Dhingra N, Jha P, Sharma VP, et al. CSU 28/2011: malaria in Brazil/malaria in India. NIH Public Access. 2011;376:1768–1774. doi: 10.1016/S0140-6736(10)60831-8. [DOI] [Google Scholar]
- Diboulo E, Sié A, Diadier DA, et al. Bayesian variable selection in modelling geographical heterogeneity in malaria transmission from sparse data: an application to Nouna Health and Demographic Surveillance System (HDSS) data, Burkina Faso. Parasites Vectors. 2015;8:1–14. doi: 10.1186/s13071-015-0679-7. [DOI] [PMC free article] [PubMed] [Google Scholar]
- Endo N, Eltahir EAB. Environmental determinants of malaria transmission around the Koka Reservoir in Ethiopia. GeoHealth. 2018;2:104–115. doi: 10.1002/2017gh000108. [DOI] [PMC free article] [PubMed] [Google Scholar]
- Endo N, Eltahir EAB. Modelling and observing the role of wind in Anopheles population dynamics around a reservoir. Malar J. 2018;17:1–9. doi: 10.1186/s12936-018-2197-5. [DOI] [PMC free article] [PubMed] [Google Scholar]
- Fokianos K, Kedem B. Partial likelihood inference for time series following generalized linear models. J Time Ser Anal. 2004;25(2):173–197. doi: 10.1046/j.0143-9782.2003.00344.x. [DOI] [Google Scholar]
- Gebere-Mariam N (1984) Highlights of malaria situation in Ethiopia. In: National Health Development Network, Addis Ababa, pp 5–18
- Gelman A, Carlin JB, Stern HS, Dunson DB, Vehtari A, Rubin DB. Bayesian data analysis. 3. Boca Ratan: Chapman & Hall/CRC; 2013. [Google Scholar]
- Gething PW, Smith DL, Patil AP, et al. Climate change and the global malaria recession Europe PMC Funders Group. Nature. 2010;465:342–345. doi: 10.1038/nature09098. [DOI] [PMC free article] [PubMed] [Google Scholar]
- Gilks WR, Richardson S, Spiegelhalter DJ, editors. Markov Chain Monte Carlo in Practice. London: Chapman & Hall/CRC; 1996. [Google Scholar]
- Gould EA, Higgs S. Impact of climate change and other factors on emerging arbovirus diseases. Trans R Soc Trop Med Hyg. 2009;103:109–121. doi: 10.1016/j.trstmh.2008.07.025. [DOI] [PMC free article] [PubMed] [Google Scholar]
- Hay SI, Smith DL, Snow RW. Measuring malaria endemicity from intense to interrupted transmission. Lancet Infect Dis. 2008;8:369–378. doi: 10.1016/S1473-3099(08)70069-0. [DOI] [PMC free article] [PubMed] [Google Scholar]
- Hay SI, Gething PW, Snow RW (2011) UKPMC Funders Group India’ s invisible malaria burden. 376:1716–1717. 10.1016/S0140-6736(10)60831-8.3 [DOI] [PMC free article] [PubMed]
- Hoshen MB, Morse AP. A weather-driven model of malaria transmission. Malar J. 2004;14:1–14. doi: 10.1186/1475-2875-3-32. [DOI] [PMC free article] [PubMed] [Google Scholar]
- Huang F, Zhou S, Zhang S, et al. Temporal correlation analysis between malaria and meteorological factors in Motuo County, Tibet. Malar J. 2011;10:54. doi: 10.1186/1475-2875-10-54. [DOI] [PMC free article] [PubMed] [Google Scholar]
- Huang F, Zhou S, Zhang S, et al. Meteorological factors—based Spatio-temporal mapping and predicting malaria in central China. Am J Trop Med Hyg. 2011;85:560–567. doi: 10.4269/ajtmh.2011.11-0156. [DOI] [PMC free article] [PubMed] [Google Scholar]
- Hundessa S, Williams G, Li S, et al. The weekly associations between climatic factors and Plasmodium vivax and Plasmodium falciparum malaria in China, 2005–2014. Trans R Soc Trop Med Hyg. 2017;111:211–219. doi: 10.1093/TRSTMH/TRX048. [DOI] [PubMed] [Google Scholar]
- Hyndman Rob J, Athanasopoulos G. Forecasting: principles and practice. 2. Otexts: Melbourne; 2018. [Google Scholar]
- Imai C, Cheong HK, Kim H, et al. Associations between malaria and local and global climate variability in five regions in Papua New Guinea. Trop Med Health. 2016;44:1–9. doi: 10.1186/s41182-016-0021-x. [DOI] [PMC free article] [PubMed] [Google Scholar]
- Kalnay E, Kanamitsu M, Kistler R, et al. The NCEP/NCAR 40-year reanalysis project. Bull Am Meteorol Soc. 1996;77:437–471. doi: 10.1175/1520-0477(1996)077<0437:TNYRP>2.0.CO;2. [DOI] [Google Scholar]
- Kant R. Global malaria burden and achieving universal coverage of interventions: a glimpse on progress and impact. Curr Sci. 2011;101:286–292. [Google Scholar]
- Kotepui M, Kotepui KU. Impact of weekly climatic variables on weekly malaria incidence throughout Thailand: a country-based six-year retrospective study. J Environ Public Health. 2018 doi: 10.1155/2018/8397815. [DOI] [PMC free article] [PubMed] [Google Scholar]
- Krefis AC, Schwarz NG, Krüger A, et al. Modeling the relationship between precipitation and malaria incidence in children from a holoendemic area in Ghana. Am J Trop Med Hyg. 2011;84:285–291. doi: 10.4269/ajtmh.2011.10-0381. [DOI] [PMC free article] [PubMed] [Google Scholar]
- Kumar V, Mangal A, Panesar S, et al. Forecasting malaria cases using climatic factors in Delhi, India: a time series analysis. Malar Res Treat. 2014;2014:482851. doi: 10.1155/2014/482851. [DOI] [PMC free article] [PubMed] [Google Scholar]
- Lal S, Sonal GS, Phukan PK. Status of malaria in India. J Indian Acad Clin Med. 2000;5:19–23. [Google Scholar]
- Lauderdale JM, Caminade C, Heath AE, et al. Towards seasonal forecasting of malaria in India. Malar J. 2014;13:1–20. doi: 10.1186/1475-2875-13-310. [DOI] [PMC free article] [PubMed] [Google Scholar]
- Lee E, Burkhart J, Olson S, Billings AA, Patz JA, Harner EJ. Relationships of climate and irrigation factors with malaria parasite incidences in two climatically dissimilar regions in India. J Arid Environ. 2016;124:214–224. doi: 10.1016/j.jaridenv.2015.08.010. [DOI] [Google Scholar]
- Li T, Yang Z, Wang M. Temperature, relative humidity and sunshine may be the effective predictors for occurrence of malaria in Guangzhou, southern China, 2006–2012. Parasites Vectors. 2013;6:1. doi: 10.1186/1756-3305-6-155. [DOI] [PMC free article] [PubMed] [Google Scholar]
- Lindsay SW, Birley MH. Climate change and malaria transmission. Ann Trop Med Parasitol. 1996;90:573–588. doi: 10.1080/00034983.1996.11813087. [DOI] [PubMed] [Google Scholar]
- Lingala MAL. Effect of meteorological variables on Plasmodium vivax and Plasmodium falciparum malaria in outbreak prone districts of Rajasthan, India. J Infect Public Health. 2017;10:875–880. doi: 10.1016/j.jiph.2017.02.007. [DOI] [PubMed] [Google Scholar]
- Martens P, Hall L. Malaria on the move: human population movement and malaria transmission. Emerg Infect Dis. 2000;6:28–45. doi: 10.3201/eid0602.000202. [DOI] [PMC free article] [PubMed] [Google Scholar]
- Martens WJM, Niessen LW, Rotmans J, et al. Potential impact of global climate change on malaria risk. Environ Health Perspect. 1995;103:458–464. doi: 10.1289/ehp.95103458. [DOI] [PMC free article] [PubMed] [Google Scholar]
- Midega JT, Smith DL, Olotu A, et al. Wind direction and proximity to larval sites determines malaria risk in Kilifi District in Kenya. Nat Commun. 2012 doi: 10.1038/ncomms1672. [DOI] [PMC free article] [PubMed] [Google Scholar]
- Mukhopadhyay S, Tiwari R, Shetty P, Gogtay NJ, Thatte UM. Modeling and forecasting indian malaria incidence using generalized time series models, communications in statistics: case studies. Data Anal Appl. 2019 doi: 10.1080/23737484.2019.1580629. [DOI] [Google Scholar]
- Nath DC, Mwchahary DD. Association between climatic variables and malaria incidence: a study in Kokrajhar District of Assam, India. Glob J Health Sci. 2012;5:90–106. doi: 10.5539/gjhs.v5n1p90. [DOI] [PMC free article] [PubMed] [Google Scholar]
- National Vector Borne Disease Control Program (NVBDCP) (2012) Vector borne diseases in India. Directorate General of Health Services, Ministry of Health and Family Welfare, Government of India. Available at: http://nvbdcp.gov.in/
- National Vector Borne Disease Control Program (NVBDCP) (2013) Diagnosis and treatment of malaria, pp 1–20
- Nkurunziza H, Gebhardt A, Pilz J. Bayesian modeling of the effect of climate on malaria in Burundi. Malar J. 2010;9:1–8. doi: 10.1186/1475-2875-9-114. [DOI] [PMC free article] [PubMed] [Google Scholar]
- Paaijmans KP, Blanford S, Bell AS, et al. Influence of climate on malaria transmission depends on daily temperature variation. Proc Natl Acad Sci USA. 2010;107:15135–15139. doi: 10.1073/pnas.1006422107. [DOI] [PMC free article] [PubMed] [Google Scholar]
- Pai DS, Sridhar L, Rajeevan M, et al. Development of a new high spatial resolution (0.25° × 0.25°) long period (1901–2010) daily gridded rainfall data set over India and its comparison with existing data sets over the region. Mausam. 2014;65:1–18. [Google Scholar]
- Pampana E et al (1969) A textbook of malaria eradication. In: A textbook malar eradication, 2nd edn
- Parham PE, Michael E. Modeling the effects of weather and climate change on malaria transmission. Environ Health Perspect. 2010;118:620–626. doi: 10.1289/ehp.0901256. [DOI] [PMC free article] [PubMed] [Google Scholar]
- Parida SP, Bhatia V. Malaria status in India with focus on Odisha State having maximum disease burden. Glob J Med Public Heal. 2015;4:1–6. [Google Scholar]
- Parth Sarthi P, Ghosh S, Kumar P. Possible future projection of Indian Summer Monsoon Rainfall (ISMR) with the evaluation of model performance in Coupled Model Inter-comparison Project Phase 5 (CMIP5) Glob Planet Change. 2015;129:92–106. doi: 10.1016/j.gloplacha.2015.03.005. [DOI] [Google Scholar]
- Parth Sarthi P, Kumar P, Ghosh S. Possible future rainfall over Gangetic Plains (GP), India, in multi-model simulations of CMIP3 and CMIP5. Theor Appl Climatol. 2016;124:691–701. doi: 10.1007/s00704-015-1447-5. [DOI] [Google Scholar]
- Pradhan M, Meherda P. Malaria elimination drive in Odisha: hope for halting the transmission. J Vector Borne Dis. 2019;56:53–55. doi: 10.4103/0972-9062.257775. [DOI] [PubMed] [Google Scholar]
- Pradhan A, Anasuya A, Pradhan MM, et al. Trends in Malaria in Odisha, India—an analysis of the 2003–2013 time-series data from the national vector borne disease control program. PLoS ONE. 2016;11:e0149126–e0149126. doi: 10.1371/journal.pone.0149126. [DOI] [PMC free article] [PubMed] [Google Scholar]
- Reiter P. Climate change and mosquito-borne disease. Environ Health Perspect. 2001;109(Suppl 1):141–161. doi: 10.1289/ehp.01109s1141. [DOI] [PMC free article] [PubMed] [Google Scholar]
- Rowe AK, Rowe SY, Snow RW, et al. Europe PMC funders group the burden of malaria mortality among African children in the year 2000. Int J Epidemiol. 2013;35:691–704. doi: 10.1093/ije/dyl027. [DOI] [PMC free article] [PubMed] [Google Scholar]
- Shimaponda-Mataa NM, Tembo-Mwase E, Gebreslasie M, et al. Modelling the influence of temperature and rainfall on malaria incidence in four endemic provinces of Zambia using semiparametric Poisson regression. Acta Trop. 2017;166:81–91. doi: 10.1016/j.actatropica.2016.11.007. [DOI] [PubMed] [Google Scholar]
- Solomon S, Qin D, Manning M, et al. Climate change 2007—the physical science basis: working group I contribution to the fourth assessment report of the IPCC. Cambridge: Cambridge University Press; 2007. [Google Scholar]
- Spiegelhalter DJ, Thomas A, Best, N., Lunn D (2003) WinBUGS Version-1.4 User Manual, Cambridge: MRC Biostatistics Unit, Institute of Public Health. https://www.mrc-bsu.cam.ac.uk/wp-content/uploads/manual14.pdf
- Ssempiira J, Kissa J, Nambuusi B, et al. Interactions between climatic changes and intervention effects on malaria spatio-temporal dynamics in Uganda. Parasite Epidemiol Control. 2018;3:e00070. doi: 10.1016/j.parepi.2018.e00070. [DOI] [PMC free article] [PubMed] [Google Scholar]
- Sutherst RW. Global change and human vulnerability to vector-borne diseases. Clin Microbiol Rev. 2004;17:136–173. doi: 10.1128/cmr.17.1.136-173.2004. [DOI] [PMC free article] [PubMed] [Google Scholar]
- Thulin M. Decision theoretic justifications for Bayesian hypothesis testing using credible sets. J Stat Plan Inference. 2014;146:133–138. doi: 10.1016/j.jspi.2013.09.014. [DOI] [Google Scholar]
- Umer MF, Zofeen S, Majeed A, et al. Effects of socio-environmental factors on malaria infection in Pakistan: a bayesian spatial analysis. Int J Environ Res Public Health. 2019 doi: 10.3390/ijerph16081365. [DOI] [PMC free article] [PubMed] [Google Scholar]
- Upadhyayula SM, Mutheneni SR, Chenna S, et al. Climate drivers on malaria transmission in Arunachal Pradesh, India. PLoS ONE. 2015;10:e0119514. doi: 10.1371/journal.pone.0119514. [DOI] [PMC free article] [PubMed] [Google Scholar]
- Villalta D, Guenni L, Rubio-Palis Y, Ramírez Arbeláez R. Bayesian space-time modeling of malaria incidence in Sucre state, Venezuela: spatial special issue. AStA Adv Stat Anal. 2013;97:151–171. doi: 10.1007/s10182-012-0190-9. [DOI] [Google Scholar]
- Wangdi K, Canavati SE, Ngo TD, et al. Analysis of clinical malaria disease patterns and trends in Vietnam 2009–2015 11 medical and health sciences 1117 public health and health services. Malar J. 2018;17:1–15. doi: 10.1186/s12936-018-2478-z. [DOI] [PMC free article] [PubMed] [Google Scholar]
- World Health Organization: an Operational Manual for Indoor Residual Spraying (Irs) for Malaria Transmission Control and Elimination Second Edition Indoor Residual Spraying
- World Health Organization. Office of Global and Integrated Environmental Health (1997) Health and environment in sustainable development: five years after the Earth Summit. World Health Organization. https://apps.who.int/iris/handle/10665/63464
- World Health Organization The world health report 2013: research for universal health coverage. World Heal Organ Press. 2013 doi: 10.1126/scitranslmed.3006971. [DOI] [Google Scholar]
- Woube M. Geographical distribution and dramatic increases in incidences of malaria: consequences of the resettlement scheme in Gambela, SW Ethiopia. Indian J Malariol. 1997;34:140–163. [PubMed] [Google Scholar]
- Xiao D, Long Y, Wang S et al (2010) Spatiotemporal distribution of malaria and the association between its epidemic and climate factors in Hainan, China 1–11 [DOI] [PMC free article] [PubMed]
- Zacarias OP, Andersson M. Spatial and temporal patterns of malaria incidence in Mozambique. Malar J. 2011;10:1–10. doi: 10.1186/1475-2875-10-189. [DOI] [PMC free article] [PubMed] [Google Scholar]
- Zayeri F, Salehi M, Pirhosseini H. Geographical mapping and Bayesian spatial modeling of malaria incidence in Sistan and Baluchistan province, Iran. Asian Pac J Trop Med. 2011;4:985–992. doi: 10.1016/S1995-7645(11)60231-9. [DOI] [PubMed] [Google Scholar]
- Zhai JX. Development of an empirical model to predict malaria outbreaks based on monthly case reports and climate variables in Hefei. China. 2018;1990–2011(178):148–154. doi: 10.1016/j.actatropica.2017.11.001. [DOI] [PubMed] [Google Scholar]
- Zhao X, Chen F, Feng Z, et al. The temporal lagged association between meteorological factors and malaria in 30 counties in south-west China: a multilevel distributed lag non-linear analysis. Malar J. 2014;13:57. doi: 10.1186/1475-2875-13-57. [DOI] [PMC free article] [PubMed] [Google Scholar]
- Zhou G, Minakawa N, Githeko AK, Yan G. Association between climate variability and malaria epidemics in the East African highlands. Proc Natl Acad Sci. 2004;101:2375–2380. doi: 10.1073/pnas.0308714100. [DOI] [PMC free article] [PubMed] [Google Scholar]