

SUMMARY
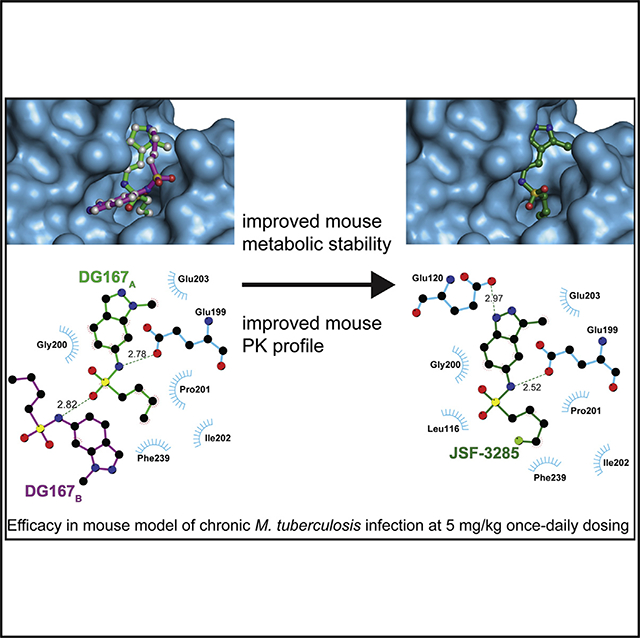
Published Mycobacterium tuberculosis β-ketoacyl-ACP synthase KasA inhibitors lack sufficient potency and/or pharmacokinetic properties. A structure-based approach was used to optimize existing KasA inhibitor DG167. This afforded indazole JSF-3285 with a 30-fold increase in mouse plasma exposure. Biochemical, genetic, and X-ray studies confirmed JSF-3285 targets KasA. JSF-3285 offers substantial activity in an acute mouse model of infection and in the corresponding chronic infection model, with efficacious reductions in colony-forming units at doses as low as 5 mg/kg once daily orally and improvement of the efficacy of front-line drugs isoniazid or rifampicin. JSF-3285 is a promising preclinical candidate for tuberculosis.
In Brief
Inoyama et al. disclose the optimization of an indazole antitubercular targeting the β-ketoacyl-ACP synthase KasA. A structure-based approach has overcome significant issues with mouse metabolic stability and pharmacokinetics. A preclinical drug candidate has been delivered with efficacy in a mouse model of chronic M. tuberculosis infection at 5 mg/kg dosing.
Graphical Abstract
INTRODUCTION
Tuberculosis (TB) is a global health threat with an estimated number of cases of 10 million for 2018 (WHO, 2019), with 500,000 of these infections involving multidrug-resistant (MDR) Mycobacterium tuberculosis; MDR TB is inherently more difficult to treat, requiring on the order of 2 years with the current arsenal of second-line antitubercular agents. The lengthy treatment duration for these infections, as well their continued geographic spread and increase in extent of resistance with respect to TB drugs, necessitate the development of novel antitubercular agents and regimens. Although the TB literature is replete with reports of chemical tool compounds that modulate novel cellular targets, most lack drug-like profiles supportive of their continued progression through a drug discovery process (Koul et al., 2011).
Cell wall biosynthesis constitutes one of the most fruitful cellular processes to target for antibacterial drug development. Unfortunately, the β-lactam class members are largely ineffective as antituberculars due to the presence of potent β-lactamases (Nampoothiri et al., 2008), despite recent advances in understanding the role of L,D-transpeptidases (Gupta et al., 2010; Kumar et al., 2012, 2017). However, several other drugs which inhibit M. tuberculosis cell wall targets have proven to be highly efficacious. The most commonly used cell wall drugs are isoniazid (INH), ethambutol, and ethionamide (ETH). The European Medicines Agency-approved delamanid and the recently Food and Drug Administration-approved pretomanid may also inhibit the cell wall as part of their mechanism of action (Matsumoto et al., 2006; Stover et al., 2000). INH and ETH inhibit mycolic acid biosynthesis (Banerjee et al., 1994; Vilcheze et al., 2006). Mycolic acids are C60-C90 branched-chain β-hydroxylated fatty acids that comprise the mycolyl-arabinogalactan peptidoglycan (m-AGP) cell wall complex (Kremer et al., 2000). During mycolic acid biosynthesis, the type I fatty acid synthase (FAS-I) extends acyl-CoA primers to produce C16-C18 and C24-C26 fatty acids. The type II fatty acid synthase (FAS-II), acting on acyl carrier proteins (ACPs), then completes chain elongation with a variety of components, including the enoyl-ACP reductase InhA (inhibited by INH) and the β-ketoacyl synthase KasA, producing meromycolic acids (C48-C64) (Bhatt et al., 2007). Synthesis of mycolic acids is completed when the carboxylated a-alkyl C26 fatty acid branch (originating from FAS-I) and the meromycolic acid branch (originating from FAS-II) activated by FadD32 (Leger et al., 2009) are condensed together by Pks13 (Gavalda et al., 2009). Mycolic acids are essential components of the mycobacterial cell wall, are critical for the pathogenesis of M. tuberculosis and have been demonstrated to be important in virulence and persistence in vivo (Bhatt et al., 2007; Dubnau et al., 2000; Glickman et al., 2000). INH, one of the most potent drugs against M. tuberculosis in vivo (Rustomjee et al., 2008), has many of the features desirable in a new cell wall biosynthesis inhibitor. Its efficacy clearly demonstrates that mycolic acid biosynthesis represents an excellent pathway for drug development. Furthermore, the FAS-II enzymes are likely to be good targets for drug development, because eukaryotic cells do not appear to possess FAS-II and instead rely on FAS-I to synthesize their fatty acids (Heath and Rock, 2004).
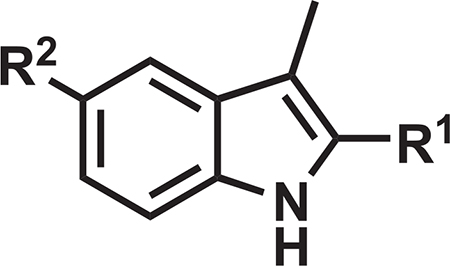
KasA is the only essential member (DeJesus et al., 2017) of three β-ketoacyl synthases encoded in the M. tuberculosis genome. KasA catalyzes the 2-carbon elongation of growing fatty acyl chains in the FAS-II pathway, critical to the biosynthesis of mycolic acids and, in turn, the bacterial cell wall. Our laboratory (Kumar et al., 2018) and another group (Abrahams et al., 2016) have both published on the indazole sulfonamide inhibitor of KasA we have termed DG167 (Figure 1). DG167 displays an MIC (minimum inhibitory concentration resulting in 90% inhibition of bacterial growth) of 0.39 mM against the wild-type H37Rv strain and lacks cross-resistance with front-line TB chemotherapies, demonstrating that inhibition of KasA is a novel mechanism of action distinct from current TB treatment options (Kumar et al., 2018). At 100 mg/kg dose qd po (once daily oral dosing) in our acute M. tuberculosis infection model (Kumar et al., 2018), DG167 alone did not reduce the bacterial load of mouse lungs as compared with the start of the treatment. Thus, we positioned DG167 as a flawed hit compound, failing to exhibit significant cidal activity in our animal model likely due to its sub-optimal pharmacokinetic (PK) profile potentially arising from the metabolic lability inherent to its chemical structure. To deliver on the promise of KasA as a TB drug target, we disclose a structure-based design campaign that optimized DG167 to arrive at the preclinical drug candidate JSF-3285, demonstrating cidal efficacy in mouse models of acute and chronic M. tuberculosis infection.
Figure 1. Depiction of the Transposition Hypothesis from DG167 to Indoles or Indazoles, Eventually Leading to JSF-3285.

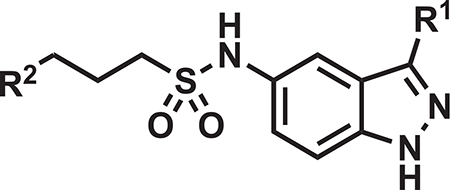
The transposition to either heterocycle would maintain the key interactions of the alkyl sulfonamide moiety and the hydrophobic contacts of the DG167 1-methyl moiety while obviating the metabolic lability of the 1-methyl and introducing hydrogen bonding interactions with Glu120. A 2-substituent has the potential of engaging Glu203. This strategy ultimately led to JSF-3285.
RESULTS
A Structure-Based Approach to Optimize Efficacy and PK Profile
Our central hypothesis was that significant enhancement of the mouse PK profile of DG167 would dramatically improve in vivo efficacy. Rapid demethylation of DG167 in dosed mice or in a mouse liver microsome (MLM) preparation affords a whole-cell inactive N-1H-indazole and results in sub-optimal PK (Kumar et al., 2018). Analysis of our X-ray crystal structure of KasA-DG167 (PDB: 5W2P) (Kumar et al., 2018) suggested that N-1 of the DG167 indazole could be moved in the ring system to the 3-position to engage E120 with or without alteration of N-2 to an sp2-hybridized C and, thus, arrive at transposed indole and indazole analogs, respectively (Figures 1 and S1). The previously synthesized transposed indazole compound 5g demonstrated acceptable in vitro properties and was structurally characterized to bind solely in the DG167A site (Kumar et al., 2018).
Select Indoles Improve upon the In Vitro Profile of DG167 and Target KasA
The syntheses of 3-methyl-1H-indoles were performed via a route featuring a ligand-free copper-catalyzed cascade reaction (Cai et al., 2009) (Figure S2) to afford analogs 5, and 8–11 (Table 1). The parent 3-methyl-1H-indole 4, lacking the 2-substituent (R = H), was synthesized by a Mizoroki-Heck reaction, starting from commercially available 2-bromo-4-nitroaniline and allyl bromide (Hennequin et al., 2003). The in vitro antitubercular activity of the 3-methyl-1H-indoles was quantified through an MIC with the H37Rv laboratory strain of M. tuberculosis via the Alamar blue method (Collins and Franzblau, 1997), while the mammalian cell cytotoxicity was measured as the CC50 (minimum concentration resulting in 50% of growth inhibition) against Vero cells as a model mammalian cell line (Vilcheze et al., 2011) (Tables 1 and S1). Focusing on our design-critical 2-substituent, we found the 2-ethyl ester 5 to exhibit an MIC of 0.20 μM and a Vero cell CC50 > 150 μM. The primary amide 8 demonstrated an MIC of 3.1 μM, while the 2-nitrile analog 9 had an MIC of 0.78 mM along with a Vero cell CC50 of 170 μM. Compound 10––the n-pentyl sulfonamide analog of 9––showed an MIC of 0.2 μM and a Vero cell CC50 = 160 μM. Interestingly, although 9 and 10 did not contain the labile 1-methyl group of DG167, their MLM half-life (t1/2) values were both lower than that of DG167 and were most likely attributable to the oxidation of the indole and alkyl sulfonamide moieties. Their kinetic aqueous solubility values in PBS (pH 7.4) were also lower than that of DG167, although both were above 1 μM (Inoyama et al., 2018).
Table 1.
Key Properties of Select Transposed Indoles
 | ||||||
|---|---|---|---|---|---|---|
| Compound | R1 | R2 | MIC H37Rv (μM) | Vero CC50 (μM) | MLM t1/2 (min) | Kinetic Aqueous Solubility (μM) |
| DG167a | 0.39 | 23 | 10.1 | 324 | ||
| 4 | H | NHSO2-n-Bu | 1.6 | >190 | nd | nd |
| 5 | CO2Et | NHSO2-n-Bu | 0.20 | >150 | <0.5 | 0.895 |
| 8 | CONH2 | NHSO2-n-Bu | 3.1 | >160 | 6.16 | 45.5 |
| 9 | CN | NHSO2-n-Bu | 0.78 | 170 | 6.51 | 133 |
| 10 | CN | NHSO2-n-Pen | 0.20 | 160 | 4.08 | 7.21 |
| 11 | CH2NH2 | NHSO2-n-Bu | 100 | 170 | nd | nd |
nd, not determined.
Kumar et al. (2018) reference.
The 2-nitrile analogs 9 and 10 exhibited further promising in vitro efficacy properties, while avoiding concerns with ethyl ester 5 due to its potential reactivity through hydrolysis and/or addition-elimination reactions. (1) They maintained their in vitro potency versus a set of clinical drug-resistant strains (Vincent et al., 2012; Wilson et al., 2013) of M. tuberculosis (Table S2A), and as expected both were cross-resistant with the parent compound DG167 (Table S3A); (2) both compounds were in vitro bactericidal. This was first assessed by MBC (minimum concentration of compound resulting in >99% reduction in colony-forming units [CFUs] [Xie et al., 2005]) values of 1.4–2.7 μM and 0.65– 1.3 μM, respectively. The kinetics of killing were evaluated versus M. tuberculosis in the presence of 103 MIC of each compound (Figure S3). DG167 and compound 9 similarly exhibited biphasic behavior with >2 log10 reduction in CFUs over 7 days followed by re-growth. For comparison, treatment with INH at 103 MIC initially resulted in >3 log10 reduction in CFU over 4 days with rapid re-growth presumably due to a mixture of persistent and resistant bacteria (Dhar and McKinney, 2007; Ojha et al., 2008; Vilchè ze and Jacobs, 2007). Similar to DG167, 10 in combination with INH (each at 103 MIC) afforded culture sterilization through a proposed synergistic lethality (Malik et al., 2011); and (3) compounds 9 and 10 inhibited the intracellular growth of M. tuberculosis mc26206 within J774.1 cells (Falzari et al., 2005) with IC50 values of 0.19 and 0.078 μM, respectively, similar to INH (IC50 = 0.50 μM) and rifampicin (RIF) (IC50 = 0.30 μM) (Figure S3).
Consistent with their cross-resistance with DG167, compounds 9 and 10 were each found to co-crystallize with KasA and the corresponding X-ray crystal structures were solved to 1.70 and 2.25 Å, respectively (see the STAR Methods for additional details, Table S4). Interestingly, in the KasA-9 electron density map, density existed for an unknown molecule in the substrate binding tunnel (Figure S4). Attempts to individually model into this electron density every compound present in the protein purification and crystallization conditions (including 9) were unsuccessful. Contrary to DG167 (Figures S5A and S5B) but similar to our previously reported transposed indazole 5g, each KasA monomer in the biological dimer bound one molecule of 9 or 10 (Figure 2). Further studies via molecular modeling suggested a clash between the 2-cyano moiety of 9 or 10 with the DG167B site residues Leu116, Ala170, and Ile347 (Figures S5C and S5D). However, the clearly interpretable electron density corresponding to 9 showed it bound in the acyl channel identified as the phospholipid (PL) binding site (Luckner et al., 2009) (Figure 2A). The aliphatic moiety of 9 mimics binding of the PL acyl tail inserting into a relatively hydrophobic pocket (Figures 2B and 2C). The KasA-9 interaction is further stabilized by hydrogen bonds between the sulfonamide N-H and indole N-H of 9 with KasA Glu199 and Glu120, respectively (Figure 2C). In contrast to the structure of KasA-9 (Figure S4), in the KasA-10 structure there was no electron density in the substrate binding tunnel other than that for the inhibitor. Structural alignment of KasA-9 and KasA-10 revealed that the alkyl substituent of the sulfonamide extends 0.9 Å deeper for 10 than for 9 into the acyl tail binding pocket, while the SO2N unit of sulfonamide of 10 is shifted 0.5 Å in the opposite direction (Figures S5E and S5F). Besides these positional differences noted above that result from its additional methyl group, 10 mediates several hydrophobic contacts that 9 does not (Figures 2C and 2E).
Figure 2. X-Ray Crystal Structures of KasA-Compound 9 and KasA-Compound 10.

(A) Left: KasA dimer with one protomer (KasA) rendered as a blue surface and the other protomer (KasA′) rendered as an orange cartoon. The compound 9 molecules are shown as ball and stick models with the sticks colored gray (9A) and red (9B′). Right: expanded view of area enclosed in the yellow rectangle in the left panel.
(B) KasA binding a single molecule of compound 9.
(C) Schematic representation of KasA-compound 9 interactions.
(D) KasA binding a single molecule of compound 10.
(E) Schematic representation of KasA-compound 9 interactions. Molecules are labeled consistently throughout (B–D). KasA is depicted as either a cyan surface or sticks. Compound 9 is depicted as either gray balls-and-sticks or bonds. Compound 10 is depicted as orange balls-and-sticks or bonds. Hydrogen bonds are depicted as dashed lines measured in angstroms. The blue semicircles with radiating lines represent hydrophobic contacts mediated by KasA residues. The interaction schematics in (C) and (E) were produced with LIGPLOT.
Select Indoles Offer Enhanced PK Profiles with at Best In Vivo Bacteriostatic Efficacy
Transposed indoles 9 and 10 were profiled for their pharmacokinetic profile with two CD-1 female mice, each receiving a single 25-mg/kg dose po (Table S5; Figure S6). Both compounds compared favorably to DG167 in terms of maintaining a plasma concentration above the MIC (t > MIC) and compound exposure in the plasma (quantified by area under the curve for a time t; AUC0-t). Compound 10 showed a superior profile, most notably with AUC0–5h/MIC = 260 as compared with 93 for 9 and 20 for DG167. Both compounds exhibited satisfactory mouse and human plasma protein binding and stability values such that plasma protein binding was ≤99% and stability at 5 h was ≥80% (Table S6). The cytochrome P450 inhibition profiles (Table S6) for 9 and 10 were characterized by acceptable IC50 values in excess of 1 μM, except for the cytochrome P450 2C19 IC50 value of 0.542 μM for 10.
Compounds 9 and 10 were studied in a mouse model of acute M. tuberculosis infection (Rao et al., 2013). The dose escalation studies and tolerability studies in CD-1 mice (Table S7) supported dosing of 9 at 100 mg/kg and 10 at 60 and 200 mg/kg. Compounds were dosed qd (once daily) beginning 2 weeks post-infection (t = 0) and bacterial burden was quantified in the lungs and spleen as CFUs at select time points for mice dosed with vehicle only, indole compounds 9 or 10, and INH as a positive control (Figure 3). For both compound 9 and DG167, we observed an increase of about 1 log10 CFU in the lungs in comparison with the respective CFU values at the start of the treatment (t = 14 days). Both compounds 9 and 10 did not reduce the bacterial load in the spleen. Although compound 10 at 100 mg/kg was permissive of bacterial growth in the lungs, a 200-mg/kg dosing regimen led to bacteriostatic activity in the lungs.
Figure 3. Efficacy Studies of Compound 9 at 100 mg/kg and Compound 10 at 60 or 200 mg/kg with Regard to Bacterial Lung Burden.

Controls were vehicle only, DG167 (100 mg/kg), and INH (25 mg/kg). Drug treatment with (A) compound 9 or (B) compound 10 began at day 14. All dosing was po qd (once daily). Each time point for each treatment represents an average from the sampling of the lungs of five mice. Error bars represent the mean ± standard error. Ordinary one-way ANOVA with multiple comparisons displayed significant differences between vehicle control and all individual treatment groups on day 42. All comparisons showed p < 0.0001 except for compound 10 (60 mg/kg) with p = 0.0025. The comparison between pre- treatment (day 14) and day 42 also showed highly significant differences (p < 0.001). The data were plotted and analyzed using GraphPad Prism 8.1.2.
Transposed Indazoles Offer Further In Vitro and PK Profile Enhancements
The lack of cidal efficacy of the indoles in the mouse acute model of M. tuberculosis infection led us to revisit the indazole scaffold, exemplified in our transposition strategy (Figure 1) and in our published compound 5g (Kumar et al., 2018), with a goal of further improving compound PK profile in the mouse. In general, the transposed indazole analogs (Table 2) were synthesized from the corresponding 3-substituted 5-nitro-1H-indazoles (Figure S2). The transposed indazole analogs 5g and 12–20 demonstrated up to 3-fold improvement in antitubercular activity as compared with the original hit, DG167 (Table 2). In general, the transposed indazoles lacked significant Vero cell cytotoxicity relative to their MIC with CC50/MIC values in excess of 10 (Inoyama et al., 2018), except for 3-trifluoromethyl compounds 19 and 20. The kinetic aqueous solubility of 5g and 12–14 were assessed and all except 5g have a desirable S > 100 μM (Inoyama et al., 2018). The MLM stabilities were all below the target value of 1 h (Inoyama et al., 2018). However, 12 and 14 were significantly improved over DG167 (Table 1), with MLM t1/2 values of 28.4 and 32.1 min, respectively. The mouse PK profiles of 5g and 12–17 were obtained (Table 2; Figure S6), and 12 demonstrated the most favorable profile of these indazoles and DG167 (Table S5) based on t > MIC, Cmax, AUC0–5h, AUC0–5h/MIC, as well as exhibiting a satisfactory initial estimate of partitioning between mouse lung and plasma (target value of Clung/Cplasma ~ 1). Some concerns also existed over the potential electrophilicity of the 3-Cl moiety of 14. Compound 12, renamed JSF-3285, was further assessed with liver microsomal preparations from rat, dog, and human, where the t1/2 of 48.2 min and the intrinsic clearance (Clint = 124 μL/min/mg) in the presence of dog liver microsomes were slightly below and above the goal values of 60 min and 10 μL/min/mg protein (Inoyama et al., 2018), respectively. These compound metrics for rat and human microsomes met these goal criteria. In the presence of these microsomal preparations, as well as those derived from mice, mass spectrometry failed to detect loss of the methyl group from JSF-3285 and solely evidenced mono-oxygenation. In vitro profiling was completed by demonstration of a lack of significant in vitro efficacy versus Enterococcus faecium, Staphylococcus aureus, Klebsiella pneumoniae, Pseudomonas aeruginosa, and Enterobacter cloacae strains (MIC >50 μg/mL) (Table S2B) and acceptable levels of mouse and human plasma protein binding and plasma stability (Table S6), human cytochrome P450 inhibition (Table S6), and hERG inhibition (IC50 > 50 μM).
Table 2.
Key Properties of Select Transposed Indazoles
 | |||||||||
|---|---|---|---|---|---|---|---|---|---|
| Compound | R1 | R2 | MIC H37Rv (μM) | Vero CC50(μM) | MLM t1/2(min) | Kinetic Aqueous Solubility (μM) | AUC0–5h (h×ng/mL) | t > MIC (h) | Clung/Cplasma at 5 h |
| 5ga | Me | Me | 0.20 | 94 | 11.5 | 76.8 | 23,003 | 5 | 1.0 |
| 12 (JSF-3285) | Me | CH2F | 0.20 | 170 | 28.4 | 175 | 59,323 | 5 | 0.75 |
| 13 | Me | Et | 0.12 | 89 | 3.26 | 476 | 13,943 | 5 | 1.3 |
| 14 | Cl | Me | 0.39 | 22 | 32.1 | 443 | 51,745 | 5 | 0.60 |
| 15 | Me | CF3 | 0.25 | >160 | nd | nd | 28,361 | 5 | 0.95 |
| 16 | Cl | CF3 | 0.20 | >150 | nd | nd | 21,989 | 5 | 1.2 |
| 17 | Cl | Et | 0.39 | 170 | nd | nd | 34,840 | 5 | 1.7 |
| 18 | Cl | CH2F | 0.20 | 160 | nd | nd | nd | nd | nd |
| 19 | CF3 | Me | 25 | 78 | nd | nd | nd | nd | nd |
| 20 | CF3 | Et | 12 | 37 | nd | nd | nd | nd | nd |
nd, not determined.
A Focus on Further Profiling of JSF-3285 and Demonstration of Its Modulation of KasA
JSF-3285 was active versus mc26206-infected J774.1 cells (IC50 = 0.046 μM) and cidal to the H37Rv strain (Figure S3) through the action of the parent compound, due to the observation of the accumulation of JSF-3285 in M. tuberculosis in the absence of discernible metabolites within 150 atomic mass units via our intrabacterial drug metabolism protocol (Wang et al., 2020). JSF-3285 in combination with INH (each at 10× MIC) afforded culture sterilization through a proposed synergistic lethality observed with DG167 (Malik et al., 2011). JSF-3285 demonstrated whole-cell activity versus a panel of 48 drug-sensitive and drug-resistant clinical strains (Table S2C) comparable with its efficacy versus the H37Rv strain. Consistent with this lack of cross-resistance with front-line drugs and its evolution from DG167, JSF-3285 was, however, cross-resistant with DG167 (Table S3). Spontaneous resistance to JSF-3285 was observed with a frequency of resistance at 4×, 8×, and 16× MIC drug concentrations of 9.3 × 10‒8, 6.2 × 10‒8, and 2.7 × 10‒8, respectively (Table S3). Mutations mapped to kasA, and specifically to residues in or proximal to the flap (V137A, V142L, I145N, and P147L), residues in direct contact with JSF-3285 (E199A and G200A; shown in Figure 4), or residues comprising the KasA-KasA dimer interface (L205P and M277V). JSF-3285 inhibited mycolic acid biosynthesis within M. tuberculosis H37Rv in a dose-dependent fashion (Figure S7). Mycolic acid biosynthesis in the 8 × 5 (G200A) and 16 × 16 (L205P) mutants was similar to that with the wild-type H37Rv strain for the no-drug control (Figure S7). When comparing drug treatment of these two kasA mutants versus the H37Rv strain, mycolic acid biosynthesis was not perturbed with INH exposure, while JSF-3285 mycolic acid biosynthesis was significantly abrogated (Figure S7). JSF-3285 was structurally characterized bound to KasA in an X-ray crystal structure refined to a resolution of 2.30 Å (Figure 4A and Table S4). JSF-3285 and indoles 9 and 10 bound similarly to KasA, with the exception that the JSF-3285 4-fluorobutyl sulfonamide substituent extended deeper into the binding pocket by about 1.2 Å. These inhibitors occupy the protein surface that would otherwise bind the elongating acyl chain before the condensation reaction with malonyl-ACP. This enabled a new hydrophobic interaction with the side chain of Ile202. As determined using microscale thermophoresis, JSF-3285 bound KasA with a Kd = 70.7 ± 23.5 nM (Figure 4C). While the Kd for malonyl-ACP binding to KasA bound to different acyl primers is unknown, apparent Km values for its condensation reaction with a variety of acyl-ACP donors have been reported to range from 2.5 to 13.5 μM (Borgaro et al., 2011; Schaeffer et al., 2001).
Figure 4. Characterization of the Binding of JSF-3285 to KasA through X-Ray Crystallography and MST Assay.

(A) Left: KasA dimer with one protomer (KasA) rendered as a blue surface and the other protomer (KasA′) rendered as an orange cartoon. The JSF-3285 molecules are shown as green and light blue stick models. Right: expanded view of area enclosed in the yellow rectangle in the left panel with one KasA protomer hidden for clarity. Residues that are within 4.0 Å of JSF-3285 are depicted as blue sticks. Black, dashed lines indicate hydrogen bonds between KasA and JSF-3285 measured in angstroms.
(B) Schematic representation of KasA-JSF-3285 interactions. Hydrogen bonds are depicted as dashed lines measured in angstroms. The blue semicircles with radiating lines represent hydrophobic contacts mediated by KasA residues. The schematic was produced with LIGPLOT.
(C) MST quantification for JSF-3285 binding to KasA. JSF-3285 was titrated between 0.0209 and 300,000 nM with 50 nM labeled KasA. JSF-3285 binds to KasA with a Kd = 70.7 ± 23.5 nM. Data presented as the mean ± standard deviation of three independent assays.
JSF-3285 Exhibits Potent and Cidal In Vivo Efficacy
The dose escalation studies and tolerability studies in CD-1 mice (Table S7) supported dosing of JSF-3285 at 100 and 200 mg/kg qd po in the acute infection model with INH (25 mg/kg po) as a positive control. With either dosing regimen, JSF-3285 achieved a ~2 log10 reduction in bacterial burden as quantified in the lungs as CFUs after 4 weeks of treatment as compared with the bacterial burden at the beginning of compound treatment (Figure 5A). In a chronic model of infection, BALB/c mice were inoculated with a low number of bacilli (~60 CFUs) of M. tuberculosis and the infection was allowed to establish over 4 weeks, reaching a plateau of ~106 CFUs in the mouse lungs. The treatment was then initiated and the bacterial burden was quantified in the lungs (Figure 5B) at 1-, 2-, and 4-week time points for mice treated with JSF-3285 (200 mg/kg), JSF-3285 in combination (200 mg/kg and either 10 mg/kg INH or RIF), INH only (10 mg/kg), and RIF only (10 mg/ kg) where all dosing was qd po. RIF was dosed at its standard level for mouse infection studies (de Steenwinkel et al., 2013), while the INH level was reduced from 25 mg/kg (Almeida et al., 2009) to 10 mg/kg in an effort to observe an effect in combination with JSF-3285 at early time points after treatment. JSF-3285 (alone or in combination) reduced the bacterial burden in the mouse lungs by more than 2 log10 CFUs after 4 weeks as compared with the bacterial burden at the start of the treatment. Compared to INH- and RIF-only treatment, JSF-3285 alone was able to reduce the bacterial burden by an additional ~1 log10 CFUs. The addition of JSF-3285 (200mg/kg)to the INH or RIF regimen improved efficacy of the front-line drug by about 1 log10. The improved efficacy in combination with INH was observed after the t = 1 week time point while that with RIF was noted at and beyond 1 week of treatment. Two additional studies were undertaken and confirmed the bactericidal efficacy of JSF-3285 at doses ranging from 200 to 5 mg/kg qd po (Figures 5C and 5D), including arms with JSF-3285 at 20mg/ kg bid po, INH at 10 or 20 mg/kg qd po, and RIF at 10 or 20 mg/kg qd po where bid denotes twice daily dosing (Figure 5C). The INH and RIF controls each afforded ~2 log10 reduction in CFUs. It is particularly important to note that after 4 weeks of treatment as demonstrated in the infected lungs, JSF-3285 exhibited an ~1.5–2.0 log10 reduction in CFUs at doses of 200–5 mg/kg qd, and at 20 mg/kg either qd or bid. The 200–20 mg/kg treatments were not statistically different from each other, while the 20 mg/kg treatment was superior to the 10 and 5 mg/kg treatments.
Figure 5. Efficacy Studies of JSF-3285 Depicting Lung Bacterial Burden in M. tuberculosis Infection Models.

Controls were vehicle (No-drug) only, DG167, INH, and RIF. The infection models were (A) an acute model, (B) a chronic model at 100 and 200 mg/kg, (C) a chronic model at 20–200 mg/kg at t = 56 days (4 weeks of dosing), and (D) a chronic model at 5–20 mg/kg at t = 56 days (4 weeks of dosing). Drug treatment began at day 14 (acute model) or 28 (chronic model). All dosing was orally, and dosing was once daily unless noted otherwise; bid refers to twice daily dosing. Each time point for each treatment represents data from the sampling of the lungs of five mice. Error bars represent the mean ± standard error. Ordinary one-way ANOVA with multiple comparisons displayed significant differences (p < 0.0001) between no-drug control and all individual treatment groups on day 42 (A) and day 56 (B–D). The comparison between pre-treatment (day 14) and day 42 also showed highly significant differences (p < 0.001). With regard to JSF-3285 treatments, in (C) the 200–20-mg/kg arms were not statistically different from each other, while in (D) the 20-mg/kg arm was statistically different from the 5- and 10-mg/kg doses (p < 0.0001).The data were plotted and analyzed using GraphPad Prism 8.1.2.
DISCUSSION
At the initiation of this optimization program, we were challenged o overcome the lack of in vivo efficacy of DG167 as am onotherapy in our mouse acute model of M. tuberculosis infection (Kumar et al., 2018). Abrahams et al. (2016) reported cidal efficacy of DG167, which they named GSK3011724A, in a “fast” and less conservative model with 8 days of drug treatment commencing 1 day after inoculation of 8- to 10-week-old C57BL/6 mice with 1 × 10⁵ CFUs (Rullas et al., 2010). Their quantification of cidality also rested on subtracting the bacterial burden in the mouse lung for the no-drug control arm at t = 8 days from the number of CFUs in the drug-treated mouse lung at t = 8 days. A more conservative definition of bacterial reduction in a TB mouse efficacy model would be our use of the bacterial burden pertinent to the no-drug-treated arm at the beginning of drug treatment. The literature also reports on other M. tuberculosis KasA inhibitors, such as thiolactomycin (Noto et al., 1982; Oishi et al., 1982) and platensimycin (Brown et al., 2009; Wang et al., 2006), but we are unaware of a demonstration of efficacy in an animal model of M. tuberculosis infection for either compound. These shortcomings are most likely attributed to platensimycin’s sub-optimal in vitro efficacy (Brown et al., 2009; Wang et al., 2006) and mouse PK profile (Dong et al., 2017) and the subpar in vitro efficacy (Kim et al., 2006) and rat PK profile (Miyakawa et al., 1982) of thiolactomycin.
We hypothesized that the lack of in vivo efficacy of DG167 in our acute model as a monotherapy was, despite its modest mouse PK profile in terms of t > MIC and AUC0–5h, attributable to very poor MLM stability due to scission of its 1-methyl moiety to afford a whole-cell inactive compound. Since we had shown that replacements of this methyl group with a variety of substituents failed to improve MLM stability and mouse PK, we leveraged our X-ray crystal structure of DG167 bound to KasA. The most significant interactions in our structure were in the DG167A site and, thus, design efforts turned to a hypothesis that the methyl moiety could be transposed in either an indoleor indazole-based analog. Translation from the indazole of DG167 led to transposed indoles 9 and 10 and finally onto transposed indazoles, such as JSF-3285, which also featured exchange of the sulfonamide moiety from n-butyl or n-pentyl to 4-fluorobutyl. This optimization process ultimately afforded significant gains in mouse PK over DG167 (30× in terms of AUC0–5h), provided a decrease in MIC, and also demonstrated an increase in MLM t1/2 (28.4 versus 10.1 min for DG167). This affected the in vivo efficacy significantly in terms of a ~2 log10 reduction in the acute model at 100 or 200 mg/kg qd po. JSF-3285 demonstrated ~1.5–2.0 log10 reductions in CFUs in a mouse model of chronic infection from 200 down to 5 mg/kg qd po. With a downstream view toward consideration of JSF-3285 in a combination therapy, JSF-3285 (200 mg/kg) in the chronic infection model improved the efficacy of INH or RIF by about 1 log10. This effect with INH may stem from the observed synergistic lethality between the two compounds observed in vitro, paralleling that noted with DG167 and INH (Kumar et al., 2018).
The in vivo outcomes of JSF-3285 in the acute and chronic models of infection, especially when the reduction in bacterial load are conservatively calculated, i.e., based on the number of CFUs at the initiation of compound treatment, rigorously validate KasA as a tuberculosis drug target. This is supported by a nanomolar binding constant of JSF-3285 to KasA via MST. An X-ray crystal structure demonstrated JSF-3285 bound solely to a KasA surface corresponding to the DG167A binding site. Drug-resistant mutants arose at frequencies of ~10‒8 and many mapped to residues that localize to the JSF-3285 binding site, the KasA flap, or the KasA dimerization surface. Specifically, mutants E199A and G200A, which are located in the binding site, both confer significant resistance. Whereas mutants located in the flap or dimerization regions, including V137A, V142L, I145N, P147L, and L205P show more variability in their respective resistances. However, some mutations, such as M277V were distal from the JSF-3285 binding site, and may enable resistance by an unknown allosteric mechanism. The frequency of resistance compares favorably with that for the tuberculosis drug bedaquiline (10‒7–10‒8) (Andries et al., 2005). Consistent with their similar KasA binding modes, JSF-3285 was cross-resistant with DG167. JSF-3285 maintained its efficacy versus a panel of 48 clinical drug-sensitive and drug-resistant (MDR and XDR) strains, which further supports the potential for a KasA-targeting therapeutic to treat clinical drug-resistant as well as drug-sensitive M. tuberculosis infections.
SIGNIFICANCE
The data package for JSF-3285 is supportive of its positioning as a promising preclinical candidate. The in vivo efficacy of this transposed indazole sulfonamide in the mouse chronic model of infection at low doses po qd indicates significant potential to impact next-generation tuberculosis drug therapies via the inhibition of KasA. In particular, further studies to assess the clinical potential for JSF-3285 are highly warranted.
STAR★METHODS
LEAD CONTACT AND MATERIALS AVAILABILITY
Further information and requests for reagents may be forwarded to the corresponding author Joel S. Freundlich (freundjs@rutgers.eduF). All unique/stable reagents generated in this study are available from the Lead Contact without restriction.
EXPERIMENTAL MODEL AND SUBJECT DETAILS
Mice
Animal studies were carried out in accordance with the guide for the care and use of Laboratory Animals of the National Institutes of Health, with approval from the Institutional Animal Care and Use Committee (IACUC) of the New Jersey Medical School, Rutgers University, Newark. All animals were maintained under specific pathogen-free conditions and fed water and chow ad libitum, and all efforts were made to minimize suffering or discomfort. Mouse PK studies used 6-week-old female outbred CD-1 mice (Charles River Labs, Wilmington, MA). 9-week-old female BALB/c mice (19–20 g, Charles River Labs, Wilmington, MA) were used for the mouse infection models.
Bacterial Strains, Culture Conditions, Primers, and Plasmids
M. tuberculosis strains were obtained from laboratory stocks, whereas clinical strains were from a collection of clinical isolates from the Special Programme for Research and Training in Tropical Diseases (TDR) established by UNICEF/UNDP/World Bank/WHO Special Programs (Vincent et al., 2012). M. tuberculosis strains were grown at 37°C in Middlebrook 7H9 medium (Becton, Dickinson, Sparks, MD) supplemented with ADS (albumin [0.5 g/liter]-dextrose [0.2 g/liter]-sodium chloride [0.081 g/liter]) and Tween 80 (0.05% [wt/vol]) or tyloxapol (0.05% [wt/vol]) in liquid media or 10% oleic acid-albumin-dextrose-catalase (OADC) (Becton, Dickinson). Middlebrook 7H10 agar (Becton, Dickinson) supplemented with 10% (vol/vol) OADC and 0.5% (vol/vol) glycerol was used to grow strains on solid media.
METHOD DETAILS
Docking Experiments
Docking experiments of 3-methyl-1H-indole compounds were performed using Autodock Vina 1.1.2 (Trott and Olson, 2010). The crystal structure of KasA complexed with DG167 was utilized (PDB: 5W2S) (Kumar et al., 2018). The protein PDBQT file for docking was prepared by first removing the ligand from the PDB file and deleting the solvent molecules. Hydrogens were added, charges were calculated, and non-polar hydrogens were merged using AutoDock Tools 1.5.6-rc3 (Sanner, 1999). Each of the ligands were drawn in ChemDraw (Version 15) and converted to their respective 3D models with their conformational energy minimized using MMFF in Avogadro (v1.2.0). Ligands were similarly prepared for docking by the addition of hydrogens and calculation of the Gasteiger charges using AutoDock Tools. Non-polar hydrogens were merged and active torsions were chosen for each ligand. Exhaustiveness of the search algorithm was set to 20 and all other parameters were set at default choice. The docking experiments were performed on an Intel workstation and the results were analyzed using Accelrys Discovery Studio Visualizer 4.0 and PyMOL 1.8.2.3.
M. tuberculosis MIC Assay
MIC assays were performed in the 96-well format using the microdilution method. MIC assays were performed in 96-well plates using the microdilution Alamar Blue (MABA) method (Cho et al., 2015). Briefly, the drugs were serially diluted in 50 μL of growth media (7H9-ADS) and supplemented 50 mL cultures (diluted 1:1000) of M. tuberculosis grown to an OD595 of 0.2 – 0.3. After incubation for 7 d at 37°C, Alamar Blue cell viability reagent (Thermo Fisher Scientific, Grand Island, NY, USA) was added, the cultures were incubated for another 24 h, and the absorbance was read at 570 nm and normalized to 600 nM per the manufacturer’s instructions.
M. tuberculosis MBC Assay
To determine the minimum bactericidal concentration (MBC) against M. tuberculosis, the bacterial cultures from the 96-well plates used for the compound MIC determination instead of undergoing Alamar Blue addition were re-suspended, serially diluted with sterile PBS and plated on Middlebrook 7H11 plates. CFUs were enumerated following 21 d incubation at 37°C. The MBC was reported as the minimum compound concentration at which a 2 log10 reduction in CFUs was observed as compared to the no-compound control.
M. tuberculosis Killing Kinetics
M. tuberculosis cells (ca. 107 CFU/mL) were subjected to compounds and incubated at 37°C with shaking. Aliquots were drawn at specific time points and total viable counts were determined by dilution plating on 7H10-OADC-agar plates and counting CFUs after 4 weeks of incubation at 37°C.
Vero Cell Cytotoxicity Assay
Summarily, a CC50 was determined to be the amount of compound that inhibited Vero cell growth by 50%. A typical compound concentration range was 150 – 1.56 μM. Vero cell viability was assessed using the MTT assay (Mosmann, 1983).
Physiochemical and ADME Profiling
This set of assays was performed by BioDuro, Incorporated. Liver microsomal stability was determined via the following protocol. Working solutions of test compound were prepared in DMSO and diluted to a final concentration of 100 μM in 50 mM phosphate buffer (pH 7.4). Aliquots of mouse, human, rat, and dog liver microsome working solution were transferred into Eppendorf tubes using a multichannel pipette. Positive control (midazolam) and test compound working solutions were transferred into the tubes. The mixtures were vortexed gently and then pre-incubated at 37°C. Buffer with or without 5 mM NADPH was aliquoted into the tubes using a multichannel pipette and vortexed gently. At each time point of 0, 5, 15, 30, and 60 min with NADPH or 0, 30, and 60 min without NADPH, terfenadine/tolbutamide in acetonitrile/MeOH (1:1 v/v) was added to the reaction mixture to quench and precipitate the microsomal incubations. Samples were capped and vigorously vortexed and then centrifuged at 4°C. An aliquot of each supernatant was transferred for LC-MS/MS analysis. The MS detection was performed by using a SCIEX API 4000 QTRAP instrument. Each compound was analyzed by reverse-phase HPLC using a Kinetex 2.6μ C18 100Å column (3.0 mm X 30 mm, Phenomenex) with the mobile phase consisting of solvent A: water with 0.1% formic acid, solvent B: acetonitrile with 0.1% formic acid. The amount of parent compound was determined on the basis of the peak area ratio (compound area to internal standard area) at each time point, enabling the determination of the compound half-life, t1/2. The estimation of Clint (in μL/min/mg protein) was calculated using Equation 1:
| (Equation 1) |
Kinetic aqueous solubility was quantified by the following approach. Dilutions of test compound solution were prepared in DMSO. 4 μL of each dilution of the test compound in DMSO was added to 396 μL of the universal aqueous buffer (pH = 7.4; 45 mM ethanolamine, 45 mM KH2PO4, 45 mM potassium acetate, 75 mM KCl) to afford a final DMSO concentration ranging between 0.002 mM and 200 μM. Three replicates of each test compound were prepared per concentration. After 4 h shaking at rt, the mixture was further incubated without shaking for 30 min at rt and then was filtered. The filtrate was diluted 10x and 30x with DMSO before LC-MS/MS analysis. Standard solutions were prepared as follows: stock solutions were diluted to ten defined concentration points from 60 μM to 0.002 μM with DMSO. Aliquots of samples and standard solutions were filtered and mixed with acetonitrile/H2O, then vortexed and used for LC-MS/MS analysis. The MS detection was performed by using a SCIEX API 4000 QTRAP instrument. Each compound was analyzed by reverse-phase HPLC using a Kinetex 2.6μ C18 100 Å column (3.0 mm X 30 mm, Phenomenex) with the mobile phase consisting of solvent A: water with 0.1% formic acid, solvent B: acetonitrile with 0.1% formic acid. The amount of parent compound was determined on the basis of the peak area ratio (compound area to internal standard area) for each time point. The solubility of the test compound was determined based on the largest calculated concentration amongst the samples.
Mouse and human plasma protein binding and stability were measured with the following procedure. Working solutions (1 mM in DMSO) were prepared for each test and control compound. The dosing solutions were prepared by diluting the working solutions to 5 μM in plasma. The dialysis plate was prepared by adding buffer to one chamber and dosing solution to the other chamber. The plate was sealed with an adhesive film and incubated at 37°C while shaking for 5 h. Equal volumes of post dialysis samples were removed from both the plasma and the buffer chambers and placed in separate microcentrifuge tubes and equal volumes (50 μL) of fresh phosphate buffer and plasma were added to the tubes, respectively. Plasma samples were diluted 5-fold and then all samples were treated with quenching solution (terfenadine/tolbutamide in 1:1 v/v methanol/acetonitrile). Sample mixtures were then centrifuged, and the supernatant was subjected to LC-MS/MS analysis. To assess plasma stability, aliquots of dosing solution were stored at 4°C (t = 0 h sample) and at 37°C for 5 h (t = 5 h sample). Following incubation, aliquots were subjected to LC-MS/MS analysis. The MS detection was performed by using a SCIEX API 4000 QTRAP instrument. Each compound was analyzed by reverse-phase HPLC using a Kinetex 2.6μ C18 100 Å column (3.0 mm X 30 mm, Phenomenex) with the mobile phase consisting of solvent A: water with 0.1% formic acid, solvent B: acetonitrile with 0.1% formic acid. The amount of parent compound was determined on the basis of the peak area ratio (compound area to internal standard area) for each time point. The percent plasma protein binding was calculated according to Equation 2, where Cpe is the concentration of test compound in plasma at equilibrium and Cb is the concentration of test compound in buffer at equilibrium, and the percent plasma stability was determined via Equation 3:
| (Equation 2) |
| (Equation 3) |
Human cytochrome P450 inhibition was assayed via the following methodology. Pooled human liver microsomes were used as the enzyme source, and phenacetin (CYP1A2, 10 μM), diclofenac (CYP2C9, 10 μM), omeprazole (CYP2C19, 0.5 μM), dextromethorphan (CYP2D6, 5 μM), and midazolam (CYP3A4, 5 μM) as probe substrates. The assay mixture (200 μL total volume) contained test compound (each with final concentrations in the 0 – 50 μM range) and human liver microsomes (final concentration of 0.25 mg protein per mL) with or without NADPH (final concentration of 1.0 mM) in 100 mM phosphate buffer (pH 7.4). After a 20 min incubation at 37°C, the mixture was quenched by adding 300 μL of methanol/acetonitrile (1:1 v/v) containing terfenadine and tolbutamide. The sample was then centrifuged at 4,000 rpm for 15 min at 4°C. 100 μL supernatant was subjected to LC-MS/MS analysis. The MS detection was performed by using a SCIEX API 4000 QTRAP instrument. Each compound was analyzed by reverse-phase HPLC using a Kinetex 2.6μ C18 100 Å column (3.0 mm X 30 mm, Phenomenex) with the mobile phase consisting of solvent A: water with 0.1% formic acid, solvent B: acetonitrile with 0.1% formic acid. The amount of parent compound was determined on the basis of the peak area ratio (compound area to internal standard area) for each time point. Residual enzyme activity was monitored by measuring area ratio with respect to the internal standard of the corresponding metabolite for each substrate. The IC50 was fit using the GraphPad Prism software program (version 6.0) according to Equation 4:
| (Equation 4) |
where [I] and P are inhibitor concentration and Hill slope, respectively.
Intrabacterial Drug Metabolism (IBDM) Assay
An M. tuberculosis culture was grown to mid-log phase (OD595 = 0.6; ~2×10⁸ CFU/mL) in 7H9+ADS+tyloxapol for each compound treatment at a desired concentration. After 24 h, the cell pellet was harvested by centrifugation (10,000 rpm for 10 min at 4°C). The washed pellet was quenched with CH3CN/CH3OH/water (2:2:1) pre-chilled on dry ice, followed by lysis via bead beating (6.5 m/s, 30 s, 6 times). The sample was chilled on ice for 2 min to avoid overheating in between each round of bead beating. The pellet metabolite extract in organic solvent was collected via 0.22 μm filtration. After a proper decontamination process, both culture supernatant and pellet extract were brought out of the BSL-3 for further analysis. An Agilent 1260 HPLC coupled with an Agilent 6120 quadrupole mass spectrometer was typically applied for analyses. Metabolites were separated on a Chromolith SpeedRod column with a gradient of H2O and acetonitrile acidified with 0.1% formic acid. The mass resolution ranged from 10 to 2000 Da with an accuracy of ± 0.13 Da within the calibrated mass range in scan mode. After extraction and purification of a certain metabolite from cell lysate, its structure was confirmed by comparison of its 1H NMR spectrum (Bruker Avance 500 MHz spectrometer), LC-MS spectrum (Agilent 6120 single quadrupole LC/MS system) and high-resolution mass (Agilent 6220 accurate-mass time-of-flight or Thermo LTQ Orbitrap XL) with those for an authentic/independently synthesized sample. Signal intensity was quantified by standard curve for an authentic/ independently synthesized sample, and normalized by sample protein concentration determined via the Pierce BCA protein assay kit.
Resistant Mutant Generation and Sequencing of kasA
M. tuberculosis H37Rv cells (~3×10⁸) were plated on 7H10-Agar-OADC plates containing 4x, 8x or 16x MIC of JSF-3285 and incubated for 3 weeks at 37°C. The frequency of resistance was determined by dividing the number of colonies appearing at each drug concentration by the M. tuberculosis CFUs plated. The genomic DNA was isolated (van Soolingen et al., 1991) and the kasA ORF was PCR amplified using kasA-CP-Fwd and kasA-CP-Rev primers and AccuPrime Pfx Supermix (ThermoFisher Scientific) and subjected to Sanger sequencing (Macrogen, USA) to determine single nucleotide polymorphisms (SNPs) in kasA.
KasA Complex Protein Purification, Crystallization, and Diffraction Data Collection
KasA was purified as previously described (Kumar et al., 2018). KasA-9 complex crystals were produced by first incubating at 25°C for 30 min a mixture containing 4.7 mg/mL of KasA, 1 mM compound 9, and 1% DMSO. After incubation, crystals were obtained via the vapor diffusion method at 20°C using hanging drops mixed 1:1 with mother liquor containing 200 mM NaCl, 6% isopropanol, and 1 mM Tris(2-carboxyethyl)phosphine hydrochloride (TCEP HCl). Crystals for the KasA-10 and KasA-JSF-3285 complexes were obtained in a similar manner except that 120 μM of either compound 10 or JSF-3285 was incubated with 4.7 mg/mL of KasA. After 48 h, crystals were placed in the same solution supplemented with 25% glycerol and either 1 mM compound 9, 120 μM compound 10, or 120 μM of JSF-3285, immediately removed from the solution, and then flash-cooled in liquid nitrogen. X-ray diffraction data were collected using single crystals mounted in nylon loops that were then flash-cooled in liquid nitrogen before data collection in a stream of dry N2 at 100 K. Data sets were collected at the Stanford Synchrotron Radiation Lightsource (SSRL) beamline 9–2 at 0.88557 Å for KasA-9 and 0.97946 Å for both KasA-10 and KasA-JSF3285 with a Dectris Pilatus 6M detector. X-ray data were processed using HKL2000 (Otwinowski and Minor, 1997). Crystallographic phases were determined by molecular replacement using Phaser (McCoy et al., 2007) and our previously determined structure of apo KasA (PDB Code: 5W2O) as a search model (Kumar et al., 2018). Models were generated using iterative cycles of model building in Coot (Emsley et al., 2010) and refinement in phenix.- refine (Adams et al., 2010). Initial refinement included simulated annealing as well as rigid body, individual atomic coordinate, and individual B-factor refinement. Later rounds of refinement employed individual atomic coordinate, individual B-factor, and TLS refinement. TLS groups were selected using the TLSMD server (Painter and Merritt, 2006). During the final rounds of refinement, the stereochemistry and ADP weights were optimized. Compounds 9 and 10, JSF-3285, and water molecules were included only after the KasA models were complete. Insufficient electron density was observed for residues 1–25 and they were omitted from the model. One sodium atom was built into clear electron density during the final stages of refinement. Ramachandran statistics were calculated in Molprobity (Lovell et al., 2003). Molecular graphics were produced with PyMOL 1.8.2.3 (Delano, 2002).
Microscale Thermophoresis Binding Assay
Prior to labeling, His-KasA was diluted from 120 μM to 22 μM in Buffer A (500 mM NaCl, 20 mM CHES pH 9.5). The diluted His-KasA was labeled using the RED-NHS Labeling kit and buffer exchanged into Buffer B (150 mM NaCl, 10 mM HEPES pH 7.4; NanoTemper Technologies). 100 nM working stocks of labeled protein were made consisting of Buffer B supplemented with 0.2% Pluronic F-127. Threefold titrations of JSF-3285 in 2% DMSO were made, transferred by pipet into separate Eppendorf tubes, and incubated with equal volumes of 100 nM working stock solutions of labeled protein in the dark for 30 min at rt. After incubation, the samples were transferred into Premium Coated Capillaries (NanoTemper Technologies) and read in a Monolith NT.115 Nano-BLUE/RED Instrument at rt using 60% LED and 60% MST power. Binding affinities were calculated from triplicate data analyzed by the MO.Affinity Analysis software v2.3 (NanoTemper Technologies).
Mycolic Acid Biosynthesis Analysis
The mycolic acid methyl esters (MAMEs) and fatty acid methyl esters (FAMEs) (56) were assayed using a previously published protocol (Wilson et al., 2013). The compounds were added to 5 mL M. tuberculosis cultures (OD595 ~ 0.3 – 0.4) that were incubated at 37°C for 2 h. 1 μCi/mL of [14 C]acetate (56 mCi/mmol) was added to each culture, followed by incubation at 37°C for an additional 4 h. The 14C-labeled cells were pelleted by centrifugation, resuspended in 2 mL of tetra-n-butylammonium hydroxide, and incubated overnight at 100°C to hydrolyze cell wall-bound lipids. The fatty acids were esterified via addition of a 6 mL 2:1 CH2Cl2/H2O solution of iodomethane (3 mL). Insoluble material was removed through centrifugation and the organic phase was dried and dissolved in 200 μL CH2Cl2. Equal counts (20,000 cpm) were loaded on a silica gel 60 F254 thin-layer chromatography (TLC) plate and resolved using hexane/ethyl acetate (19:1 v/v, 2 runs). The FAMEs and MAMEs were detected by phosphorimaging.
Pharmacokinetic Profiling
Female outbred CD-1 mice (23 – 29 g) were weighed and treated via oral gavage with the appropriate single dose of test compound. Initial 5 h PK studies involved dosing compound as a solution using a 5% DMA/60% polyethylene glycol 300/35% (5% dextrose in water). Subsequent dose escalation studies were formulated as suspensions with 0.5% carboxymethyl cellulose (CMC)–0.5% Tween 80. Sequential bleeds were collected at the appropriate time intervals (up to and including 24 h) post-dose via the tail snip method. Blood (50 μL) was collected in capillary microvette EDTA blood tubes and maintained on ice before centrifugation at 1500g for 5 min. The supernatant (plasma) was transferred into a 96-well plate and stored at -80°C. In a dose escalation study, mice were dosed with various increasing doses of test compound, and blood was similarly sampled and processed.
Quantitative Analysis
Test compound levels in plasma were measured by LC-tandem MS (LC-MS/MS) in ESI mode on a Sciex Qtrap 4000 triple-quadrupole MS system combined with an Agilent 1260 HPLC using Analyst software. Chromatography was performed with an Agilent Zorbax SB-C8 column (2.1 by 30 mm; particle size, 3.5 μm) using a reverse-phase gradient elution. A mixture of 0.1% formic acid–Milli-Q deionized water was used for the aqueous mobile phase and 0.1% formic acid–acetonitrile (ACN) for the organic mobile phase. Multiple-reaction monitoring (MRM) of parent/daughter transitions in positive electrospray ionization (ESI) mode was used to quantify test compound. A 1 mg/mL DMSO stock of test compound was serial diluted in 50/50 ACN/Water and subsequently diluted in blank K2EDTA (dipotassium ethylenediaminetetraacetic acid) plasma (Bioreclammation) to create standard curves and quality control samples. Test compound was extracted by combining 20 μL of spiked plasma or study samples and 200 μL of acetonitrile/methanol (50/50) protein precipitation solvent containing 20 ng/mL verapamil internal standard (IS). Extracts were subjected to vortex mixing for 5 min and centrifuged at 4,000 rpm for 5 min. The supernatants were analyzed by LC-MS. Verapamil IS was sourced from Sigma-Aldrich. MRM transition values of 455.4 and 165.2 for verapamil. The sample analysis results were accepted if the concentrations of the quality control samples were within 20% of the nominal concentration.
Drug Tolerability Study
Five mice were dosed orally daily for 5 d with test compound at the appropriate dose, formulated in 0.5% CMC–0.5% Tween 80. The mice were weighed and observed daily. Their behavior, drinking and feeding patterns, and feces characteristics were monitored and recorded. Upon necropsy, liver, gallbladder, kidney, and spleen pathology were observed as well.
Intracellular Infection Assay
J774A.1 cells, purchased from the American Type Culture Collection (ATCC, Manassas, VA) (TIB-67), were cultured in Dulbecco’s modified Eagle’s medium (DMEM; Sigma) supplemented with 10% fetal bovine serum (Sigma). 2.5 × 10⁴ cells/well were seeded into white 96-well clear flat-bottom white tissue culture plates 24 h prior to infection. M. tuberculosis (mc26206) expressing luciferase was grown to mid-log phase, washed with Dulbecco’s PBS (DPBS; Sigma), and diluted in DMEM supplemented with 10% fetal bovine serum, pantothenic acid, and leucine. The bacterial suspension was added to macrophages at multiplicity of infection of 1. After 4 h of incubation at 37°C in 5% CO2, macrophages were treated with 50 μg/mL gentamicin for 1 h and washed twice to remove extracellular bacteria. Finally, 100 μL of drug diluted in DMEM supplemented with 10% fetal bovine serum, pantothenic acid, and leucine was added to each well. After 48 h past drug addition, inhibition of intracellular survival and growth were determined respectively by CFU counting and by measuring luciferase activity with a luminometer.
Mouse Efficacy Models
Acute Model
BALB/c mice (9-week-old females; weight range, 18 – 20 g) were infected with an inoculum of M. tuberculosis H37Rv mixed with 5 mL of phosphate-buffered saline (PBS) (3×10⁶ CFU/mL) using a Glas-Col whole-body aerosol unit. This afforded a lung implantation of ~ 2.0 log10 CFU per mouse. Groups of 5 mice were sacrificed by cervical dislocation at the start of treatment (2 week post-infection) and after receiving test compound at the appropriate dose, INH at 25 mg/kg, or the vehicle only daily at specific time points up to 28 d. Whole lungs were homogenized in 5 mL of PBS containing 0.05% Tween 80 and CFUs were quantified by plating serial dilutions of homogenates onto Middlebrook 7H11 agar with OADC. Colonies were counted after at least 21 d of incubation at 37°C. The data were plotted, and statistical analysis was performed using GraphPad Prism 7. Significance was determined using the Kruskal-Wallis test and one-way analysis of variance (ANOVA) for multiple comparisons to generate P values.
Chronic Model
The acute infection model was adapted such that treatment arms did not begin until 28 d post-infection.
Synthetic Chemistry
All reaction reagents were purchased from Sigma-Aldrich, Acros, Alfa Aesar, Tokyo Chemical Industry (TCI), or Fisher Scientific. The reaction solvents were obtained from either Sigma-Aldrich, Fisher Scientific, or Acros. Whenever required, reactions were conducted under a nitrogen atmosphere and anhydrous solvents were utilized. NMR spectra of the synthesized compounds were obtained on an Avance 500 MHz spectrometer from the Bruker Corporation (Billerica, MA, USA). Mass spectral data were obtained at low resolution on an Agilent 6120 single quadrupole LC/MS system and at high-resolution on an Agilent 6220 accurate-mass time-offlight system. All compounds for biological testing exhibited the expected NMR data, an LC purity at 250 nm ≥ 95%, and the expected mass spectral data. Reverse-phase high performance liquid chromatography (HPLC) and electrospray ionization (ESI) mass spectra were conducted on an Agilent 6120 single quadrupole LC/MS system using a reverse-phase EMD Millipore Chromolith SpeedRod RP-18e column (50 × 4.6 mm). Generally, a 10 – 100% gradient of acetonitrile/water containing 0.1% formic acid was implemented for the analysis of the samples. All compounds were purified to ≥95% peak area (i.e., purity) via an HPLC UV trace at 220 nm or 250 nm with observation of a low-resolution MS m/z consistent with each compound. Purification of samples by flash chromatography was run on a Teledyne ISCO CombiFlash Rf+ system using a Teledyne RediSep normal phase silica gel column. For TLC, aluminum plates coated by silica gel 60 with F254 fluorescent indicator from EMD Millipore were utilized. Preparative reverse-phase HPLC was conducted on a Varian (now Agilent) SD-1 preparative HPLC system equipped with an Agilent Pursuit (10 μm, 250 × 21.2 mm) C-18 column with detection UV wavelength set at 220 nm or 250 nm. A gradient of acetonitrile in water at a flow rate of 20 mL/min was used for the separation.
Synthesis of 2’-bromo-5’-amino-acetophenone (Figure S2A)
To a solution of 3’-aminoacetophenone (2.00 g, 14.8 mmol) in 15 mL dry DMF was added dropwise a 15 mL DMF solution of freshly recrystallized N-bromosuccinimide (2.63 g, 14.8 mmol). The reaction was monitored by LC/MS and the addition of N-bromosuccinimide solution was stopped once the starting material was consumed. The reaction was diluted with EtOAc and washed 3 times with saturated aqueous NaHCO3 solution, followed by a wash with saturated aqueous brine solution. The organic phase was dried over anhydrous Na2SO4 and concentrated in vacuo to a crude oil. The crude product was purified via silica gel flash column chromatography using a gradient of 5 – 70% EtOAc/hexanes to afford the product as a white crystalline solid (2.56 g, 12.0 mmol, 81.1%): 1H NMR (500 MHz, d6-DMSO) δ 7.25 (d, J = 8.6 Hz, 1), 6.74 (s, 1), 6.63 – 6.55 (m, 1), 5.50 (s, 2), 2.51 (s, 3). Calculated for C8H9BrNO (M+H)+ = 214.0, 216.0; Observed 214.0, 216.0.
Synthesis of tert-butyl (3-acetyl-4-bromophenyl)carbamate (Figure S2A)
A solution of 2’-bromo-5’-amino-acetophenone (2.55 g, 11.9 mmol) in 35 mL dry 1,4-dioxane was subjected to the addition of Boc2O (3.64 g, 16.7 mmol). The reaction was heated to 90°C and stirred overnight. The reaction was concentrated and purified by silica gel flash column chromatography using a gradient of 0 – 35% EtOAc in hexanes to yield the product as a white solid (3.14 g, 9.99 mmol, 84.0%): 1H NMR (500 MHz, CDCl3) δ 7.55 (d, J = 2.4 Hz, 1), 7.49 (d, J = 8.7 Hz, 1), 7.30 (dd, J = 8.7, 2.5 Hz, 1), 6.53 (s, 1), 2.62 (s, 3), 1.51 (s, 9). Calculated for C13H15BrNO3 (M-H)- = 312.0, 314.0; Observed 312.0, 314.0.
Synthesis of ethyl 5-((tert-butoxycarbonyl)amino)-3-methyl-1H-indole-2-carboxylate (Figures S2A and S2A1)
A sealed vial containing tert-butyl (3-acetyl-4-bromophenyl)carbamate (3.10 g, 9.87 mmol), CuI (376 mg, 1.97 mmol), and Cs2CO3 (6.43 g, 19.7 mmol) was degassed with N2 for 30 min. A solution of ethyl isocyanoacetate (1.19 mL, 10.9 mmol) in 20 mL dry DMSO was added to the vial and the reaction vessel was screw sealed. The reaction was heated to 100°C for 24 h. The reaction was then diluted 10-fold with EtOAc and washed 3 times with saturated aqueous NaHCO3 solution, followed by a wash with saturated aqueous brine solution. The organic phase was dried over anhydrous Na2SO4 and concentrated in vacuo to a crude oil. The product was purified by silica gel flash column chromatography using a gradient of 5 – 35% EtOAc/hexanes to provide the product as a white solid (2.85 g, 90.7% yield): 1H NMR (500 MHz, d6-DMSO) δ 11.3 (s, 1), 9.17 (s, 1), 7.80 (s, 1), 7.32 – 7.16 (m, 2), 4.33 (q, J = 7.0 Hz, 2), 2.48 (s, 3), 1.49 (s, 9), 1.35 (d, J = 7.0 Hz, 3). Calculated for C17H21N2O4 (M-H)- = 317.1; Observed 317.2.
Synthesis of ethyl 5-amino-3-methyl-1H-indole-2-carboxylate (Figures S2A and S2A2)
Trifluoroacetic acid (5 mL) was added dropwise to a vigorously stirring solution of 1 (2.85 g, 8.99 mmol) in 45 mL dichloromethane. The reaction was stirred at rt for 3 h and no starting material was remaining based on LC/MS analysis. The reaction was neutralized with saturated aqueous NaHCO3 solution until the pH of the aqueous layer was approximately 8. The DCM layer was collected and the remaining aqueous phase was extracted with twice with EtOAc. The organic fractions were pooled and washed with saturated aqueous brine solution. The organic phase was dried over anhydrous Na2SO4 and concentrated in vacuo to give the desired product as an off-white solid (1.88 g, 97%): 1H NMR (500 MHz, d6-DMSO) δ 11.0 (s, 1), 7.12 (d, J = 8.6 Hz, 1), 6.69 (d, J = 8.6 Hz, 1), 6.67 (s, 1), 4.64 (s, 2), 4.30 (q, J = 7.0 Hz, 2), 2.42 (s, 3), 1.34 (t, J = 7.1 Hz, 3). Calculated for C12H15N2O2 (M+H)+ = 219.1; Observed 219.2.
Synthesis of ethyl 5-(butylsulfonamido)-3-methyl-1H-indole-2-carboxylate (5)
To compound A2 (1.88 g, 8.61 mmol) in 30 mL dry acetonitrile was added 2,6-lutidine (20.0 mL, 17.2 mmol) and the mixture was cooled to 0°C. 1-butanesulfonyl chloride (1.56 mL, 12.0 mmol) was added dropwise and the reaction was stirred overnight. The reaction was quenched by the addition of 1 mL distilled/ deionized water and then concentrated in vacuo to a brown oil. The oil was taken up in 100 mL EtOAc and washed with saturated aqueous NH4Cl solution, followed by washes with saturated aqueous NaHCO3 solution, and saturated aqueous brine solution. The organic phase was dried over anhydrous Na2SO4 and concentrated in vacuo to a brown solid. The product was purified by flash column chromatography using a gradient of 5 – 50% EtOAc/hexanes to give the product as an off-white solid (2.67 g, 91.6%): 1H NMR (500 MHz, d6-DMSO) δ 11.5 (s, 1), 9.46 (s, 1), 7.44 (s, 1), 7.37 (d, J = 8.7 Hz, 1), 7.17 (d, J = 8.8 Hz, 1), 4.34 (q, J = 7.0 Hz, 2), 3.02 – 2.92 (m, 2), 2.50 – 2.48 (s, 3), 1.70 – 1.61 (m, 2), 1.40 – 1.28 (m, 5), 0.83 (t, J = 7.3 Hz, 3). Calculated for C16H23N2O4S (M+H)+ = 339.1; Observed 339.2.
Synthesis of 5-(butylsulfonamido)-3-methyl-1H-indole-2-carboxylic acid (6)
To a solution of 5 (2.67 g, 7.90 mmol) in 35 mL 1,4-dioxane was added 15 mL of an aqueous solution of LiOH (1.32 g, 31.6 mmol). The reaction was heated to 70°C and stirred overnight. The mixture was cooled in an ice bath and 5.2 mL of 6N HCl(aq) was added slowly to acidify the reaction. The solution was decanted into ice cold water and the off-white precipitate was collected by filtration to afford product as a light-brown solid (2.48 g, >99.9%): 1H NMR (500 MHz, d6-DMSO) δ 12.9 (s, 1), 11.4 (s, 1), 9.44 (s, 1), 7.43 (s, 1), 7.34 (d, J = 8.7 Hz, 1), 7.15 (d, J = 8.8 Hz, 1), 3.02 – 2.91 (m, 2), 2.48 (s, 3), 1.71 – 1.61 (m, 2), 1.38 – 1.29 (m, 2), 0.83 (t, J = 7.3 Hz, 3). Calculated for C14H19N2O4S (M+H)+ = 311.1; Observed 311.2.
Synthesis of N-(2-(hydroxymethyl)-3-methyl-1H-indol-5-yl)butane-1-sulfonamide (7)
Compound 6 (50.0 mg, 0.148 mmol) in 3 mL dry THF under N2 was cooled to 0°C. A 1 M THF solution of LiAlH4 was added dropwise to the reaction which was then stirred for 1 h at 0°C. To the reaction were added a few drops of water and 0.5 mL 1 N NaOH(aq). The resulting precipitate was removed by filtration. The filtrate was concentrated and diluted with EtOAc. The organic phase was washed with 1 N HCl(aq) followed by a wash with saturated aqueous brine solution. The EtOAc layer was dried over anhydrous Na2SO4 and concentrated to a crude reaction product that was purified by preparative TLC using 5% MeOH in dichloromethane to give product as an off-white solid (16 mg, 37%): 1H NMR (500 MHz, d6-DMSO) δ 10.8 (s, 1), 9.26 (s, 1), 7.26 (s, 1), 7.23 (d, J = 8.5 Hz, 1), 6.94 (d, J = 8.5 Hz, 1), 5.08 (t, J = 5.3 Hz, 1), 4.57 (d, J = 5.3 Hz, 2), 2.95 – 2.86 (m, 2), 2.17 (s, 3), 1.71 – 1.60 (m, 2), 1.37 – 1.28 (m, 2), 0.83 (t, J = 7.3 Hz, 3). Calculated for C14H21N2O3S (M+H)+ = 297.1; Observed 297.2.
Synthesis of pentafluorophenyl 5-(butylsulfonamido)-3-methyl-1H-indole-2-carboxylate (Figures S2A and S2A3)
Compound 6 (241 mg, 0.774 mmol), 1-ethyl-3-(3-dimethylaminopropyl)carbodiimide hydrochloride (149 mg, 0.774 mmol), and pentafluorophenol (157 mg, 0.855 mmol) were all dissolved in 12 mL dry dichloromethane. The reaction was stirred at rt under a N2 atmosphere overnight. The reaction was diluted 10-fold with dichloromethane and washed with saturated NH4Cl(aq), followed by a wash with saturated aqueous brine solution. The organic phase was dried over anhydrous Na2SO4, concentrated in vacuo, and purified by silica gel flash column chromatography using a gradient of 0 – 30% EtOAc/hexanes to afford the product as a white crystalline solid (343 mg, 93.0%): 1H NMR (500 MHz, d6-DMSO) δ 12.1 (s, 1), 9.60 (s, 1), 7.54 (s, 1), 7.46 (d, J = 8.8 Hz, 1), 7.30 (d, J = 8.8 Hz, 1), 3.06 – 2.97 (m, 2), 2.59 (s, 3), 1.71 – 1.62 (m, 2), 1.40 – 1.29 (m, 2), 0.83 (t, J = 7.3 Hz, 3). Calculated for C20H18F5N2O4S (M+H)+ = 477.1; Observed 477.0.
Synthesis of 5-(butylsulfonamido)-3-methyl-1H-indole-2-carboxamide (8)
To the pentafluoro ester A3 (1.81 g, 3.81 mmol) in 30 mL 1,4-dioxane was added 4.1 mL aqueous ammonia (61 mmol). The reaction was heated to 60°C and stirred overnight. The reaction was cooled to rt and concentrated in vacuo. The crude residue was taken up into EtOAc and washed three times with saturated NH4Cl(aq) solution, followed by a saturated aqueous brine solution wash. The organic phase was dried over anhydrous Na2SO4, filtered, and precipitate formed slowly from a concentrated EtOAc solution. The precipitate was collected by filtration to give product as a white solid (1.08 g, 91.6%): 1H NMR (500 MHz, d6-DMSO) δ 11.2 (s, 1), 9.40 (s, 1), 7.41 (br s, 1), 7.40 (s, 1), 7.34 (d, J = 8.6 Hz, 1), 7.28 (br s, 1), 7.11 (d, J = 8.6 Hz, 1), 2.99 – 2.90 (m, 2), 2.45 (s, 3), 1.72 – 1.60 (m, 2), 1.33 (dt, J = 14.3, 7.2 Hz, 2), 0.83 (t, J = 7.3 Hz, 3). Calculated for C14H20N3O3S (M+H)+ = 310.1; Observed 310.0.
Synthesis of N-(2-cyano-3-methyl-1H-indol-5-yl)butane-1-sulfonamide (9)
To a solution of 8 (1.05 g, 3.39 mmol) in 25 mL dry chloroform was added POCl3 (6.3 mL, 68 mmol). The reaction was heated to 80°C overnight and cooled to rt. The reaction mixture was concentrated in vacuo and dissolved in 200 mL EtOAc. The organic phase was washed 6 times with saturated NaHCO3(aq) to quench residual POCl3 and then rinsed once with saturated aqueous brine solution. The organic phase was dried over anhydrous Na2SO4 and concentrated in vacuo to provide a brown residue. The crude product was purified by silica gel flash column chromatography using a gradient of 0 – 70% EtOAc/hexanes to afford the product as a white solid (757 mg, 76.6%): 1H NMR (500 MHz, d6-DMSO) δ 12.0 (s, 1), 9.57 (s, 1), 7.44 (s, 1), 7.40 (d, J = 8.8 Hz, 1), 7.24 (d, J = 8.7 Hz, 1), 3.03 – 2.90 (m, 2), 2.39 (s, 3), 1.71 – 1.59 (m, 2), 1.39 – 1.26 (m, 2), 0.83 (t, J = 7.2 Hz, 3). Calculated for C14H17N3O2SNa (M+Na)+ = 314.0939; Observed 314.0965.
Synthesis of N-(2-cyano-3-methyl-1H-indol-5-yl)pentane-1-sulfonamide (10)
Synthesized following same procedures for 9 using the pentanesulfonamide analog of 8. White solid obtained in 81.0% yield (1.51 g): 1H NMR (500 MHz, d6-DMSO) δ 12.0 (s, 1), 9.56 (s, 1), 7.44 (d, J = 2.0 Hz, 1), 7.39 (d, J = 8.8 Hz, 1), 7.24 (dd, J = 8.8, 2.0 Hz, 1), 3.01 – 2.92 (m, 2), 2.38 (s, 3), 1.66 (dd, J = 14.8, 7.6 Hz, 2), 1.33 – 1.18 (m, 4), 0.82 (t, J = 7.2 Hz, 3). Calculated for C15H19N3O2SNa (M+Na)+ = 328.1096; Observed 328.1128.
Synthesis of N-(2-(aminomethyl)-3-methyl-1H-indol-5-yl)butane-1-sulfonamide (11)
A solution of compound 9 (50.0 mg, 0.171 mmol) and anhydrous NiCl2 (6.6 mg, 0.051 mmol) in 3 mL dry MeOH was cooled to 0°C. Sodium borohydride (60.0 mg, 1.55 mmol) was added in portions to the stirring solution over 2 h at 0°C. The reaction changed in appearance from a white cloudy suspension to a dark suspension as NaBH4 was added and the progress of the reaction was closely monitored by LC/MS. The reaction was quenched by a dropwise addition of 1 N HCl(aq) (1 mL) at 0°C and diluted 10-fold with EtOAc. The acid was neutralized with saturated NaHCO3(aq) solution, followed by a final wash with saturated aqueous brine solution. The organic phase was dried over anhydrous Na2SO4 and concentrated in vacuo prior to purification by silica gel flash column chromatography using 1 – 10% MeOH/dichloromethane containing 1% NH4OH(aq) to give the product as white solid (31 mg, 62%): 1H NMR (500 MHz, d6-DMSO) δ 10.7 (s, 1), 7.25 – 7.20 (m, 2), 6.91 (dd, J = 8.2, 2.0 Hz, 1), 3.79 (s, 2), 2.93 – 2.86 (m, 2), 2.14 (s, 3), 1.70 – 1.61 (m, 2), 1.37 – 1.28 (m, 2), 0.83 (t, J = 7.4 Hz, 3). The indole NH- and the primary -NH2 protons were unaccounted for. Calculated for C14H20N3O2S (M-H)- = 294.1; Observed 294.2.
Synthesis of N-((5-(butylsulfonamido)-3-methyl-1H-indol-2-yl)methyl)acetamide (12)
To a suspension of 11 (15.0 mg, 0.0509 mmol) in 2 mL dry dichloromethane was added 2,6-lutidine (5.9 μL, 0.051 mmol). Acetyl chloride (3.7 μL, 0.052 mmol) was added to the mixture and the reaction was stirred overnight. The reaction was diluted 5-fold with EtOAc and washed three times with saturated NaHCO3(aq), followed by three washes with saturated NH4Cl(aq) solution. The organic phase was washed with saturated aqueous brine solution and was then dried over anhydrous Na2SO4. The organic phase was concentrated in vacuo and the crude product purified by silica gel flash column chromatography using 0 – 50% EtOAC/hexanes to give the product as a white solid (16 mg, 95%): 1H NMR (500 MHz, d 6 -DMSO) δ 10.6 (s, 1), 9.28 (s, 1), 8.20 (s, 1), 7.30 – 7.21 (m, 2), 6.94 (d, J = 8.6 Hz, 1), 4.34 (d, J = 5.2 Hz, 2), 2.96 – 2.84 (m, 2), 2.16 (s, 3), 1.85 (s, 3), 1.71 – 1.60 (m, 2), 1.37 – 1.27 (m, 2), 0.82 (t, J = 7.3 Hz, 3). Calculated for C16H24N3O3S (M+H)+ = 338.2; Observed 338.0.
Synthesis of N-allyl-2-bromo-4-nitroaniline (Figures S2B and S2B1)
To a solution of 2-bromo-4-nitroaniline (5.42 g, 25.0 mmol) in 50 mL dry acetonitrile at 0°C was slowly added potassium tert-butoxide (2.81 g, 25.0 mmol). Then, the resulting red solution was stirred at 0°C and allyl bromide (2.16 mL, 25.0 mmol) was added dropwise to the mixture. The reaction was allowed to slowly warm to rt and continued to stir overnight. The mixture was neutralized by the addition of 6 N HCl(aq) and concentrated in vacuo. The crude product was dissolved in EtOAc and washed 3 times with saturated NaHCO3(aq), followed by a wash with a saturated aqueous brine solution. The organic phase was dried over anhydrous Na2SO4 and the product was concentrated in vacuo prior to purification by flash column chromatography using 5 – 50% EtOAc/hexanes to give the product as a yellow solid (4.15 g, 64.6%): 1H NMR (500 MHz, d6-DMSO) δ 8.29 (d, J = 2.5 Hz, 1), 8.06 (dd, J = 9.3, 2.2 Hz, 1), 6.99 (s, 1), 6.71 (d, J = 9.3 Hz, 1), 5.86 (m, 1), 5.16 (d, J = 4.0 Hz, 1), 5.14 (s, 1), 3.98 (s, 2). Calculated for C9H10BrN2O2 (M+H)+ = 257.0, 259.0; Observed 257.0, 259.0.
Synthesis of 3-methyl-5-nitro-1H-indole (Figures S2B and S2B2)
A flask containing N-allyl-2-bromo-4-nitroaniline (3.71 g, 14.4 mmol), Pd(OAc)2 (186 mg, 0.828 mmol), and tetra-n-butylammonium bromide (4.64 g, 14.4 mmol) was degassed with N2 for 30 min. The solids were dissolved in 20 mL dry DMF and triethylamine (5.0 mL, 36 mmol) was added. The reaction was stirred at rt for 48 h and diluted with EtOAc. The organic phase was washed with 0.5 N HCl(aq), water, and saturated aqueous brine solution. The solution was dried over anhydrous Na2SO4 and concentrated in vacuo. The crude product was purified by silica gel flash column chromatography using 0 – 50% dichloromethane/hexanes to give the product as a light yellow solid (1.74 g, 68.6%): 1H NMR (500 MHz, d6-DMSO) δ 11.5 (s, 1), 8.49 (s, 1), 7.98 (d, J = 9.0 Hz, 1), 7.50 (d, J = 8.9 Hz, 1), 7.39 (s, 1), 2.33 (s, 3). Calculated for C9H9N2O2 (M+H)+ = 177.1; Observed 177.2.
Synthesis of 3-methyl-1H-indol-5-amine (Figures S2B and S2B3)
A flask containing a solution of 3-methyl-5-nitro-1H-indole (1.07 g, 6.04 mmol) in ethanol was purged with N2 and 10% Pd/C (107 mg) was added in one portion. The flask was charged with H2 (~1 atm) and the reaction was stirred at rt for 12 h. The mixture was filtered through a pad of Celite and concentrated in vacuo. The product was purified by silica gel flash column chromatography using 10 – 60 EtOAc/hexanes to give the product as a light yellow solid (741 mg, 83.9%). Calculated for C9H11N2 (M+H)+ = 147.1; Observed 147.0.
Synthesis of N-(3-methyl-1H-indol-5-yl)butane-1-sulfonamide (4)
To a solution of 3-methyl-1H-indol-5-amine (90.8 mg, 0.623 mmol) in 3 mL dry acetonitrile at 0°C added 2,6-lutidine (144 μL, 1.25 mmol), followed by dropwise addition of butanesulfonyl chloride (81 μL, 0.62 mmol). After 12 h, the reaction was concentrated and dissolved in 15 mL EtOAc. The organic solution was washed with saturated NH4Cl(aq) and saturated aqueous brine solution. The product was purified by silica gel flash column chromatography using 10 – 50% EtOAc/hexanes to give the product as a clear oil (141 mg, 84.9%): 1H NMR (500 MHz, d6-DMSO) δ 10.7 (s, 1), 9.29 (s, 1), 7.31 (s, 1), 7.28 (d, J = 8.5 Hz, 1), 7.12 (s, 1), 6.98 (d, J = 8.5 Hz, 1), 2.99 – 2.88 (m, 2), 2.21 (s, 3), 1.72 – 1.61 (m, 2), 1.40 – 1.27 (m, 2), 0.83 (t, J = 7.3 Hz, 3). Calculated for C13H19N3O2S (M+H)+ = 267.1; Observed 267.0.
Spectroscopic Data for N-(3-methyl-1H-indazol-5-yl)pentane-1-sulfonamide (13)
1H NMR (500 MHz, CDCl3) δ 7.59 (s, 1), 7.42 (d, J = 8.5 Hz, 1), 7.28 (br s, 1), 6.70 (s, 1), 3.11 – 2.99 (m, 2), 2.59 (s, 3), 1.80 – 1.93 (m, 2), 1.19 – 1.42 (m, 4), 0.87 (t, J = 5.9 Hz, 3). One H was unaccounted for. Calculated for C13H20N3O2S (M+H)+ = 282.1; Observed 282.0.
Spectroscopic Data for N-(3-chloro-1H-indazol-5-yl)butane-1-sulfonamide (14)
1H NMR (500 MHz, CDCl3) δ 10.0 (br s, 1), 7.56 (br s, 1), 7.45 (d, J = 8.5 Hz, 1), 7.38 (d, J = 8.5 Hz, 1), 6.55 (br s, 1), 3.02 – 3.15 (m, 2), 1.77 – 1.89 (m, 2), 1.36 – 1.49 (m, 2), 0.92 (t, J = 6.7 Hz, 3). Also noted 1.60 (br s, H2O), 1.25 (s). Calculated for C11H15ClN3O2S (M+H)+ = 288.1, 290.1; Observed 288.0, 290.0.
Spectroscopic Data for 4,4,4-trifluoro-N-(3-methyl-1H-indazol-5-yl)butane-1-sulfonamide (15)
1H NMR (500 MHz, MeOD) δ 7.58 (d, J = 1.2 Hz, 1), 7.45 (d, J = 8.8 Hz, 1), 7.31 (dd, J = 8.8, 1.8 Hz, 1), 3.14 (t, J = 7.6 Hz, 2), 2.53 (s, 3), 2.23 – 2.43 (m, 2), 1.95 – 2.11 (m, 2). Also noted 1.25 (s). Two hydrogens were unaccounted for, presumably due to H/D exchange with the NMR solvent. Calculated for C12H15F3N3O2S (M+H)+ = 322.1; Observed 322.0.
Spectroscopic Data for N-(3-chloro-1H-indazol-5-yl)-4,4,4-trifluorobutane-1-sulfonamide (16)
1H NMR (500 MHz, CDCl3) δ 9.92 (br s, 1), 7.58 (s, 1), 7.48 (d, J = 9.2 Hz, 1), 7.35 – 7.40 (m, 1), 6.43 (br s, 1), 3.17 (t, J = 7.5 Hz, 2), 2.23 – 2.45 (m, 2), 2.15 (quin, J = 7.5 Hz, 2). Also noted 7.0 (s), 1.6 (br s, H2O), 1.2 (s), 0.9 (m). Calculated for C11H12ClF3N3O2S (M+H)+ = 342.0, 344.0; Observed 342.0, 344.0.
Spectroscopic Data for N-(3-chloro-1H-indazol-5-yl)pentane-1-sulfonamide (17)
1H NMR (500 MHz, CDCl3) δ 10.0 (br s, 1), 7.56 (s, 1), 7.46 (d, J = 8.8 Hz, 1), 7.38 (d, J = 9.2 Hz, 1), 6.49 (s, 1), 3.03 – 3.13 (m, 2), 1.80 – 1.92 (m, 2), 1.27 – 1.42 (m, 4), 0.88 (t, J = 7.2 Hz, 3). Also noted 1.6 (br s, H2O). Calculated for C12H17ClN3O2S (M+H)+ = 302.1, 304.1; Observed 302.0, 304.0.
Spectroscopic Data for N-(3-chloro-1H-indazol-5-yl)-4-fluorobutane-1-sulfonamide (18)
1H NMR (500 MHz, CDCl3) δ 9.94 (br s, 1), 7.58 (s, 1), 7.47 (d, J = 8.8 Hz, 1), 7.39 (dd, J = 2.1, 8.8 Hz, 1), 6.47 (s, 1), 4.47 – 4.56 (m, 1), 4.37 – 4.45 (m, 1), 3.11 – 3.21 (m, 2), 2.03 (td, J = 7.5, 15.4 Hz, 2), 1.76 – 1.92 (m, 2). Also noted 1.6 (br s, H2O) and 1.3 (s). Calculated for C11H14ClFN3O2S (M+H)+ = 306.0, 308.0; Observed 306.0, 308.0.
Synthesis of 3-methyl-1H-indazol-5-amine (Figure S2C; Intermediate C1 with R1 = CH3)
To a solution of 3-methyl-5-nitro-1H-indazole (2.50 g, 14.1 mmol) in anhydrous methanol (25 mL), 10% Pd/C (0.25 g) was added and stirred at rt under 1 atm of H2(g). After completion of the reaction as judged by TLC, the mixture was filtered through a pad of Celite, and the filtrate was concentrated in vacuo. The crude reaction mixture was purified by silica gel chromatography using 0 – 100% CH2Cl2:EtOAc to afford the desired product as brick-red solid (1.75 g, 84.5%). Calculated for C8H10N3 (M+H)+ = 148.1; Observed 148.2.
Synthesis of 4-fluoro-N-(3-methyl-1H-indazol-5-yl)butane-1-sulfonamide (JSF-3285)
To a solution of 3-methyl-1H-indazol-5-amine (2.00 g, 1.35 mmol) in pyridine (60 mL), 4-fluorobutane-1-sulfonyl chloride (2.10 g, 1.22 mmol) was added dropwise at -10°C and the mixture was stirred at rt for 12h. The solvent was removed in vacuo and the crude was partitioned between EtOAc (50 mL) and 0.1N HCl(aq) (25 mL). The organic phase was dried over anhydrous Na2SO4 and then concentrated in vacuo. The crude product mixture was purified by silica gel chromatography using 0 – 100% CH2Cl2:EtOAc to afford the desired product as an off-white solid (3.11 g, 1.08 mmol, 80.7%): 1H NMR (500 MHz, d6-DMSO) δ 12.6 (s, 1), 9.59 (s, 1), 7.49 (d, J = 1.1 Hz, 1), 7.44 (d, J = 8.8 Hz, 1), 7.23 (dd, J = 8.8, 1.7 Hz, 1), 4.46 (t, J = 5.6 Hz, 1), 4.37 (t, J = 5.8 Hz, 1), 3.11 – 2.99 (m, 2), 2.46 (s, 3), 1.78 (tdt, J = 18.0, 12.0, 6.0 Hz, 3), 1.73 – 1.65 (m, 1). 13C NMR (126 MHz, d6-DMSO) δ 140.9, 138.6, 130.1, 122.3, 122.2, 111.9, 110.7, 83.2, 49.5, 28.2, 19.3, 11.7. Calculated for C12H17FN3O2S (M+H)+ = 286.1026; Observed 286.1042.
QUANTIFICATION AND STATISTICAL ANALYSIS
Each time point in Figure 3 for each treatment represents an average from the sampling of the lungs of 5 mice. Error bars represent the mean ± standard error. Ordinary one-way ANOVA with multiple comparisons displayed significant differences between vehicle control and all individual treatment groups on day 42. All comparisons showed p < 0.0001 except for compound 10 (60 mg/kg) with p = 0.0025. The comparison between pre-treatment (day 14) and day 42 also showed highly significant differences (p < 0.001). The data were plotted and analyzed using GraphPad Prism 8.1.2. In Figure 4C, data is presented as the mean ± standard deviation of three independent assays with the plot and Kd generated with MO Affinity Analysis 2.3 (NanoTemper). In Figure 5, each time point for each treatment represents data from the sampling of the lungs of 5 mice. Error bars represent the mean ± standard error. Ordinary one-way ANOVA with multiple comparisons displayed significant differences (p < 0.0001) between no-drug control and all individual treatment groups on day 42 (panel A) and day 56 (panels B-D). The comparison between pre-treatment (day 14) and day 42 also showed highly significant differences (p < 0.001). With regard to JSF-3285 treatments, in panel C, the 200 – 20 mg/kg arms were not statistically different from each other, while in panel D, the 20 mg/kg arm was statistically different from the 5 and 10 mg/kg doses (p < 0.0001).The data were plotted and analyzed using GraphPad Prism 8.1.2.
DATA AND CODE AVAILABILITY
Atomic coordinates and structure factors for KasA-Compound 9, KasA-Compound 10, and KasA-JSF-3285 have been deposited in the Protein Data Bank (www.rcsb.org) with the accession codes of 6P9K, 6P9M, and 6P9L, respectively.
Supplementary Material
KEY RESOURCES TABLE.
| REAGENT or RESOURCE | SOURCE | IDENTIFIER |
|---|---|---|
| Bacterial and Virus Strains | ||
| M. tuberculosis strain H37Rv | Lab stock | BEI NR-13648 |
| M. tuberculosis strain CDC1551 | Lab stock | BEI NR-13649 |
| M. tuberculosis Δleu ΔpanCD auxotroph strain mc26206 | Professor William R. Jacobs’ Lab | N/A |
| M. smegmatis strain mc2155 | Professor William R. Jacobs’ Lab | N/A |
| E. coli chemically competent TOP10 | ThermoFisher | Cat# C40005 |
| E. coli chemically competent BL21(DE3)pLysE | ThermoFisher | Cat# C656503 |
| Chemicals, Peptides, and Recombinant Proteins | ||
| Small molecules labeled as JSF-# | This paper; Freundlich Lab | |
| Pretomanid | AdooQ Bioscience | Cat# A11401-50 |
| Isoniazid (INH) | Sigma-Aldrich | Cat# 75182-50MG |
| Resazurin sodium salt | Sigma-Aldrich | Cat# R7017-5G |
| Acetic Acid [1,2-14C] sodium salt | American Radiolabeled Chemicals, Inc. | Cat# ARC 0173 |
| M. tuberculosis protein KasA expressed in M. smegmatis mc2155 | Neiditch Lab per protocol described in Kumar et al. (2018) | N/A |
| TCEP-HCl | Gold Biotechnology | Cat# TCEP25 |
| Dimethyl Sulfoxide | Sigma-Aldrich | Cat# 41647-250ML |
| Isopropanol | PharmCO | Cat# 111000200 |
| NaCl | Sigma-Aldrich | Cat# S9888-10KG |
| Glycerol | Sigma-Aldrich | Cat# G7893-4L |
| Pluronic F-127 | PromoKline | Cat# PK-CA707-59005 |
| HEPES | Gold Biotechnology | Cat# H-400-1 |
| CHES | Sigma-Aldrich | Cat# C2885-100G |
| Chromolith SpeedRod RP-18e column | Millipore Sigma | Cat# 151450 |
| Teledyne RediSep normal phase silica gel columns | Teledyne Isco | Cat# 692203304, 692203312, 692203340 |
| Kinetex 2.6μ C18 100Å column (3.0 mm X 30 mm, Phenomenex) | Phenomenex | Cat# 00A-4497-Y0 |
| Mouse liver microsomal prep | XenoTech | Cat# M1000 |
| Human liver microsomal prep | BiolVT | Cat# X008070 |
| Rat liver microsomal prep | Corning | Cat# 452501 |
| Dog liver microsomal prep | XenoTech | Cat# D1000 |
| Mouse plasma | BioDuro | 02122018 |
| Human plasma | BioDuro | 02082018 |
| Critical Commercial Assays | ||
| Vybrant MTT Cell Proliferation Assay Kit | ThermoFisher | Cat# V13154 |
| alamarBlue™ Dye | ThermoFisher | Cat# Y00-025 |
| RED-NHS Protein Labeling Kit | NanoTemper Technologies | Cat# L001 |
| Deposited Data | ||
| mtKasA – compound 9 complex | This paper | PDB: 6P9K |
| mtKasA – compound 10 complex | This paper | PDB: 6P9M |
| mtKasA – JSF-3285 complex | This paper | PDB: 6P9L |
| mtKasA – DG167 complex | Kumar et al., 2018 | PDB: 5W2P |
| mtKasA – DG167 complex | Kumar et al., 2018 | PDB: 5W2S |
| Experimental Models: Cell Lines | ||
| J774.1 mouse macrophage | ATCC | ATCC TIB-67 |
| Vero cell (African green monkey kidney) | ATCC | ATCC CCL-81 |
| Experimental Models: Organisms/Strains | ||
| Mouse: 6-week-old-female outbred CD-1 IGS | Charles River Labs | Crl:CD1(ICR), strain code 022 |
| Mouse: 9-week-old female BALB/c | Charles River Labs | BALB/cAnNCrl, strain code 028 |
| Oligonucleotides | ||
| Primer for kasA amplification for SNP detection from M. tuberculosis JSF-3285 resistant isolates Forward: 5′ CCTACATCCAGAAGCTC 3′ | This paper | N/A |
| Primer for kasA amplification for SNP detection from M. tuberculosis JSF-3285 resistant isolates Reverse: 5′ GAACGTTCCTTCCATATC 3′ | This paper | N/A |
| Software and Algorithms | ||
| GraphPad Prism | GraphPad software Inc. | https://www.graphpad.com/scientific-software/prism/ |
| SnapGene | GSL Biotech LLC | https://www.snapgene.com/ |
| SNPTB for mapping Illumina whole-genome sequencing data to reference | Gupta, A., bioRxiv preprint doi: https://doi.org/10.1101/227066 | https://github.com/aditi9783/SNPTB |
| HKL2000 | HKL Research, Inc | https://hkl-xray.com |
| Phenix 1.15 | Adams et al., 2010 | https://www.phenix-online.org/ |
| Coot | Emsley et al., 2010 | https://www2.mrc-lmb.cam.ac.uk/personal/pemsley/coot/ |
| PyMol 1.8.2.3 | Schrödinger, LLC | https://pymol.org/2/ |
| Autodock Software Suite | Olson Lab – The Scripps Research Institute | http://autodock.scripps.edu |
| Accelrys Discovery Studio Visualizer 4.0 | Biovia, Inc. | https://www.3ds.com |
| Molprobity | Davis et al., 2007 | http://molprobity.biochem.duke.edu/ |
| NanoTemper analysis software (2.3) | NanoTemper Technologies | https://nanotempertech.com |
| ChemDraw | PerkinElmer | https://www.perkinelmer.com/category/chemdraw |
| Avogadro (v1.2.0) | Avogadro Chemistry | https://avogadro.cc |
| TLSMD | Painter, J., and Merritt, E.A., 2006 | http://skuld.bmsc.washington.edu/∼tlsmd/ |
Highlights.
A structure-based optimization of the KasA inhibitor DG167 led to JSF-3285
The inhibitor evolution focused on metabolic stability and mouse plasma PK
JSF-3285 is efficacious in a mouse model of chronic TB infection at 5 mg/kg
JSF-3285 represents a preclinical lead compound for TB
ACKNOWLEDGMENTS
This work was supported by NIH grants U19AI109713, U19AI142731, R21AI111647, and R33AI11167.
Footnotes
DECLARATION OF INTERESTS
D.I., D.Awasthi, G.C.C., D.Alland, M.B.N., P.K., and J.S.F. are listed as inventors on patent filings pertinent to the indole and indazole compounds disclosed in this manuscript as employees of Rutgers University.
SUPPLEMENTAL INFORMATION
Supplemental Information can be found online at https://doi.org/10.1016/j.chembiol.2020.02.007.
REFERENCES
- Abrahams KA, Chung CW, Ghidelli-Disse S, Rullas J, Rebollo-Lopez MJ, Gurcha SS, Cox JA, Mendoza A, Jimenez-Navarro E, Martinez-Martinez MS, et al. (2016). Identification of KasA as the cellular target of an anti-tubercular scaffold. Nat. Commun 7, 12581. [DOI] [PMC free article] [PubMed] [Google Scholar]
- Adams PD, Afonine PV, Bunkoczi G, Chen VB, Davis IW, Echols N, Headd JJ, Hung LW, Kapral GJ, Grosse-Kunstleve RW, et al. (2010). PHENIX: a comprehensive Python-based system for macromolecular structure solution. Acta Crystallogr. D Biol. Crystallogr 66, 213–221. [DOI] [PMC free article] [PubMed] [Google Scholar]
- Almeida D, Nuermberger E, Tasneen R, Rosenthal I, Tyagi S, Williams K, Peloquin C, and Grosset J (2009). Paradoxical effect of isoniazid on the activity of rifampin-pyrazinamide combination in a mouse model of tuberculosis. Antimicrob. Agents Chemother 53, 4178–4184. [DOI] [PMC free article] [PubMed] [Google Scholar]
- Andries K, Verhasselt P, Guillemont J, Gohlmann HWH, Neefs J-M, Winkler H, Van Gestel J, Timmerman P, Zhu M, Lee E, et al. (2005). A diarylquinoline drug active on the ATP synthase of Mycobacterium tuberculosis. Science 307, 223–227. [DOI] [PubMed] [Google Scholar]
- Banerjee A, Dubnau E, Quemard A, Balasubramanian V, Um KS, Wilson T, Collins D, de Lisle G, and Jacobs WR Jr. (1994). InhA, a gene encoding a target for isoniazid and ethionamide in M. tuberculosis. Science 263, 227–230. [DOI] [PubMed] [Google Scholar]
- Bartoli S, Cipollone A, Squarcia A, Madami A, and Fattori D (2009). Electrophilic bromination of meta-substituted anilines with N-bromosuccinimide: regioselectivity and solvent effect. Synthesis 8, 1305–1308. [Google Scholar]
- Bhatt A, Molle V, Besra GS, Jacobs WR Jr., and Kremer L (2007). The Mycobacterium tuberculosis FAS-II condensing enzymes: their role in mycolic acid biosynthesis, acid-fastness, pathogenesis and in future drug development. Mol. Microbiol 64, 1442–1454. [DOI] [PubMed] [Google Scholar]
- Borgaro JG, Chang A, Machutta CA, Zhang X, and Tonge PJ (2011). Substrate recognition by beta-ketoacyl-ACP synthases. Biochemistry 50, 10678–10686. [DOI] [PMC free article] [PubMed] [Google Scholar]
- Brown AK, Taylor RC, Bhatt A, Futterer K, and Besra GS (2009). Platensimycin activity against mycobacterial beta-ketoacyl-ACP synthases. PLoS One 4, e6306. [DOI] [PMC free article] [PubMed] [Google Scholar]
- Caddick S, de K Haynes AK, Judd DB, and Williams MRV (2000). Convenient synthesis of protected primary amines from nitriles. Tetrahedron Lett. 41, 3513–3516. [Google Scholar]
- Cai Q, Li Z, Wei J, Ha C, Pei D, and Ding K (2009). Assembly of indole-2-carboxylic acid esters through a ligand-free copper-catalysed cascade process. Chem. Commun 7581–7583, 10.1039/B918345K. [DOI] [PubMed] [Google Scholar]
- Cho S, Lee HS, and Franzblau S (2015). Microplate Alamar blue assay (MABA) and low oxygen recovery assay (LORA) for Mycobacterium tuberculosis. Methods Mol. Biol. 1285, 281–292. [DOI] [PubMed] [Google Scholar]
- Csomós P, Zupkó I, Réthy B, Fodor L, Falkay G, and Bernáth G (2006). Isobrassinin and its analogues: novel types of antiproliferative agents. Bioorg. Med. Chem. Lett. 16, 6273–6276. [DOI] [PubMed] [Google Scholar]
- Csomós P, Fodor L, Má ndity I, and Berná th G (2007). An efficient route for the synthesis of 2-arylthiazino[5,6-b]indole derivatives. Tetrahedron 63, 4983–4989. [Google Scholar]
- Collins L, and Franzblau SG (1997). Microplate Alamar blue assay versus BACTEC 460 system for high-throughput screening of compounds against Mycobacterium tuberculosis and Mycobacterium avium. Antimicrob. Agents Chemother 41, 1004–1009. [DOI] [PMC free article] [PubMed] [Google Scholar]
- Davis IW, Leaver-Fay A, Chen VB, Block JN, Kapral GJ, Wang X, Murray LW, Arendall WB 3rd, Snoeyink J, Richardson JS, and Richardson DC (2007). MolProbity: all-atom contacts and structure validation for proteins and nucleic acids. Nucleic Acids Res 35, W375–W383. [DOI] [PMC free article] [PubMed] [Google Scholar]
- de Steenwinkel JE, Aarnoutse RE, de Knegt GJ, ten Kate MT, Teulen M, Verbrugh HA, Boeree MJ, van Soolingen D, and Bakker-Woudenberg IA (2013). Optimization of the rifampin dosage to improve the therapeutic efficacy in tuberculosis treatment using a murine model. Am. J. Respir. Crit. Care Med 187, 1127–1134. [DOI] [PubMed] [Google Scholar]
- DeJesus MA, Gerrick ER, Xu W, Park SW, Long JE, Boutte CC, Rubin EJ, Schnappinger D, Ehrt S, Fortune SM, et al. (2017). Comprehensive essentiality analysis of the Mycobacterium tuberculosis genome via saturating transposon mutagenesis. MBio 8, 10.1128/mBio.02133-16. [DOI] [PMC free article] [PubMed] [Google Scholar]
- Delano WL (2002). The PyMOL Molecular Graphics System (Schrödinger LLC; ). [Google Scholar]
- Dhar N, and McKinney JD (2007). Microbial phenotypic heterogeneity and antibiotic tolerance. Curr. Opin. Microbiol 10, 30–38. [DOI] [PubMed] [Google Scholar]
- Dong LB, Rudolf JD, Lin L, Ruiz C, Cameron MD, and Shen B (2017). In vivo instability of platensimycin and platencin: synthesis and biological evaluation of urea- and carbamate-platensimycin. Bioorg. Med. Chem 25, 1990–1996. [DOI] [PMC free article] [PubMed] [Google Scholar]
- Dubnau E, Chan J, Raynaud C, Mohan VP, Laneelle MA, Yu K, Quemard A, Smith I, and Daffe M (2000). Oxygenated mycolic acids are necessary for virulence of Mycobacterium tuberculosis in mice. Mol. Microbiol 36, 630–637. [DOI] [PubMed] [Google Scholar]
- El-Fehail Ali F, Bondinell W, Huffman WF, Amparo LM, Keenan RM, Kwon C, Henry MW, Nguyen T, and Takata DT (1999). Benzimidazoles/imidazoles linked to A fibrinogen receptor antagonist template having vitronectin receptor antagonist activity. US5977101A1. [Google Scholar]
- Emsley P, Lohkamp B, Scott WG, and Cowtan K (2010). Features and development of Coot. Acta Crystallogr. D Biol. Crystallogr 66, 486–501. [DOI] [PMC free article] [PubMed] [Google Scholar]
- Falzari K, Zhu Z, Pan D, Liu H, Hongmanee P, and Franzblau SG (2005). In vitro and in vivo activities of macrolide derivatives against Mycobacterium tuberculosis. Antimicrob. Agents Chemother 49, 1447–1454. [DOI] [PMC free article] [PubMed] [Google Scholar]
- Gavalda S, Leger M, van der Rest B, Stella A, Bardou F, Montrozier H, Chalut C, Burlet-Schiltz O, Marrakchi H, Daffe M, et al. (2009). The Pks13/ FadD32 crosstalk for the biosynthesis of mycolic acids in Mycobacterium tuberculosis. J. Biol. Chem 284, 19255–19264. [DOI] [PMC free article] [PubMed] [Google Scholar]
- Glickman MS, Cox JS, and Jacobs WR Jr. (2000). A novel mycolic acid cyclopropane synthetase is required for cording, persistence, and virulence of Mycobacterium tuberculosis. Mol. Cell 5, 717–727. [DOI] [PubMed] [Google Scholar]
- Gupta R, Lavollay M, Mainardi JL, Arthur M, Bishai WR, and Lamichhane G (2010). The Mycobacterium tuberculosis protein LdtMt2 is a nonclassical transpeptidase required for virulence and resistance to amoxicillin. Nat. Med 16, 466–469. [DOI] [PMC free article] [PubMed] [Google Scholar]
- Heath RJ, and Rock CO (2004). Fatty acid biosynthesis as a target for novel antibacterials. Curr. Opin. Investig. Drugs 5, 146–153. [PMC free article] [PubMed] [Google Scholar]
- Hennequin LFA, Kettle JG, Pass M, and Bradbury RH (2003). Quinazoline Derivatives as Antitumor Agents. WO 2003040109 A2. [Google Scholar]
- Inoyama D, Paget SD, Russo R, Kandasamy S, Kumar P, Singleton E, Occi J, Tuckman M, Zimmerman MD, Ho HP, et al. (2018). Novel pyrimidines as antitubercular agents. Antimicrob. Agents Chemother 62, 10.1128/AAC.0206317. [DOI] [PMC free article] [PubMed] [Google Scholar]
- Khurana JM, and Kukreja G (2002). Rapid Reduction of nitriles to primary amines with nickel boride at ambient temperature. Synth. Commun 32, 1265–1269. [Google Scholar]
- Kim P, Zhang YM, Shenoy G, Nguyen QA, Boshoff HI, Manjunatha UH, Goodwin MB, Lonsdale J, Price AC, Miller DJ, et al. (2006). Structure-activity relationships at the 5-position of thiolactomycin: an intact (5R)-isoprene unit is required for activity against the condensing enzymes from Mycobacterium tuberculosis and Escherichia coli. J. Med. Chem 49, 159–171. [DOI] [PMC free article] [PubMed] [Google Scholar]
- Koul A, Arnoult E, Lounis N, Guillemont J, and Andries K (2011). The challenge of new drug discovery for tuberculosis. Nature 469, 483–490. [DOI] [PubMed] [Google Scholar]
- Kremer L, Baulard AR, and Besra GS (2000). Genetics of mycolic acid biosynthesis In Molecular Genetics of Mycobacteria, Hatfull GF and Jacobs WR Jr., eds. (ASM Press; ), pp. 173–190. [Google Scholar]
- Kumar P, Arora K, Lloyd JR, Lee IY, Nair V, Fischer E, Boshoff HI, and Barry CE 3rd (2012). Meropenem inhibits D,D-carboxypeptidase activity in Mycobacterium tuberculosis. Mol. Microbiol 86, 367–381. [DOI] [PMC free article] [PubMed] [Google Scholar]
- Kumar P, Kaushik A, Lloyd EP, Li SG, Mattoo R, Ammerman NC, Bell DT, Perryman AL, Zandi TA, Ekins S, et al. (2017). Non-classical transpeptidases yield insight into new antibacterials. Nat. Chem. Biol 13, 54–61. [DOI] [PMC free article] [PubMed] [Google Scholar]
- Kumar P, Capodagli GC, Awasthi D, Shrestha R, Maharaja K, Sukheja P, Li SG, Inoyama D, Zimmerman M, Ho Liang HP, et al. (2018). Synergistic lethality of a binary inhibitor of Mycobacterium tuberculosis KasA. MBio 9, 10.1128/mBio.02101-17. [DOI] [PMC free article] [PubMed] [Google Scholar]
- Leger M, Gavalda S, Guillet V, van der Rest B, Slama N, Montrozier H, Mourey L, Quemard A, Daffe M, and Marrakchi H (2009). The dual function of the Mycobacterium tuberculosis FadD32 required for mycolic acid biosynthesis. Chem. Biol 16, 510–519. [DOI] [PubMed] [Google Scholar]
- Lovell SC, Davis IW, Arendall WB 3rd, de Bakker PI, Word JM, Prisant MG, Richardson JS, and Richardson DC (2003). Structure validation by Calpha geometry: phi, psi and Cbeta deviation. Proteins 50, 437–450. [DOI] [PubMed] [Google Scholar]
- Luckner SR, Machutta CA, Tonge PJ, and Kisker C (2009). Crystal structures of Mycobacterium tuberculosis KasA show mode of action within cell wall biosynthesis and its inhibition by thiolactomycin. Structure 17, 1004–1013. [DOI] [PMC free article] [PubMed] [Google Scholar]
- Malik M, Marks KR, Mustaev A, Zhao X, Chavda K, Kerns RJ, and Drlica K (2011). Fluoroquinolone and quinazolinedione activities against wild-type and gyrase mutant strains of Mycobacterium smegmatis. Antimicrob. Agents Chemother 55, 2335–2343. [DOI] [PMC free article] [PubMed] [Google Scholar]
- Matsumoto M, Hashizume H, Tomishige T, Kawasaki M, Tsubouchi H, Sasaki H, Shimokawa Y, and Komatsu M (2006). OPC-67683, a nitro-dihydro-imidazooxazole derivative with promising action against tuberculosis in vitro and in mice. PLoS Med. 3, 2131–2144. [DOI] [PMC free article] [PubMed] [Google Scholar]
- McCoy AJ, Grosse-Kunstleve RW, Adams PD, Winn MD, Storoni LC, and Read RJ (2007). Phaser crystallographic software. J. Appl. Crystallogr 40, 658–674. [DOI] [PMC free article] [PubMed] [Google Scholar]
- Miyakawa S, Suzuki K, Noto T, Harada Y, and Okazaki H (1982). Thiolactomycin, a new antibiotic. IV. Biological properties and chemotherapeutic activity in mice. J. Antibiot. (Tokyo) 35, 411–419. [DOI] [PubMed] [Google Scholar]
- Mosmann T (1983). Rapid colorimetric assay for cellular growth and survival: application to proliferation and cytotoxicity assays. J. Immunol. Methods 65, 55–63. [DOI] [PubMed] [Google Scholar]
- Nampoothiri KM, Rubex R, Patel AK, Narayanan SS, Krishna S, Das SM, and Pandey A (2008). Molecular cloning, overexpression and biochemical characterization of hypothetical beta-lactamases of Mycobacterium tuberculosis H37Rv. J. Appl. Microbiol 105, 59–67. [DOI] [PubMed] [Google Scholar]
- Noto T, Miyakawa S, Oishi H, Endo H, and Okazaki H (1982). Thiolactomycin, a new antibiotic. III. In vitro antibacterial activity. J. Antibiot. (Tokyo) 35, 401–410. [DOI] [PubMed] [Google Scholar]
- Oishi H, Noto T, Sasaki H, Suzuki K, Hayashi T, Okazaki H, Ando K, and Sawada M (1982). Thiolactomycin, a new antibiotic. I. Taxonomy of the producing organism, fermentation and biological properties. J. Antibiot. (Tokyo) 35, 391–395. [DOI] [PubMed] [Google Scholar]
- Ojha AK, Baughn AD, Sambandan D, Hsu T, Trivelli X, Guerardel Y, Alahari A, Kremer L, Jacobs William R, and Hatfull Graham F (2008). Growth of Mycobacterium tuberculosis biofilms containing free mycolic acids and harbouring drug-tolerant bacteria. Mol. Microbiol 69, 164–174. [DOI] [PMC free article] [PubMed] [Google Scholar]
- Otwinowski Z, and Minor W (1997). Processing of X-ray diffraction data collected in oscillation mode. Methods Enzymol. 276, 307–326. [DOI] [PubMed] [Google Scholar]
- Painter J, and Merritt EA (2006). TLSMD web server for the generation of multi-group TLS models. J. Appl. Cryst 39, 109–111. [Google Scholar]
- Rao SPS, Lakshminarayana SB, Kondreddi RR, Herve M, Camacho LR, Bifani P, Kalapala SK, Jiricek J, Ma NL, Tan BH, et al. (2013). Indolcarboxamide is a preclinical candidate for treating multidrug-resistant tuberculosis. Sci. Transl. Med 5, 214ra168. [DOI] [PubMed] [Google Scholar]
- Roche O, Trube G, Zuegge J, Pflimlin P, Alanine A, and Schneider G (2002). A virtual screening method for prediction of the HERG potassium channel liability of compound libraries. Chembiochem 3, 455–459. [DOI] [PubMed] [Google Scholar]
- Rullas J, Garcia JI, Beltran M, Cardona PJ, Caceres N, Garcia-Bustos JF, and Angulo-Barturen I (2010). Fast standardized therapeutic-efficacy assay for drug discovery against tuberculosis. Antimicrob. Agents Chemother 54, 2262–2264. [DOI] [PMC free article] [PubMed] [Google Scholar]
- Rustomjee R, Diacon AH, Allen J, Venter A, Reddy C, Patientia RF, Mthiyane TC, De Marez T, van Heeswijk R, Kerstens R, et al. (2008). Early bactericidal activity and pharmacokinetics of the diarylquinoline TMC207 in treatment of pulmonary tuberculosis. Antimicrob. Agents Chemother 52, 2831–2835. [DOI] [PMC free article] [PubMed] [Google Scholar]
- Sanner MF (1999). Python: a programming language for software integration and development. J. Mol. Graph. Model 17, 57–61. [PubMed] [Google Scholar]
- Schaeffer ML, Agnihotri G, Volker C, Kallender H, Brennan PJ, and Lonsdale JT (2001). Purification and biochemical characterization of the Mycobacterium tuberculosis beta-ketoacyl-acyl carrier protein synthases KasA and KasB. J. Biol. Chem 276, 47029–47037. [DOI] [PubMed] [Google Scholar]
- Steinman M (1978). Antimicrobial Compositions. US4122034. [Google Scholar]
- Stover CK, Warrener P, VanDevanter DR, Sherman DR, Arain TM, Langhorne MH, Anderson SW, Towell JA, Yuan Y, McMurray DN, et al. (2000). A small-molecule nitroimidazopyran drug candidate for the treatment of tuberculosis. Nature 405, 962–966. [DOI] [PubMed] [Google Scholar]
- Trott O, and Olson AJ (2010). AutoDock Vina: improving the speed and accuracy of docking with a new scoring function, efficient optimization, and multithreading. J. Comput. Chem 31, 455–461. [DOI] [PMC free article] [PubMed] [Google Scholar]
- van Soolingen D, Hermans PW, de Haas PE, Soll DR, and van Embden JD (1991). Occurrence and stability of insertion sequences in Mycobacterium tuberculosis complex strains: evaluation of an insertion sequence-dependent DNA polymorphism as a tool in the epidemiology of tuberculosis. J. Clin. Microbiol 29, 2578–2586. [DOI] [PMC free article] [PubMed] [Google Scholar]
- Vilcheze C, Baughn AD, Tufariello J, Leung LW, Kuo M, Basler CF, Alland D, Sacchettini JC, Freundlich JS, and Jacobs WR Jr. (2011). Novel inhibitors of InhA efficiently kill Mycobacterium tuberculosis under aerobic and anaerobic conditions. Antimicrob. Agents Chemother 55, 3889–3898. [DOI] [PMC free article] [PubMed] [Google Scholar]
- Vilchè ze C, and Jacobs JWR (2007). The mechanism of isoniazid killing: clarity through the scope of genetics. Annu. Rev. Microbiol 61, 35–50. [DOI] [PubMed] [Google Scholar]
- Vilcheze C, Wang F, Arai M, Hazbon MH, Colangeli R, Kremer L, Weisbrod TR, Alland D, Sacchettini JC, and Jacobs WR Jr. (2006). Transfer of a point mutation in Mycobacterium tuberculosis inhA resolves the target of isoniazid. Nat. Med 12, 1027–1029. [DOI] [PubMed] [Google Scholar]
- Vincent V, Rigouts L, Nduwamahoro E, Holmes B, Cunningham J, Guillerm M, Nathanson CM, Moussy F, De Jong B, Portaels F, et al. (2012). The TDR Tuberculosis Strain Bank: a resource for basic science, tool development and diagnostic services. Int. J. Tuberc. Lung Dis 16, 24–31. [DOI] [PubMed] [Google Scholar]
- Wallace AC, Laskowski RA, and Thornton JM (1995). LIGPLOT: a program to generate schematic diagrams of protein-ligand interactions. Protein Eng. 8, 127–134. [DOI] [PubMed] [Google Scholar]
- Wang J, Soisson SM, Young K, Shoop W, Kodali S, Galgoci A, Painter R, Parthasarathy G, Tang YS, Cummings R, et al. (2006). Platensimycin is a selective FabF inhibitor with potent antibiotic properties. Nature 441, 358–361. [DOI] [PubMed] [Google Scholar]
- Wang X, Inoyama D, Russo R, Li SG, Jadhav R, Stratton TP, Mittal N, Bilotta JA, Singleton E, Kim T, et al. (2020). Antitubercular triazines: optimization and intrabacterial metabolism. Cell. Chem. Biol 27, 172–185. [DOI] [PMC free article] [PubMed] [Google Scholar]
- WHO. (2019). Global Tuberculosis Report (World Health Organization; ). [Google Scholar]
- Wilson R, Kumar P, Parashar V, Vilcheze C, Veyron-Churlet R, Freundlich JS, Barnes SW, Walker JR, Szymonifka MJ, Marchiano E, et al. (2013). Antituberculosis thiophenes define a requirement for Pks13 in mycolic acid biosynthesis. Nat. Chem. Biol 9, 499–506. [DOI] [PMC free article] [PubMed] [Google Scholar]
- Xie Z, Siddiqi N, and Rubin EJ (2005). Differential antibiotic susceptibilities of starved Mycobacterium tuberculosis isolates. Antimicrob. Agents Chemother 49, 4778–4789. [DOI] [PMC free article] [PubMed] [Google Scholar]
- Zhou H-J, Wang J, Yao B, Wong S, Djakovic S, Kumar B, Rice J, Valle E, Soriano F, Menon M-K, et al. (2015). Discovery of a first-in-class, potent, selective, and orally bioavailable inhibitor of the p97 AAA ATPase (CB-5083). J. Med. Chem 58, 9480–9497. [DOI] [PubMed] [Google Scholar]
Associated Data
This section collects any data citations, data availability statements, or supplementary materials included in this article.
Supplementary Materials
Data Availability Statement
Atomic coordinates and structure factors for KasA-Compound 9, KasA-Compound 10, and KasA-JSF-3285 have been deposited in the Protein Data Bank (www.rcsb.org) with the accession codes of 6P9K, 6P9M, and 6P9L, respectively.