Abstract
Objective:
Weight regain after weight loss is common and there is evidence to suggest negative effects on health due to weight cycling. We sought to investigate the impact of weight regain in formerly obese mice on adipose tissue architecture and stromal cell function.
Methods:
A diet-switch model was employed for obesity induction, weight loss, and weight regain in mice. Flow cytometry quantified adipose tissue leukocytes in adipose tissue. Liver and adipose tissue depots were compared to determine tissue specific effects of weight cycling.
Results:
Epididymal white adipose tissue of formerly obese mice failed to expand in response to repeat exposure to high-fat diet and retained elevated numbers of macrophages and T cells. Weight regain was associated with disproportionally elevated liver mass, hepatic triglyceride content, serum insulin concentration, and serum transaminase concentration. These effects occurred despite an extended sixmonth weight loss cycle and demonstrate that formerly obese mice maintain durable alterations in their physiological response to weight regain. Conditioned media from epididymal adipose tissue of formerly obese mice inhibited adipogenesis of 3T3-L1 preadipocytes suggesting a potential mechanism to explain failed epididymal adipose tissue expansion during weight regain.
Conclusions:
Metabolic abnormalities related to defects in adipose tissue expansion and ongoing dysfunction manifest in formerly obese mice during weight regain.
Keywords: adipose tissue, inflammation, weight regain, insulin resistance, weight cycling
Introduction
Obesity is associated with increased risk for a number of co-morbidities including metabolic syndrome, type 2 diabetes, and cardiovascular disease. Weight loss, through caloric restriction or bariatric surgery, improves metabolic dysfunction and can reduce measures of inflammation both systemically and within adipose tissue (1, 2, 3). Unfortunately, long-term maintenance of even 10% weight loss is difficult, and only ~20% of people maintain this reduction beyond one year (4), regardless of dietary or surgical weight loss (5, 6).
An open question in the field is whether weight regain and/or weight cycling adversely alters metabolic health. Clinical studies suggest that weight cycling is not associated with increased risk of metabolic disease when compared to those with sustained overweight or obesity (7, 8, 9). However, there are studies showing that weight cycling carries a higher risk for diabetes and adverse cardiovascular events than non-weight cycling individuals (10, 11, 12). Few studies have evaluated physiological responses or alterations in tissue specific metabolic parameters, during the weight regain cycle. Rodent studies have found altered fatty acid metabolism with increased lipoprotein lipase, serum triglycerides, and serum cholesterol during high-fat diet (HFD) re-feeding beyond what was observed in rodents maintained on HFD ad libitum (13, 14, 15). Weight cycling was also observed to increase visceral fat mass, inflammatory markers within adipose tissue in association with insulin resistance (16, 17, 18).
These observations suggest that weight regain in lean individuals who used to have obesity may result in unique patterns of dysfunction in metabolic tissues leading to metabolic disease risk. Consisent with this, lean adults who used to be children with obesity retain a 5-fold higher risk for elevated hemoglobin A1c (19). Inflammatory gene expression in adipose tissue of humans who used to have obesity remains high compared to lean subjects (20, 21, 22). Our group and others have demonstrated that weight loss does not resolve adipose tissue inflammation and insulin sensitivity in mice (23, 24, 25, 26).
Inflammatory CD11c+ macrophages and crown-like structures are maintained within adipose tissue despite extended weight loss associated with persistent impairment in insulin tolerance (23).
We sought to understand the metabolic and inflammatory implications of weight cycling using a mouse model of weight gain in formerly obese mice. We found that the epididymal white adipose tissue (eWAT) of formerly obese mice had impaired expansion and reduced lipid storage capacity with HFD re-feeding. Weight regain was also associated with increased hepatic triglyceride storage and markers of hepatocyte dysfunction. This failure of eWAT expansion occurred despite the presence of an expanded preadipocyte pool. Furthermore, eWAT from formerly obese mice secreted factors that inhibited adipogenesis in vitro, which suggests a mechanism for impaired adipose expansion and persistent adipose tissue dysfunction.
Methods
Animals and Animal Care
At six-weeks of age male C57BL/6J mice (Jackson) were fed a control normal diet (ND; LabDiet PicoLab 5L0D 4.09 kcal/gm 29.8% protein, 13.4% fat, 56.7% carbohydrate) or high-fat diet (HFD; Research Diets D12492, 5.24 kcal/gm 20% protein, 60% fat, 20% carbohydrate).
Glucose tolerance tests (GTT) and insulin tolerance tests (ITT) were performed after 6 hours fasting. Mice were injected IP with D-glucose (0.7 g/kg) for GTTs and human recombinant insulin (1 U/kg) for ITTs. Glucose was measured using FreeStyle Lite blood glucose monitors. Insulin measured by ELISA (Crystal Chem). Energy metabolism was measured using Comprehensive Lab Animal Monitoring System analysis (CLAMS, Columbus Instruments). All mouse procedures were approved by the University of Michigan Committee on Use and Care of Animals and were conducted in compliance with the Institute of Laboratory Animal Research Guide for the Care and Use of Laboratory Animals.
Gene expression analysis
RNA was extracted from tissues using Trizol LS (Life Technologies) and cDNA generated using High Capacity cDNA Reverse Transcription Kit (Applied Biosystems). SYBR Green PCR Master Mix and the StepOnePlus System (Applied Biosystems) were used for real-time quantitative PCR using Gapdh expression as an internal control for data normalization. Samples were assayed in duplicate and relative expression was determined using 2 −ΔΔ CT method, primers in Table S1.
Immunoblotting and Immunofluorescence
Adipose tissue was homogenized in RIPA lysis buffer with phosphatase inhibitors. Protein concentration was determined using Bio-Rad Protein Assay Dye Reagent. Antibodies used for immunoblotting: PPARγ (81B8), IRS-1, Phospho-Akt (Ser473), AKT, Adiponectin (C45B10) (Cell Signaling Technology) and β-Actin (AC-40) (Sigma-Aldrich). Proteins imaged using Odyssey infrared imaging system (Li-Cor Bioscience). Immunofluorescence was performed as previously described in adipose tissue explants, fixed overnight in a 2% paraformaldehyde solution (27). Antibodies used for immunofluorescence: caveolin (BD Pharmingen) and Mac2 (Galectin-3) (eBioM3/38) (eBioscience).
Isolation of Adipose Tissue Stromal Vascular Fraction (SVF) and Flow Cytometry
Adipose tissue was digested in RPMI with 0.5% BSA and 1 mg/ml type II collagenase on a rocking platform for 25 min at 37 °C. The SVF was separated from adipocytes by centrifugation. The following antibodies were used for flow cytometry following Fcblock: CD45 (30-F11), CD3e (145-2C11), CD4 (GK1.5), CD8a (53-6.7), CD11c (N418), Sca-1 (Ly-6A/E) (D7), CD31 (390) (eBioscience), PDGFRα (RM0004-3G28) (Abcam), and CD64 (X54-5/7.1) (BD Pharmingen). For intracellular collagen staining, cells were incubated in Fc Block then stained with surface antibodies for 45 min at 4°C. Intracellular stains were performed using FOXP3 Fix/Perm buffer (BioLegend, San Diego, CA) followed by 15 min block with 0.5% goat serum, a 1hr incubation with 0.5μg of rabbit Collagen Type I antibody (Rockland, Limerick, PA), three washes, and 30 min incubation with 0.2μg of goat anti-rabbit AlexaFluor 647 antibody (Thermo Fisher Scientific-Life Technologies, Carlsbad, CA). Analysis was performed using a BD Biosciences FACSCanto II and FlowJo v.10 (Treestar).
Explant Conditioned Media
200 mg epididymal adipose tissue explants were cultured in serum-free AIM V media with AlbuMax and BSA (Life Technologies) to create conditioned media (CM). Confluent 3T3-L1 cells were treated with a 1:1 mixture of CM and MDI differentiation media (0.5mM methylisobutylxanthine, 1μM dexamethasone and 10μg/mL human recombinant insulin in DMEM); after 3 days, media was replaced with another 1:1 mixture of CM and insulin medium (10μg insulin in DMEM). For TNFα neutralizing experiments, CM was treated 1h with 100 ng/mL blocking antibody before using the CM in 3T3-L1 cultures at a final concentration of 50ng/mL (D2H4 mAb, CST). For cytokine and chemokine treatments (10 ng/ml, PeproTech) 3T3-L1 cells were treated during both phases of differentiation. Mouse Cytokine Antibody Array (R&D Systems) was used to evaluate adipose tissue explant conditioned media (48 hours, pooled from 3 mice). Quantitation was performed by ImageJ after background subtraction and normalization.
Liver Triglyceride Quantification
~100 mg frozen liver samples were homogenized in 300μL lysis buffer (10% NP-40, 50mM Tris-HCl pH 7.5 and 100mM NaCl) and 200μL chloroform was added before drying in a vacuum concentrator. Lipids were extracted using 400μL chloroform and transferred to new tubes for drying. Lipids were reconstituted with 1mL per 100mg tissue of a butanol mixture (6% butanol, 3.33% Triton-X100 and 0.66% Methanol) and quantified using the Infinity™ Triglyceride Quantification Kit (Thermo Scientific).
Statistical Analyses
All values are reported as mean ± SEM. Statistical significance was determined using unpaired two-tailed Student’s t-test or one-way ANOVA for multiple groups using Fisher’s least significant difference test. All gene expression data was compared using two-way ANOVA with Dunnett’s multiple comparisons correction. All statistical analysis was performed using GraphPad Prism V6.05.
Results
HFD re-challenged mice have reduced eWAT mass and hyperinsulinemia compared to mice without prior HFD exposure
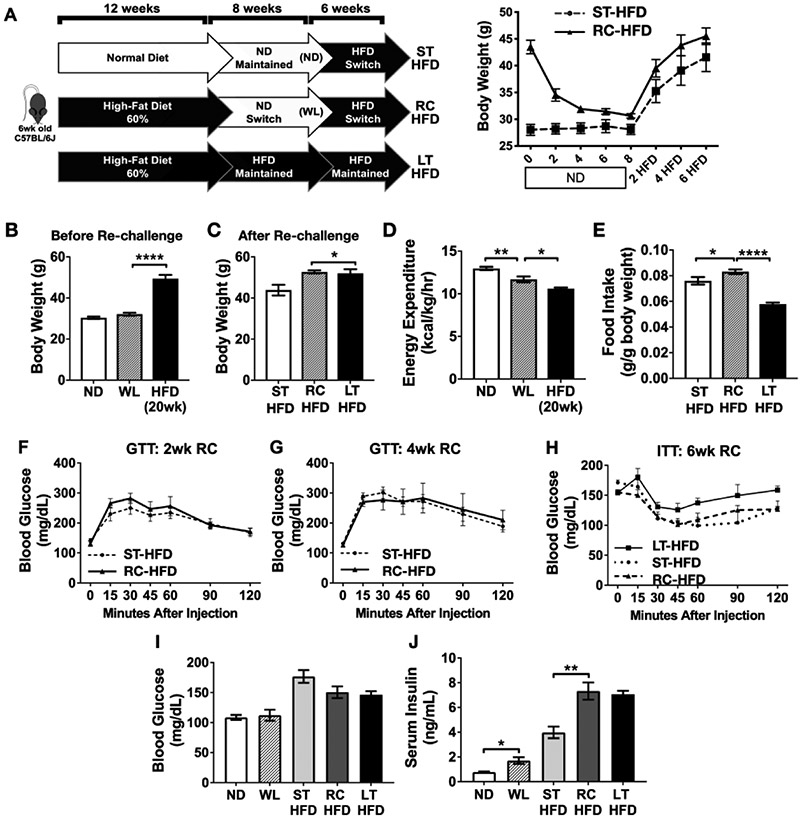
We used a dietary model of weight loss (WL) and regain in mice to assess the differences in metabolic and inflammatory measures between mice fed similar durations of HFD with and without preconditioning with WL (23). Male C57BL/6J mice were fed HFD or ND for 12 weeks. Obese mice were then maintained on HFD or switched to ND for 8 weeks to induce WL. Mice were then re-challenged with HFD for 6 weeks (RC-HFD). Age-matched control groups were mice fed ND for 20 weeks prior to the same 6-week short-term HFD challenge (ST-HFD) or mice continuously fed HFD long-term for all 26 weeks (LT-HFD) (Figure 1A).
Figure 1 -. Weight loss and HFD re-challenge model.
(A) Diagram of experimental paradigm of obesity induction, weight loss and HFD re-challenge model and longitudinal weights. Body weights after (B) weight loss and (C) HFD re-challenge. (D) Energy expenditure after weight loss and (E) food intake one week after starting HFD re-challenge phase. (F-G) Glucose tolerance testing at 2 and 4 weeks of HFD re-challenge. (H) insulin tolerance after 6 weeks of HFD re-challenge. (I) Fasted blood glucose, (J) fasted serum insulin. For A-J, n = 4. * p < 0.05, ** p < 0.01, **** p <0.0001; significance was only compared for ST-HFD versus RC-HFD, LT-HFD versus RC-HFD, ND versus WL or WL versus HFD (20wk).
After WL, body weight in the RC HFD group the same as age matched mice fed ND (32.1g ± 1.5 (RC-HFD); 30.4g ± 1.1 (ST-HFD)) (Figure 1B). After HFD re-challenge, RC-HFD mice weight was significantly higher (52.7g ± 1.5) than ST-HFD mice (43.9g ± 5.2) fed for the same duration, but was not significantly different from LT-HFD mice (52.0g ± 4.0) (Figure 1C). Compared to the ST-HFD group, total body energy expenditure was reduced in the RC-HFD mice and further reduced in the LT-HFD group (Figure 1D). One week after initiating HFD re-challenge, RC-HFD mice had higher food intake than ST-HFD and the LT-HFD mice (Figure 1E). The reduced energy expenditure and increased HFD intake likely explains the significantly elevated body weight of RC-HFD mice compared to ST-HFD mice.
GTTs were similar between RC-HFD and ST-HFD mice after 2 weeks and 4 weeks of HFD (Figure 1F-G). ITTs revealed comparable insulin sensitivity between ST-HFD and RC-HFD mice and impaired insulin tolerance in LT-HFD mice (Figure 1H). After 6 weeks of HFD feeding, fasting glucose was elevated in all three HFD groups compared to lean controls, but did not differ between the HFD groups (Figure 1I). Serum insulin levels were significantly increased in RC-HFD mice compared to ST-HFD mice (Figure 1J). Overall, these results suggest that formerly obese mice require elevated insulin levels to maintain similar glycemic control as mice that had not been previously exposed to HFD.
Markers of dysfunction in eWAT but not inguinal WAT of formerly obese mice after HFD re-challenge
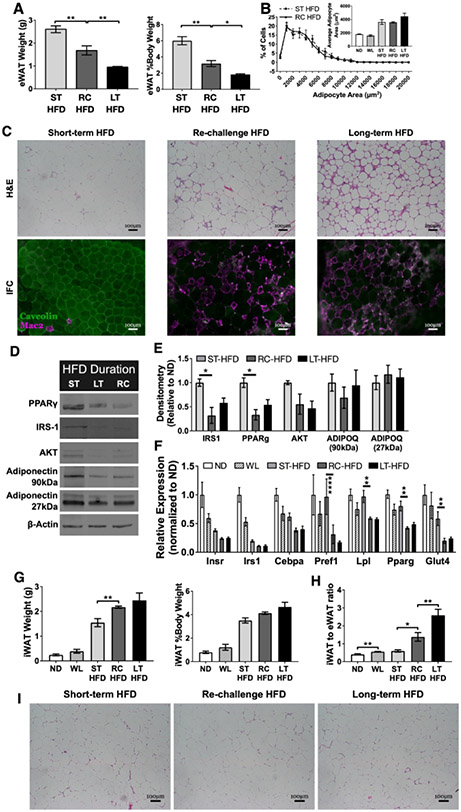
Despite increased total body weights, the eWAT in RC-HFD mice was significantly smaller than ST-HFD mice (Figure 2A). eWAT adipocyte size in ST-HFD, RC-HFD and LT-HFD was not significantly different (Figure 2B) suggesting impairments in adipocyte hyperplasia/adipogenesis in RC and LT-HFD groups. Histology demonstrated that ST-HFD mice had minimal crown-like structures (CLS) while RC-HFD and LT-HFD eWAT had high CLS content (Figure 2C). Immunoblots revealed reductions in proteins associated with mature differentiated adipocytes including PPARγ, IRS-1, and AKT in RC-HFD and LT-HFD eWAT compared to ST-HFD eWAT (Figure 2D-E). Gene expression showed reduced InsrI, Irs1, Cebpa, Pref1, and Glut4 expression in ST-HFD, LT-HFD and RC-HFD eWAT compared to ND. Compared to ST-HFD mice, expression of these same genes as well as Cebpa, Pref1 and Glut4 were further reduced in RC-HFD and LT-HFD mice (Figure 2F).
Figure 2 -. HFD re-challenge increases epididymal adipose tissue crown-like structures and reduces expression of proteins essential for mature adipocyte development and function.
(A) Total epididymal WAT (eWAT) weight and as a percent of total body weight (n = 4). (B) eWAT adipocyte size distribution (n = 3 for RC-HFD and n = 4 for other diet conditions). (C) Immunofluorescence and H&E stained eWAT slides representative for each diet condition showing CLS development and maintenance. (D) Representative immunoblots from eWAT showing select adipocyte maturation and insulin signaling proteins. (E) Quantification of densitometry measurements from immunoblots of whole eWAT (n = 3). (F) Expression of adipocyte maturation genes from eWAT (n = 4). (G) Inguinal WAT (iWAT) total weight and as percent of total body weight (n = 4). (H) Ratio of iWAT to eWAT after HFD re-challenge (n = 4). (I) H&E stained iWAT slides representative for each diet condition. Two-way ANOVA with Dunnett’s multiple comparisons for F. * p < 0.05, ** p < 0.01, **** p <0.0001, significance was only compared for ST-HFD versus RC-HFD, LT-HFD versus RC-HFD or ND versus WL.
To identify depot specific effects, we evaluated inguinal subcutaneous WAT (iWAT). In contrast to eWAT, iWAT weight was increased in RC-HFD mice, compared to ST-HFD, and was similar to LT-HFD (Figure 2G). ST-HFD had similar ratios of iWAT to eWAT as ND and WL mice. In contrast, RC-HFD and LT-HFD had significantly greater iWAT to eWAT ratios (Figure 2H) suggesting restricted lipid storage in eWAT with prior HFD exposure. No substantial differences in iWAT CLS development was seen between diet groups (Figure 2I). Gene expression from iWAT revealed HFD-induced reductions in most mature adipocyte genes compared to ND, but no significant differences between ST-HFD, RC-HFD and LT-HFD groups were observed except for Lpl which was increased in ST-HFD iWAT (Figure S1A). Inflammatory cytokine gene expression was also evaluated in iWAT revealing no significant differences between groups (Figure S1B). Overall, in contrast to eWAT, iWAT expansion in RC-HFD mice was not impaired compared to ST-HFD mice but was associated with a lack of CLS development.
HFD re-challenge increased hepatic steatosis and markers of liver dysfunction
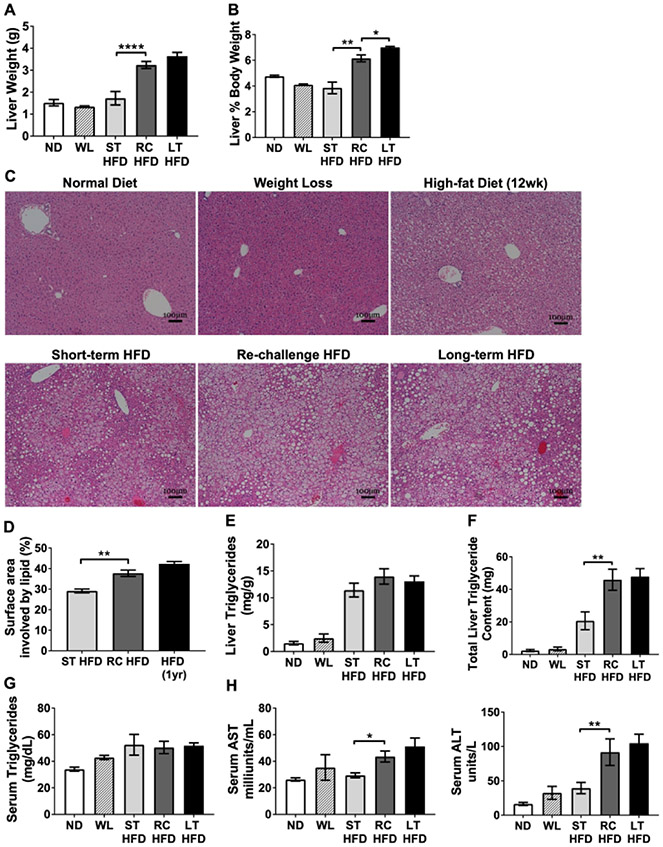
Liver weights were significantly elevated in RC-HFD mice compared to ST-HFD mice (Figure 3A-B). Liver histology from ND and WL mice were similar showing resolution of hepatic steatosis after 8 weeks off the HFD (Figure 3C). By histology, RC-HFD mice had significantly elevated hepatic steatosis compared to ST-HFD and similar to LT-HFD mice (Figure 3C-D). Total hepatic triglyceride content was more than 2-fold higher in RC-HFD and LT-HFD mice when compared to ST-HFD (Figure 3E-F). Serum triglyceride concentrations were similar between groups (Figure 3G). Serum aspartate aminotransferase (AST) and alanine aminotransferase (ALT) levels were quantified as markers of hepatocyte stress and damage. RC-HFD mice had significantly elevated AST and ALT compared to ST-HFD mice that were similar to the LT-HFD group (Figure 3H). Overall, this demonstrates that prior HFD exposure potentiates hepatocellular dysfunction and steatosis upon repeat challeng to HFD.
Figure 3 -. Increased liver steatosis and signs of liver damage with HFD re-challenge.
(A) Representative H&E stained slides from livers showing steatosis development and (B) percent of surface area with lipid involvement from H&E images (n ≥ 4). (C) Liver weight and (D) liver as a percent of total body weight (n = 4). (E) Liver triglyceride concentration and (F) total liver triglyceride content (n = 4). Serum concentrations for (G) triglyceride (n ≥ 4), (H) aspartate aminotransferase (AST, left; n =4), and alanine aminotransferase (ALT, right; n = 4). * p < 0.05, ** p < 0.01, **** p <0.0001, significance was only compared for ST-HFD versus RC-HFD, LT-HFD versus RC-HFD or ND versus WL.
To determine if the increased hepatic triglyceride content was due to increased hepatic lipogenesis, we evaluated a number of hepatic lipid and glucose metabolism genes. Compared to ST-HFD and RC-HFD mice, LT-HFD induced Lpl and Pparg expression but showed no significant differences in expression of Scd1, Srebp1, Fasn, Me1, Acaca, Fabp1, G6pc, Pck1, or Gck. No differences in expression of genes involved in lipid metabolism were seen between RC-HFD and ST-HFD livers (Figure S2A-B). These results suggest that the increased hepatic triglyceride storage was not the result of increased de novo lipogenesis in liver. Liver inflammatory gene expression revealed significantly increased expression of Tnfa in RC-HFD and LT-HFD mice compared to ST-HFD, but no differences in Il1b and Il6 expression (Figure S2C). Leukocyte gene expression for F480 and Cd3 was elevated in LT-HFD mice but was not significantly different between ST-HFD and RC-HFD mice (Figure S2D).
HFD re-challenge effects are retained despite extended weight loss
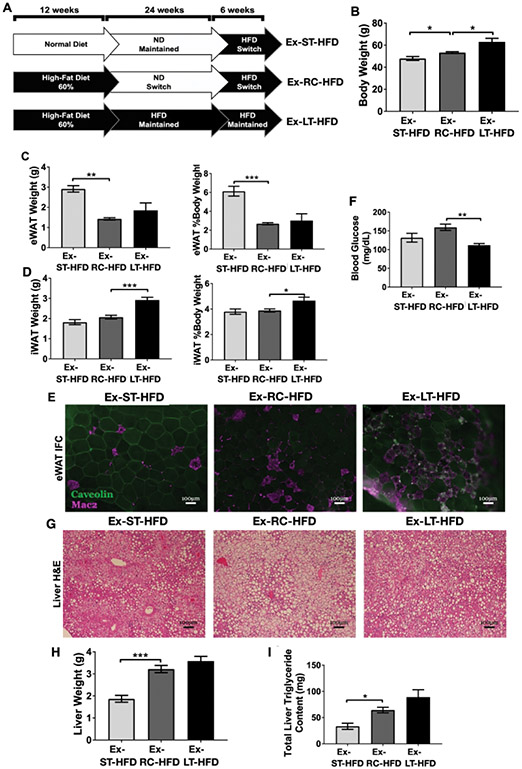
To evaluate the durability of the effects of prior obesity, we extended the duration of weight loss to 24 weeks and then re-challenged mice with HFD for 6 weeks (Ex-RC-HFD) (Figure 4A). Age-matched control mice were maintained on extended ND (Ex-ST-HFD) and extended HFD (Ex-LT-HFD). The Ex-RC-HFD group weighed significantly more than age-matched Ex-ST-HFD mice and significantly less than Ex-LT-HFD mice (Figure 4B). EWAT was reduced in Ex-RC-HFD and Ex-LT-HFD mice compared to Ex-ST-HFD mice in both total mass and as a percent of body weight (Figure 4C). IWAT weight was not significantly different between Ex-RC-HFD and Ex-ST-HFD mice, but both were less than Ex-LT-HFD (Figure 4D). Immunofluorescence of eWAT revealed increased CLS in Ex-RC-HFD and Ex-LT-HFD mice compared to Ex-ST-HFD mice (Figure 4E). Gene expression for adipocyte maturation in eWAT revealed no significant differences between diet conditions (Figure S3A). Fasting blood glucose of Ex-RC-HFD mice was significantly elevated compared to Ex-LT-HFD mice, but not when compared to Ex-ST-HFD mice (Figure 4F).
Figure 4 -. HFD re-challenge after 24 weeks weight loss reveals prolonged defects in eWAT expansion capacity.
(A) Cartoon showing extended ND-switch period of 24 weeks followed by 6 weeks of HFD re-challenge. (B) Body weight of mice after 24wk ND-switch and then re-challenging with HFD. (C) eWAT weight and (D) iWAT weight after HFD re-challenge. (E) Representative immunofluorescence images showing CLS retention. (F) Fasting blood glucose after HFD challenge. (G) Representative liver H&E slides showing steatosis development. (H) Liver weight and (I) total liver triglyceride content after HFD re-challenge. For B-D, F, H, and I, n = 4) * p < 0.05, ** p < 0.01, *** p < 0.001, significance was only compared for Ex-ST-HFD versus Ex-RC-HFD or Ex-LT-HFD versus Ex-RC-HFD.
Liver histology revealed substantial steatosis in all three diet conditions (Figure 4G). Total and percent liver weight were significantly elevated in Ex-RC-HFD and Ex-LT-HFD mice compared to Ex-ST-HFD (Figure 4H). Liver triglycerides were increased in the Ex-RC-HFD and Ex-LT-HFD mice compared to Ex-ST-HFD mice (Figure 4I). Liver gene expression revealed no significant differences between groups for lipid and glucose metabolism genes assessed (Figure S3B-C). Overall, the results show that increasing the recovery time off HFD from 8 weeks to 24 weeks did not improve eWAT expansion nor diminish the development of hepatic steatosis with HFD re-challenge.
eWAT leukocyte content is increased after HFD re-challenge
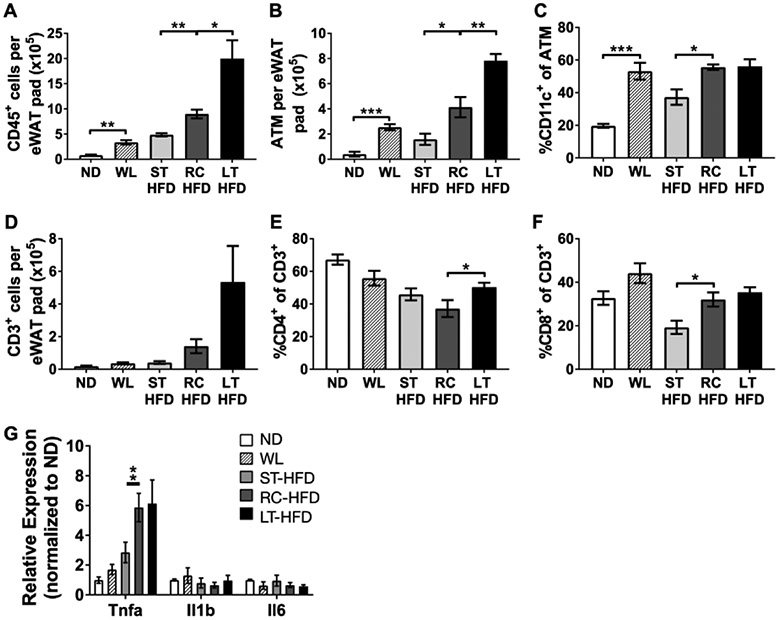
Adipose tissue leukocyte composition was analyzed to determine the impact of HFD re-challenge on eWAT stromal content. Flow cytometry revealed increased total leukocyte accumulation in the eWAT stromal vascular fraction (SVF) of RC-HFD compared to ST-HFD, but less than what was observed in LT-HFD mice (Figure 5A). The total number of eWAT adipose tissue macrophages (ATM) was also significantly increased in RC-HFD mice as well as the frequency of CD11c+ ATMs (Figure 5B-C). Analysis of adipose tissue T cell populations showed a trend towards an increase in total T cell content in RC-HFD mice. However, there was a significantly higher frequency of CD8+ T cells in RC-HFD mice compared to ST-HFD mice (Figure 5D-F). eWAT inflammatory cytokine expression showed Tnfα was increased in RC-HFD and LT-HFD mice compared to ST-HFD, but Il1β and Il6 expression did not differ between groups (Figure 5G). Overall, HFD re-challenge promotes increased inflammation and accelerated accumulation of leukocytes within eWAT.
Figure 5 -. Increased CD11c+ATM accumulation and inflammation with HFD re-challenge.
(A) Frequency of CD45+ leukocytes of all eWAT SVF. (B) Total ATM content per eWAT pad and (C) frequency of all CD45+CD64+ ATM that express CD11c. (D) Total T cell content per eWAT pad. Frequency of (E) CD4+ and (F) CD8+ cells of all adipose tissue T cells. (G) Expression of select inflammatory cytokine genes from whole eWAT. For A-F n = 4; for G n = 3 for ND and WL diet conditions and n = 4 for ST-HFD, RC-HFD and LT-HFD conditions. * p < 0.05, ** p < 0.01, *** p < 0.001, significance was only compared for ST-HFD versus RC-HFD, LT-HFD versus RC-HFD or ND versus WL.
Obesity imposes a durable increase in eWAT preadipocytes despite weight loss
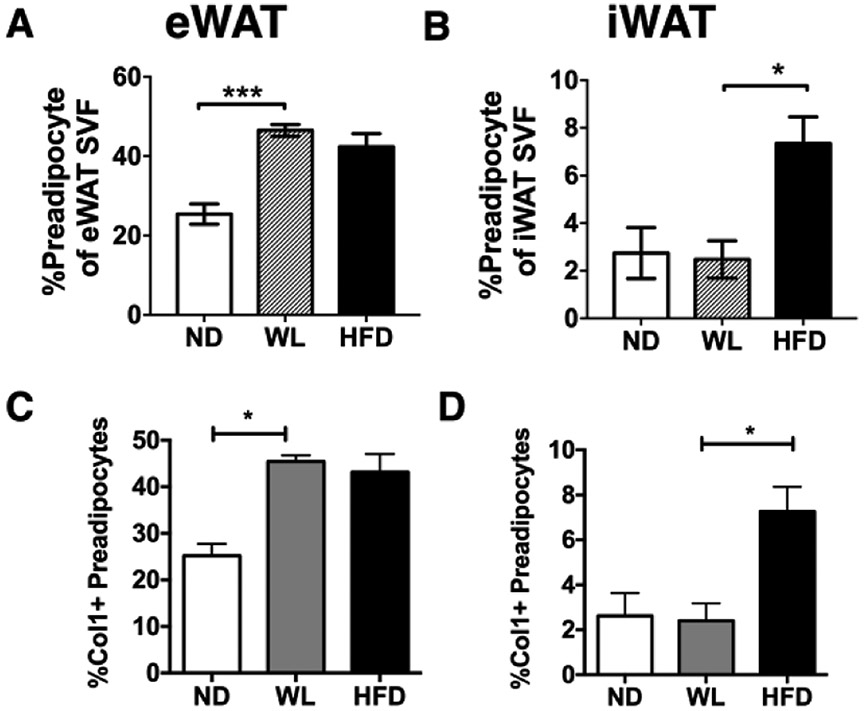
Our observations of decreased eWAT expansion and similar adipocyte size in RC-HFD compared to ST-HFD mice suggested that adipogenesis may be impaired in formerly obese mice. We quantified adipose tissue preadipocytes in the flow cytometry defined as CD45−CD31−Sca-1+PDGFrα+ cells (28, 29). After weight loss (WL), eWAT had an increase in preadipocytes compared to lean mice that was comparable to HFD mice (Figure 6A). This increase in preadipocytes was not observed in iWAT (Figure 6B). Since the increase in preadipocytes correlated with adipose tissue fibrosis during weight loss (23), we used intracellular flow cytometry to quantify ColI+ preadipocytes in lean, obese, and WL groups (Figure 6C-D). This demonstrated an increase in Col1+ preadipocytes in WL and HFD-fed mice in eWAT. Col1+ preadipocytes were induced by obesity in iWAT, but were reduced after weight loss. This suggests that eWAT of formerly obese mice contains an expanded preadipocyte pool that expresses pro-fibrotic markers and correlates with an inability to properly expand during HFD re-challenge.
Figure 6 -. eWAT of formerly obese mice maintains elevated numbers of preadipocytes.
CD45−CD31−Sca-1+PDGFRα+ preadipocytes in normal diet (ND), weight loss (WL) and HFD diet (HFD) fed mice were quantified by flow cytometry in (A) eWAT (n = 4 for all conditions) and (B) iWAT (n = 4 for ND and n = 3 for WL and HFD). The quantity of Collagen 1 (Col1+) preadipocytes was determined by intracellular flow cytometry in (C) eWAT (n = 4 for all conditions) and (D) iWAT (n = 4 for ND and n = 3 for WL and HFD). * p < 0.05, *** p < 0.001, significance was only compared for ND versus WL or WL versus HFD (20wk).
eWAT of formerly obese mice secretes factors that inhibit adipogenesis
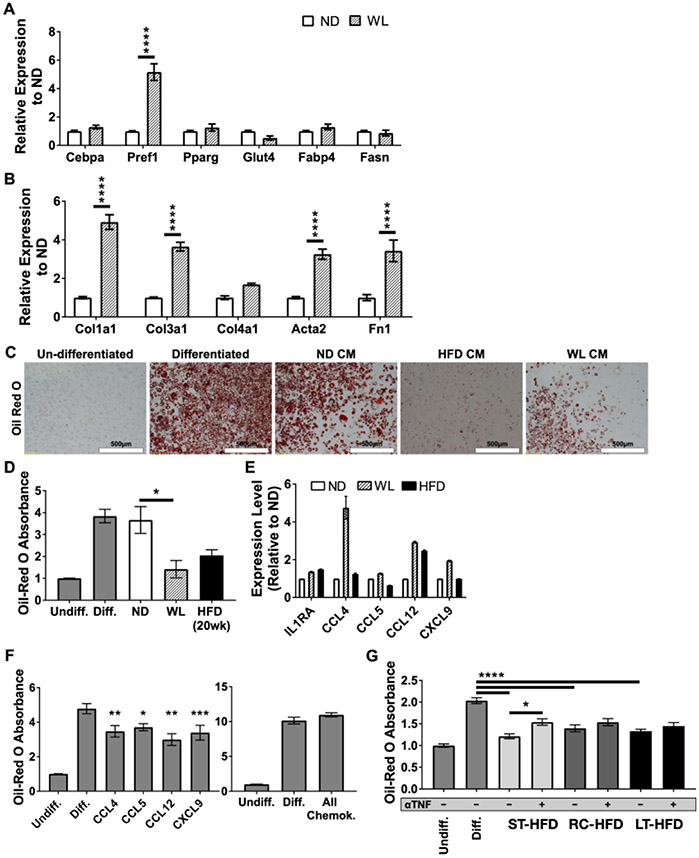
To examine the mechanism of this failure of adipose tissue to expand after HFD re-challenge, we utilized an in vitro model. Conditioned media (CM) was collected from eWAT explant cultures from ND and WL mice in serum-free media for 24 hours and added to 3T3-L1 during induction of adipogenesis. CM from WL mice significantly increased genes normally associated with preadipocyte cells, rather than mature adipocytes, including Pref1, Col1a1, Col3a1, Acta2 and Fn1 expression compared to ND CM treatment (Figure 7A-B). Oil-red-O staining showed that both WL and HFD CM treatment significantly reduced lipid storage compared to ND CM treatment (Figure 7C-D).
Figure 7 -. Conditioned media from eWAT explants of formerly obese mice inhibits adipocyte differentiation and reduces lipogenesis.
Gene expression for (A) adipocyte maturation genes and (B) collagen genes after differentiation induction in the presence of eWAT explant conditioned media from the respective diet conditions (n = 4). Oil red O staining of lipid droplets within differentiated adipocytes shown as (C) representative micrographs and (D) relative total extracted oil red O content from wells (n = 3). (E) eWAT explant multiplex cytokine array (n = 1 for ND and n = 2 for WL and HFD). (F) Extracted relative oil red O content from differentiated 3T3-L1 cells after treatment with (left) 10ng/mL of individual chemokines identified from multiplex cytokine array or (right) simultaneous treatment with all identified chemokines at 10ng/mL each (n ≥ 3). (G) Extracted relative oil red O absorbance after treatment with CM from ST-HFD, RC-HFD or LT-HFD with or without the addition of 50ng/mL neutralizing anti-TNFα antibody (αTNF) during differentiation (n ≥ 4). Undiff. = Undifferentiated Control, Diff. = Differentiated Control, All Chemok. = All identified chemokines. * p < 0.05, ** p < 0.01, *** p < 0.001, **** p <0.0001, significance was only compared for ST-HFD versus RC-HFD, LT-HFD versus RC-HFD or ND versus WL unless otherwise noted.
To determine what factors might be responsible for inhibiting adipogenesis, cytokine arrays evaluated eWAT explant CM from ND, WL, and HFD mice after 48 hours in culture. We observed that IL1ra and chemokines CCL4, CXCL9, CCL5 and CCL12 were elevated in WL CM compared to ND CM (Figure 7E). Treatment of 3T3-L1 cells during differentiation with these chemokines revealed a small, but significant, reduction in differentiation assessed by Oil-red-O (Figure 7F). While treatment with single chemokines only minimally inhibited differentiation, treatment with all four simultaneously abolished inhibition.
TNFα is a known potent inhibitor of adipogenesis (30). Since gene expression for Tnfα was elevated in WL, RC-HFD and LT-HFD eWAT (Figure 5G) we sought to determine if TNFα might play a role in inhibiting adipogenesis in our culture model. TNFα neutralizing antibody was added to CM from eWAT explants before treating 3T3-L1 cells. Treatment of differentiating 3T3-L1 cells with ST-HFD, RC-HFD or LT-HFD CM resulted in equivalent inhibition of differentiation and was similar to what was observed after WL CM or HFD CM treatment (Figure 7G). Exposure to TNFα neutralizing antibody caused small but significant improvement when added to ST-HFD eWAT CM, but no differences were seen in the RC and LT-HFD CM. Overall, the results show that eWAT of obese and formerly obese mice secrete multiple factors which may contribute to impaired adipogenesis and the failure to induce new adipocyte formation upon HFD re-challenge.
Discussion
We have previously demonstrated that the eWAT of formerly obese mice maintains activated leukocytes abnormal eWAT structure (23). In this study, we assess the metabolic and inflammatory consequences of re-challenging formerly obese mice with HFD. Our major finding was that basic functions of adipose tissue to respond to HFD were permanently impaired in formerly obese mice. eWAT of formerly obese mice was unable to efficiently store excessive nutrients and led to increased ectopic lipid storage in the liver and iWAT upon HFD re-challenge. This derangement persists despite extended time off HFD and suggests a permanent impact of obesity on eWAT function and architecture. Compared to weight matched mice not previously exposed to HFD, RC-HFD mice had exaggerated induction of ATMs, increased CD8+ tissue T cells, and increased inflammatory cytokine expression. HFD challenge of formerly obese mice led to reduced eWAT mass with identical adipocyte size compared to ST-HFD mice suggesting impaired adipocyte hyperplasia. The mechanism behind these findings relates to an increased number of collagen I+ preadipocytes as well as eWAT secreted chemokines that can inhibit in vitro adipogenesis.
Our observations are similar to other weight cycling models in rodents that suggest deleterious effects of repeat exposure to HFD (16, 17, 18). Our longer initial HFD exposure (12 weeks) is designed to examine the impact of a prolonged obese state. We note that the RC-HFD group is exposed to HFD for a longer total time than the ST-HFD group which may contribute to the differences between groups. Our results are consistent with studies showing that obesity duration is associated with diabetes in women. (31) Our study is unique as we assessed the durability of the alterations induced by HFD exposure and show that prolonged recovery did not “normalize” the adipose tissue environment or its lipid storage capacity. Observations of maintained inflammation and insulin resistance are seen in both mice and humans after weight loss (20, 21, 24, 25, 26, 32) and is consistent with the genetic evidence that limited peripheral nutrient storage in adipose tissue contributes to diabetes (33).
The limited capacity for eWAT expansion was observed despite a quantitative increase in preadipocytes in formerly obese mice, suggesting that they may have impaired differentiation capacity. This relates to an increase in Col1+ preadipocytes suggesting that they are assuming a myofibroblast phenotype with impaired differentiation (34). In support of this concept, we observed that expression of several critical mature adipocyte-specific genes and proteins were significantly decreased in formerly obese eWAT and remained lower after HFD re-challenge. TNFα neutralization experiments suggested that TNFα may play little, if any, role towards inhibiting adipogenesis in the WL context. Other adipogenesis inhibitors exist that have yet to be examined in our system including, but not limited to, IL-6 (35), Wnt-5a (36), IL-1β (37, 38), macrophage inhibitory factor, and even fatty acids like arachidonic acid (39). Future work is needed to clarify if adipose dysfunction in weight loss is due to factors inhibiting adipogenesis versus permanent defects in adipocyte maturation after obesity.
Relative to the ST-HFD group, RC-HFD mice had elevated total and CD11c+ ATMs as well as an increase in CD8+ adipose tissue T cells. These features resembled the leukocyte increases seen in mice after weight loss and is further evidence of persistence of adipose tissue inflammatory leukocytes once they are established with chronic HFD exposure. This observation is consistent with recent single cell RNA sequencing studies that show that caloric restriction with a HFD sustains a phagocytic ATM population and that gene expression pathways related to inflammation largely resemble obese as opposed to lean mice.(40) We have previously shown that macrophage proliferation is a component of this mechanism of this retention, however new macrophage recruitment or turnover cannot be ruled out.(23)
The livers from RC-HFD mice revealed disproportionally increased liver mass with substantially increased steatosis and total triglyceride content compared to the ST-HFD group. The association between adipocyte death and crown like structures with increased ectopic deposition of lipids into the liver is consistent with other observations (41). In RC-HFD mice, nutrient storage into eWAT was impaired and shifted into iWAT depots – however this was not sufficient to prevent lipid deposition in the liver suggesting specific roles for eWAT in preventing steatosis in mice. Steatosis was associated with increased serum concentrations of AST and ALT indicating liver damage. The ALT to AST ratio was greater than 2:1 in both RC-HFD and LT-HFD mice, compared to 1.3:1 in ST-HFD mice. This ratio matches a classical change observed in patients with early stage non-alcoholic fatty liver disease (NAFLD) and is associated with obesity and increased risk of type 2 diabetes (42). ST-HFD and RC-HFD mice had similar glucose tolerance with substantially increased liver steatosis. However, fasting insulin levels were almost two-fold higher in RC-HFD and LT-HFD mice, indicating increased insulin resistance in the RC-HFD mice, consistent with previous findings showing accrued liver steatosis and impaired liver insulin signaling in weight cycling models (18, 43).
Overall, we were able to identify unique physiologic differences associated with weight regain in formerly obese mice. These findings indicate that obesity may result in long term impairments in adipose tissue function. Future work is needed to investigate the physiologic consequences of obesity that remain despite weight loss, as well as the mechanisms that limit long term adipocyte function hypertrophy and hyperplasia.
Supplementary Material
What is known?
Weight cycling may have adverse metabolic consequences
Obesity alters the architecture of adipose tissue
Mechanisms of adverse long term consequences of obesity are not well understood.
What are the new findings?
Formerly obese mice demonstrate durable changes in epididymal adipose tissue architecture that limits proper depot expansion after rechallenge with high fat diet
The failure of adipose tissue to remodel and permit healthy expansion continues up to 6 months after weight loss in mice and exacerbates hepatic steatosis and liver dysfunction
Weight cycling sustains CD11c+ adipose tissue macrophages, CD8+ adipose tissue T cells, and Col1+ preadipocytes
How might your results change the direction of research or the focus of clinical practice?
Emphasizes the importance of early obesity treatment and prevention
Long term consequences of obesity even after weight loss can impact metabolic flexibility.
Acknowledgements:
We’d like to thank Drs. Cheong-Hee Chang, Philip King, John Osterholzer, Darleen Sandoval (University of Michigan) and Alan Saltiel (University of California San Diego) for critical evaluation of data. This work utilized Core Services from the University of Michigan’s Flow Cytometry Core, University of Michigan Animal Phenotyping Core, and University of Michigan’s Comprehensive Cancer Center Histology Core.
FUNDING: This work was carried out with support from the NIH/NIDDK (R01 DK090262 C.N.L.) and the American Diabetes Association (07-12-CD-08). Trainees were supported by NIH NIAID Experimental Training in Immunology T32 AI007413-19 (B.F.Z. and C.P.), NIDDK F31 DK103524 and an American Heart Association Predoctoral Fellowship (B.F.Z.), NIH Minority Training Supplement (DK090262-S1 G.M-S.) and NIDDK T32 DK101357 and F32 DK105676 (L.A.M.). K.S is supported by an NIDDK/NIH K08 (K08DK101755).
Footnotes
Duality of Interest: The authors report no potential conflict of interest pertaining to this article.
References Cited
- 1.Clement K, Viguerie N, Poitou C, Carette C, Pelloux V, Curat CA, et al. Weight loss regulates inflammation-related genes in white adipose tissue of obese subjects. FASEB J 2004;18: 1657–1669. [DOI] [PubMed] [Google Scholar]
- 2.Steckhan N, Hohmann CD, Kessler C, Dobos G, Michalsen A, Cramer H. Effects of different dietary approaches on inflammatory markers in patients with metabolic syndrome: A systematic review and meta-analysis. Nutrition 2016;32: 338–348. [DOI] [PubMed] [Google Scholar]
- 3.Franz MJ, Boucher JL, Rutten-Ramos S, VanWormer JJ. Lifestyle weight-loss intervention outcomes in overweight and obese adults with type 2 diabetes: a systematic review and meta-analysis of randomized clinical trials. J Acad Nutr Diet 2015;115: 1447–1463. [DOI] [PubMed] [Google Scholar]
- 4.Soleymani T, Daniel S, Garvey WT. Weight maintenance: challenges, tools and strategies for primary care physicians. Obes Rev 2016;17: 81–93. [DOI] [PMC free article] [PubMed] [Google Scholar]
- 5.Puzziferri N, Roshek TB 3rd, Mayo HG, Gallagher R, Belle SH, Livingston EH. Long-term follow-up after bariatric surgery: a systematic review. JAMA 2014;312: 934–942. [DOI] [PMC free article] [PubMed] [Google Scholar]
- 6.Karmali S, Brar B, Shi X, Sharma AM, de Gara C, Birch DW. Weight recidivism post-bariatric surgery: a systematic review. Obes Surg 2013;23: 1922–1933. [DOI] [PubMed] [Google Scholar]
- 7.Mackie GM, Samocha-Bonet D, Tam CS. Does weight cycling promote obesity and metabolic risk factors? Obes Res Clin Pract 2016. [DOI] [PubMed]
- 8.Mehta T, Smith DL Jr., Muhammad J, Casazza K. Impact of weight cycling on risk of morbidity and mortality. Obes Rev 2014;15: 870–881. [DOI] [PMC free article] [PubMed] [Google Scholar]
- 9.Stevens VL, Jacobs EJ, Sun J, Patel AV, McCullough ML, Teras LR, et al. Weight cycling and mortality in a large prospective US study. Am J Epidemiol 2012;175: 785–792. [DOI] [PubMed] [Google Scholar]
- 10.Vergnaud AC, Bertrais S, Oppert JM, Maillard-Teyssier L, Galan P, Hercberg S, et al. Weight fluctuations and risk for metabolic syndrome in an adult cohort. Int J Obes (Lond) 2008;32: 315–321. [DOI] [PubMed] [Google Scholar]
- 11.Zhang H, Tamakoshi K, Yatsuya H, Murata C, Wada K, Otsuka R, et al. Long-term body weight fluctuation is associated with metabolic syndrome independent of current body mass index among Japanese men. Circ J 2005;69: 13–18. [DOI] [PubMed] [Google Scholar]
- 12.Neamat-Allah J, Barrdahl M, Husing A, Katzke VA, Bachlechner U, Steffen A, et al. Weight cycling and the risk of type 2 diabetes in the EPIC-Germany cohort. Diabetologia 2015;58: 2718–2725. [DOI] [PubMed] [Google Scholar]
- 13.Sea MM, Fong WP, Huang Y, Chen ZY. Weight cycling-induced alteration in fatty acid metabolism. Am J Physiol Regul Integr Comp Physiol 2000;279: R1145–1155. [DOI] [PubMed] [Google Scholar]
- 14.Kochan Z, Karbowska J, Swierczynski J. The effects of weight cycling on serum leptin levels and lipogenic enzyme activities in adipose tissue. J Physiol Pharmacol 2006;57 Suppl 6: 115–127. [PubMed] [Google Scholar]
- 15.Fried SK, Hill JO, Nickel M, DiGirolamo M. Prolonged effects of fasting-refeeding on rat adipose tissue lipoprotein lipase activity: influence of caloric restriction during refeeding. J Nutr 1983;113: 1861–1869. [DOI] [PubMed] [Google Scholar]
- 16.Schofield SE, Parkinson JR, Henley AB, Sahuri-Arisoylu M, Sanchez-Canon GJ, Bell JD. Metabolic dysfunction following weight cycling in male mice. Int J Obes (Lond) 2017. [DOI] [PMC free article] [PubMed] [Google Scholar]
- 17.Barbosa-da-Silva S, Fraulob-Aquino JC, Lopes JR, Mandarim-de-Lacerda CA, Aguila MB. Weight cycling enhances adipose tissue inflammatory responses in male mice. PLoS One 2012;7: e39837. [DOI] [PMC free article] [PubMed] [Google Scholar]
- 18.Anderson EK, Gutierrez DA, Kennedy A, Hasty AH. Weight cycling increases T-cell accumulation in adipose tissue and impairs systemic glucose tolerance. Diabetes 2013;62: 3180–3188. [DOI] [PMC free article] [PubMed] [Google Scholar]
- 19.Power C, Thomas C. Changes in BMI, duration of overweight and obesity, and glucose metabolism: 45 years of follow-up of a birth cohort. Diabetes Care 2011;34: 1986–1991. [DOI] [PMC free article] [PubMed] [Google Scholar]
- 20.Cancello R, Zulian A, Gentilini D, Mencarelli M, Della Barba A, Maffei M, et al. Permanence of molecular features of obesity in subcutaneous adipose tissue of ex-obese subjects. Int J Obes (Lond) 2013;37: 867–873. [DOI] [PubMed] [Google Scholar]
- 21.Magkos F, Fraterrigo G, Yoshino J, Luecking C, Kirbach K, Kelly SC, et al. Effects of Moderate and Subsequent Progressive Weight Loss on Metabolic Function and Adipose Tissue Biology in Humans with Obesity. Cell Metab 2016. [DOI] [PMC free article] [PubMed]
- 22.Kratz M, Hagman DK, Kuzma JN, Foster-Schubert KE, Chan CP, Stewart S, et al. Improvements in glycemic control after gastric bypass occur despite persistent adipose tissue inflammation. Obesity (Silver Spring) 2016;24: 1438–1445. [DOI] [PMC free article] [PubMed] [Google Scholar]
- 23.Zamarron BF, Mergian TA, Cho KW, Martinez-Santibanez G, Luan D, Singer K, et al. Macrophage Proliferation Sustains Adipose Tissue Inflammation in Formerly Obese Mice. Diabetes 2017;66: 392–406. [DOI] [PMC free article] [PubMed] [Google Scholar]
- 24.Jung DY, Ko HJ, Lichtman EI, Lee E, Lawton E, Ong H, et al. Short-term weight loss attenuates local tissue inflammation and improves insulin sensitivity without affecting adipose inflammation in obese mice. Am J Physiol Endocrinol Metab 2013;304: E964–976. [DOI] [PMC free article] [PubMed] [Google Scholar]
- 25.Schmitz J, Evers N, Awazawa M, Nicholls HT, Bronneke HS, Dietrich A, et al. Obesogenic memory can confer long-term increases in adipose tissue but not liver inflammation and insulin resistance after weight loss. Molecular Metabolism 2016. [DOI] [PMC free article] [PubMed]
- 26.Kalupahana NS, Voy BH, Saxton AM, Moustaid-Moussa N. Energy-restricted high-fat diets only partially improve markers of systemic and adipose tissue inflammation. Obesity (Silver Spring) 2011;19: 245–254. [DOI] [PubMed] [Google Scholar]
- 27.Martinez-Santibanez G, Cho KW, Lumeng CN. Imaging white adipose tissue with confocal microscopy. Methods in enzymology 2014;537: 17–30. [DOI] [PMC free article] [PubMed] [Google Scholar]
- 28.Lee YH, Petkova AP, Granneman JG. Identification of an adipogenic niche for adipose tissue remodeling and restoration. Cell Metab 2013;18: 355–367. [DOI] [PMC free article] [PubMed] [Google Scholar]
- 29.Lee YH, Petkova AP, Mottillo EP, Granneman JG. In vivo identification of bipotential adipocyte progenitors recruited by beta3-adrenoceptor activation and high-fat feeding. Cell Metab 2012;15: 480–491. [DOI] [PMC free article] [PubMed] [Google Scholar]
- 30.Torti FM, Torti SV, Larrick JW, Ringold GM. Modulation of adipocyte differentiation by tumor necrosis factor and transforming growth factor beta. J Cell Biol 1989;108: 1105–1113. [DOI] [PMC free article] [PubMed] [Google Scholar]
- 31.Hu Y, Bhupathiraju SN, de Koning L, Hu FB. Duration of obesity and overweight and risk of type 2 diabetes among US women. Obesity (Silver Spring) 2014;22: 2267–2273. [DOI] [PMC free article] [PubMed] [Google Scholar]
- 32.Miller RS, Becker KG, Prabhu V, Cooke DW. Adipocyte gene expression is altered in formerly obese mice and as a function of diet composition. J Nutr 2008;138: 1033–1038. [DOI] [PMC free article] [PubMed] [Google Scholar]
- 33.Lotta LA, Gulati P, Day FR, Payne F, Ongen H, van de Bunt M, et al. Integrative genomic analysis implicates limited peripheral adipose storage capacity in the pathogenesis of human insulin resistance. Nat Genet 2017;49: 17–26. [DOI] [PMC free article] [PubMed] [Google Scholar]
- 34.Keophiphath M, Achard V, Henegar C, Rouault C, Clement K, Lacasa D. Macrophage-secreted factors promote a profibrotic phenotype in human preadipocytes. Mol Endocrinol 2009;23: 11–24. [DOI] [PMC free article] [PubMed] [Google Scholar]
- 35.Gustafson B, Smith U. Cytokines promote Wnt signaling and inflammation and impair the normal differentiation and lipid accumulation in 3T3-L1 preadipocytes. J Biol Chem 2006;281: 9507–9516. [DOI] [PubMed] [Google Scholar]
- 36.Bilkovski R, Schulte DM, Oberhauser F, Mauer J, Hampel B, Gutschow C, et al. Adipose tissue macrophages inhibit adipogenesis of mesenchymal precursor cells via wnt-5a in humans. Int J Obes (Lond) 2011;35: 1450–1454. [DOI] [PubMed] [Google Scholar]
- 37.Bing C. Is interleukin-1beta a culprit in macrophage-adipocyte crosstalk in obesity? Adipocyte 2015;4: 149–152. [DOI] [PMC free article] [PubMed] [Google Scholar]
- 38.Gagnon A, Foster C, Landry A, Sorisky A. The role of interleukin 1beta in the anti-adipogenic action of macrophages on human preadipocytes. J Endocrinol 2013;217: 197–206. [DOI] [PubMed] [Google Scholar]
- 39.Petersen RK, Jorgensen C, Rustan AC, Froyland L, Muller-Decker K, Furstenberger G, et al. Arachidonic acid-dependent inhibition of adipocyte differentiation requires PKA activity and is associated with sustained expression of cyclooxygenases. J Lipid Res 2003;44: 2320–2330. [DOI] [PubMed] [Google Scholar]
- 40.Weinstock A, Brown EJ, Garabedian ML, Pena S, Sharma M, Lafaille J, et al. Single-Cell RNA Sequencing of Visceral Adipose Tissue Leukocytes Reveals that Caloric Restriction Following Obesity Promotes the Accumulation of a Distinct Macrophage Population with Features of Phagocytic Cells. Immunometabolism 2019;1. [DOI] [PMC free article] [PubMed] [Google Scholar]
- 41.Strissel KJ, Stancheva Z, Miyoshi H, Perfield JW 2nd, DeFuria J, Jick Z, et al. Adipocyte death, adipose tissue remodeling, and obesity complications. Diabetes 2007;56: 2910–2918. [DOI] [PubMed] [Google Scholar]
- 42.Sattar N, Forrest E, Preiss D. Non-alcoholic fatty liver disease. BMJ 2014;349: g4596. [DOI] [PMC free article] [PubMed] [Google Scholar]
- 43.Barbosa-da-Silva S, da Silva NC, Aguila MB, Mandarim-de-Lacerda CA. Liver damage is not reversed during the lean period in diet-induced weight cycling in mice. Hepatol Res 2014;44: 450–459. [DOI] [PubMed] [Google Scholar]
Associated Data
This section collects any data citations, data availability statements, or supplementary materials included in this article.


