

Abstract
Objective
To use mathematical models to predict the epidemiological impact of lifting the lockdown in London, UK, and alternative strategies to help inform policy in the UK.
Methods
A mathematical model for the transmission of SARS-CoV2 in London. The model was parametrised using data on notified cases, deaths, contacts, and mobility to analyse the epidemic in the UK capital. We investigated the impact of multiple non pharmaceutical interventions (NPIs) and combinations of these measures on future incidence of COVID-19.
Results
Immediate action at the early stages of an epidemic in the affected districts would have tackled spread. While an extended lockdown is highly effective, other measures such as shielding older populations, universal testing and facemasks can all potentially contribute to a reduction of infections and deaths. However, based on current evidence it seems unlikely they will be as effective as continued lockdown. In order to achieve elimination and lift lockdown within 5 months, the best strategy seems to be a combination of weekly universal testing, contact tracing and use of facemasks, with concurrent lockdown. This approach could potentially reduce deaths by 48% compared with continued lockdown alone.
Conclusions
A combination of NPIs such as universal testing, contact tracing and mask use while under lockdown would be associated with least deaths and infections. This approach would require high uptake and sustained local effort but it is potentially feasible as may lead to elimination in a relatively short time scale.
Introduction
The 2019 coronavirus disease (COVID-19) pandemic, caused by Severe Acute Respiratory Syndrome Coronavirus 2 (SARS-CoV2), is currently challenging health systems globally. Since it was first reported from Wuhan, China [1], it has spread globally causing high mortality, particularly among people with pre-existing conditions. In response to the pandemic, several mathematical models have been used to investigate the spread of COVID-19, along with the effectiveness of interventions to interrupt transmission 2, 3, 4, 5, 6, 7, 8. However, these studies have largely focused on early dynamics and the impact of control strategies nationally in the initial phase of the pandemic. Far fewer studies have evaluated the potential options for a post-lockdown future after suppressing new transmissions 9, 10, or modelled spread in metropolitan areas 11, 12, 13.
While it is difficult to disentangle the relative contribution of each measure instituted towards the successful control of COVID-19 in Wuhan, one potentially important element is the discontinuation of all public transportation. Some studies have attempted to evaluate the impact of travel on transmission 14, 15, 16, 17, 18. However, these have focussed on international and/or domestic air travel, rather than intra-city movement.
We present a mathematical model for the spread of SARS-COV2 in London, which accounts for heterogeneity of transmission according to age and geographical location (London boroughs). In previous work [19], we demonstrated a correlation between the spread of influenza-like illnesses (ILI) in London and the use of public transport. Here we use Transport for London (TfL) data to define a contact matrix between the 33 London boroughs to analyse the evolution of the epidemic, and show the impact that local travel restriction has on the transmission of the virus in the English capital. The suppression of COVID-19 in South Korea and the successful containment in Wuhan suggest that a combination of lockdown and non-pharmaceutical interventions may allow control of the epidemic to be established 9, 10. Consequently, we retrospectively examined whether borough specific restriction of movement could have contributed to disease control.
To address the need to identify options to facilitate safe lifting of the current lockdown, we investigated the impact of a range of public health approaches. First, city-wide continuation and removal of lockdown; second, less stringent social distancing and universal testing in the context of a lifted lockdown; third, shielding those over 60 years; fourth, universal testing and the use of face masks without lockdown and fifth, a combined strategy of universal testing, contact tracing and mask use after prolonged lockdown to understand the minimum time to virtual elimination of ongoing virus transmission.
Method
Context and Policy Decisions
As of 30th April 2020, 24,297 cases were registered in London. First imported cases from overseas were reported on 31st January and local transmission within the UK was documented by the beginning of March. Daily data reporting by local authority became available from 9th March [20].
On 12th March, the prime minister announced that the UK was not in the ‘contain’ phase of the pandemic any longer, raised the risk level from moderate to high and restricted testing to patients requiring hospitalisation. Other symptomatic cases were advised to self-isolate without testing. This was followed a few days later by the announcement of the government's intention to scale up SAR COV-2 testing to 10,000 daily and subsequently to 25,000 tests per day and ultimately the current ambition of 100,000 tests daily.
On 17th March, the government announced stronger measures to prevent transmission including encouraging people to work from home whenever possible. Then, on 20th March it was announced that businesses like restaurants, pub, cinemas and theatres would be closing at the end of the day until further notice. And finally, on 23rd March, a full lockdown was announced, where all UK residents other than essential workers would not leave their home for any reason except for grocery shopping, to seek health care, and one form of exercise per day.
The Model
We developed a modified SEIR deterministic compartmental model with a daily time-step (Fig. 1 ) to analyse SARS CoV2 spread in London, accounting for age-specific and geographical heterogeneity in transmission to assess population level effects of non-pharmaceutical interventions. Specifically, we examined the number of deaths and SARS CoV2 infections disaggregated by symptom status (asymptomatic vs. symptomatic): (a) in the general population; (b) by age group (0-14, 15-59 and 60+); and (c) by borough.
Fig. 1.
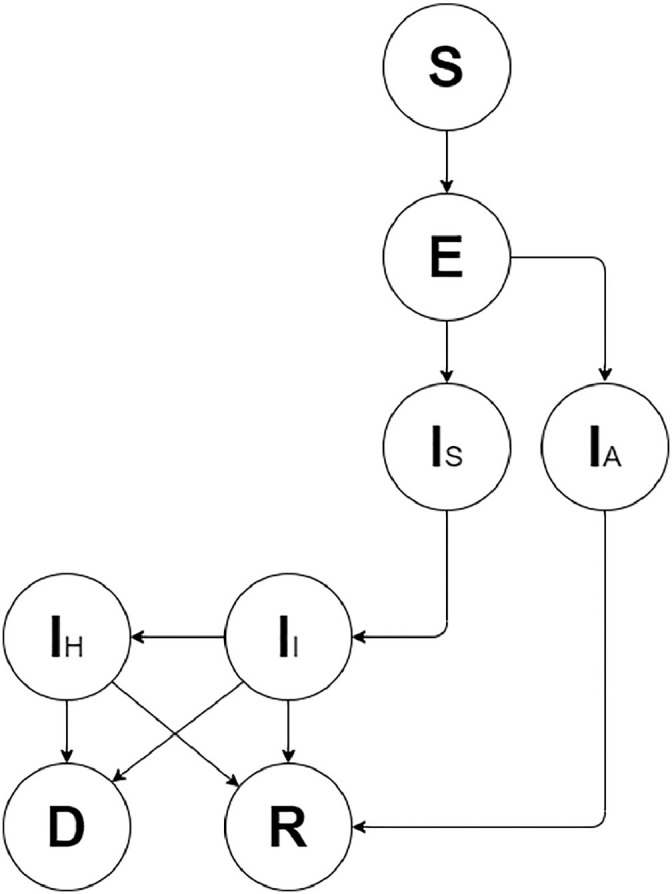
Structure of the model
All individuals are initially susceptible (S) and, once contagion happens, move to the exposed compartment (E) where they remain until they become infectious. Infectious people are either symptomatic (Is) or asymptomatic (IA). Asymptomatic individuals have a lower ability to transmit the infection and all will eventually recover (R). Symptomatic individuals enter an initial stage where they are infectious but not fully aware of their condition yet, thus they freely circulate into the population. Following this delay, they self-isolate (II), but given that many people live in households with others and/or are not fully adherent to self-isolation, they are still able to transmit the infection but at a much lower rate. A proportion of these people will eventually be hospitalised (IH) and will either recover (R) or die (D).
The model was parametrised using data on notified cases and deaths from Public Health England (PHE) and NHS, and mobility from Transport for London (TfL). Technical details about the model, i.e. equations, parametrisation, and calibration, can be found in the Appendix.
Scenarios
We tested the impact of borough specific restriction of movement in the area with the highest number of confirmed cases at the early stages of the epidemic on the transmission of the infection in the borough itself and the whole city.
An extended lockdown may not be a feasible option in the long run. We therefore evaluated several alternative interventions starting on the 8th May, comparing them with a baseline scenario of prolonged lockdown (scenarios 1-5). Specifically, we assessed:
-
1
City-wide continuation and removal of lockdown, comparing the impact of an extended lockdown with an early lift of the lockdown scenario.
-
2
Universal testing (once, twice or three times a week) when less stringent social distancing measures than full lockdown are in place, meaning businesses reopen but people are encouraged to work from home whenever possible and avoid mass gatherings.
-
3
Shielding those older than 60 years in the context of a lifting of lockdown more generally and its impact on the older and younger age groups.
-
4
The impact of combining universal testing and face coverings use without a lockdown.
-
5
Universal testing, isolation of infectious cases and their contacts and use of face coverings during lockdown.
Additional details describing the assumptions for each scenario can be found in the Appendix.
Results
General population
First, we studied the impact of the lockdown at the beginning of the epidemic by running the model for 30 days from 9th March, analysing transmission in London. The analysis revealed a rapid increase of infections, which would have been steeper if lockdown had not been initiated. The current lockdown led to a reduction in cumulative notified cases and cumulative deaths of 69% and 63% respectively. (Fig. 2 ).
Fig. 2.

COVID-19 in London's general population. The figure shows the difference between number of notified infections and deaths with (solid line) and without (dotted line) lockdown and calibration to available data (circles).
Age-disaggregation
Next, we ran the model for the 0-14, 15-59 and 60+ aged populations. The peak in the total number of infections (asymptomatic, symptomatic and hospitalised) fell between early April and early-May depending on uncertainty around the transmission rate β. Using the next generation matrix method 21, 22, 23, we calculated the basic reproduction number R 0. In the absence of social-distancing measures, R 0 = 2.56. Modelling over a 60-day period, we obtain a possible effective reproduction number R(t) = 0.73 (0.30 to 0.98), in line with our results from the non-age disaggregated model.
Our results show that that the majority of infections occur in the 15-59 group, but most cumulative deaths are accrued in the 60+ population. By 8th May, 6,877 infections can be seen in the 15-59 age group, with 4,213 in the 0-14 group and 1,227 in the 60+. At the same time, the number of cumulative deaths in the 60+ group is 4,456 (4,017 to 4,969, 95% confidence bound), compared to 1,354 (1,243 to 1,469, 95% confidence bound) in the 0-59 age group.
Scenarios
Borough specific restriction of movement: The Royal Borough of Kensington and Chelsea (RBKC) was the district with most notified cases on 9th March. We simulated the possible impact of two isolation scenarios, within this district. RBKC residents being isolated from the rest of the city but still able to circulate inside the district leads to a 57% reduction in daily infections on 22nd March within the district. A full lockdown with no movement within the borough would have reduced infections by 97%. In contrast, isolating RBKC has a very limited impact on transmission in the wider city, with a 14% decrease in cumulative infections across London in a scenario where only RBKC is put into lockdown. While lockdown within RKBC would have reduced cumulative infections within the district, the wider impact on the city would have been modest because infection had already been reported in 29 of the 32 boroughs by 9th March 2020.
We also examined multiple alternative scenarios. In Table 1 we summarise the scenarios analysed by comparing them to the baseline case of a prolonged lockdown in terms of cumulative deaths and basic reproductive number.
Table 1.
Comparison between scenarios and the baseline case (prolonged lockdown numbers) showing cumulative deaths and basic reproductive number R0 .
| Scenario | Ratio of cumulative deaths in each scenario compared to prolonged lockdown | Basic Reproductive Number - R0 |
|---|---|---|
| 1. Lockdown lifted on 8th May with no additional intervention | 14.5-fold | 2.56 |
| 2. Less stringent social distancing with | ||
| (i) weekly universal testing, or | (i) 12.1-fold | (i) 2.07 |
| (ii) twice per week, or | (ii) 11.6-fold | (ii) 1.94 |
| (iii) three times per week | (iii) 11.2-fold | (iii) 1.87 |
| 3. Shielding people older than 60 years | 4.5-fold | 3.07 |
| 4. Weekly universal testing with face covering use without lockdown | 11.4-fold | 1.92 |
| 5. Weekly universal testing under lockdown | 0.42-fold | 0.50 |
| Weekly universal testing with face covering use under lockdown | 0.45-fold | 0.44 |
| Weekly universal testing, face covering use, and contact tracing under lockdown. | 0.48-fold | 0.27 |
| Sensitivity analysis of mask use: Lockdown lifted on 8th May with efficacy of | ||
| (i) 30% facemasks and 30% face coverings (ii) 50% facemasks and 50% face coverings (iii) 80% facemasks and 50% face coverings (iv) 80% facemasks and 80% face coverings |
(i) 12.34-fold (ii) 8.86-fold (iii) 8.26-fold (iv) 0.26-fold |
(i) 2.23 (ii) 1.59 (iii) 1.53 (iv) 0.64 |
City-wide continuation vs. removal of lockdown, with and without universal testing
We assessed the impact of city-wide lockdown and projected modelling results up to 547 days (i.e. 1.5 years) from 9th March 2020 (Fig. 3 ). The model estimates that the peak in daily infections and deaths was reached during the last week of April, with approximately a prevalence 16,450 infections and 5,977 cumulative deaths. If current lockdown measures are maintained, we estimate that the infections will slowly and steadily decline, with a reduction of 94% of cases from peak level at the end of April by the 547th day.
Fig. 3.

Numbers of (a) infections and (b) cumulative deaths in London with and without the current lockdown simulated for 547 days. The solid line represents current conditions. The dotted line (:) shows results if current lockdown were lifted on 8th May. a. Infections b. Cumulative deaths
Next (Fig. 3), we tested the scenario of lifting lockdown but still assuming symptomatic people will self-isolate from 8th May 2020 (i.e. 61st day). In this scenario, cumulative infections and daily deaths are substantially higher at 1,800,000 infections on the day of the peak (all types) and 263,000 cumulative deaths. The peak occurs later in this scenario (around mid-June 2020).
Less stringent social distancing with universal testing
We compared results for a continued lockdown against a scenario with less social distancing measures but with frequent universal screening. In these analyses, we evaluate the impact of weekly, twice-weekly and thrice-weekly universal screening. The lockdown is assumed to end on the 8th May but the population is still encouraged to work from home whenever possible and avoid mass gatherings (i.e. equivalent to the less stringent government recommendations from 12th March). These results, when compared to the baseline case of continued lockdown, show that increasing the number of weekly tests has only a small effect on the infections and deaths, compared to the very large effect seen with a prolonged lockdown (Fig. S7).
Shielding individuals over the age of 60 years.
As an alternative to universal testing, we also tested the impact of shielding those in the 60+ age group, while generally lifting lockdown otherwise. While prolonging shielding of the 60+ population has little effect on transmission among the younger age groups (a reduction of 1% in deaths), it has a more substantial impact on the senior population, with a reduction of around 37% of deaths (Fig. S8).
Universal testing and face covering use, without lockdown
Next, we test the potential impact of universal testing for COVID-19, which will include isolation of traced contacts, when combined with face coverings use without concurrent lockdown. Face coverings are face masks if worn by detected infected individuals, or homemade face coverings if worn by the remaining population. More details about face coverings efficacy and assumptions can be found in the appendix.
If lockdown is lifted, universal testing could lead to a possible reduction of 40% in the peak of infections and 12% in cumulative deaths compared to lifting lockdown with no further interventions (12-fold increase in cumulative deaths when compared to a prolonged lockdown). When face coverings are implemented in addition, this strategy results in a 52% reduction in the peak of daily infections and a 20% reduction in cumulative deaths, when compared with ending the lockdown with no additional interventions. This strategy remains less effective than an extended lockdown (11 times the cumulative deaths) (figure S10).
The strategy leading to by far the fewest deaths is to extend lockdown to ensure the complete elimination of the infection from London. Ending lockdown at any point before the epidemic completely dies out will cause the resurgence of a new wave of infection and more than 6 times increase in deaths in the general population, compared with continued lockdown.
Universal testing with face covering use, with lockdown
When combined with ongoing lockdown, weekly universal testing the whole London population starting 8th May is very effective (Fig. 4 ). By preventing most of the transmission caused by asymptomatic individuals, the peak of infection is almost immediately reached, entailing a reduction of almost 42% cumulative deaths and leading to earlier elimination from London, by November 2020.
Fig. 4.

Numbers of (a) infections and (b) cumulative deaths in London with universal testing, facemask use and contact tracing from the 8th May under lockdown. We compared the scenario of a prolonged lock-down with no additional control interventions (solid line), to the prolonged lock-down with weekly universal testing of the whole population (dotted line (:)), to the addition of facemask usage by isolated positive cases and face coverings by the general population, dotted line (-.), and the addition of tracing and isolation of contacts of positive cases (dotted line (-*). a. Infections b. Cumulative deaths
We additionally tested the possible impact of face coverings. While our results show little difference if face coverings are implemented in a scenario without weekly universal testing, when both interventions are combined, this results in a further reduction of cumulative deaths down to 45% (i.e. 1,000 additionally avoided deaths), and the earlier elimination of the infection from London by October 2020. Assuming higher efficacy and uptake of face coverings improves control (Table 1).
Finally, we also added tracing and isolation of direct contacts of positive cases. This additional intervention further reduces cumulative deaths by 48%, when compared to a prolonged lockdown with no additional interventions, leading to earlier elimination of the infection from London by September 2020.
Discussion
COVID-19 represents a major threat to global health. In the context of a novel pathogen, mathematical modelling is fundamental in estimating the short- and long-term effects of possible control strategies, in order to inform national policy decisions. Here we present a comprehensive analysis of transmission dynamics of SARS-CoV-2 in London, integrating data from Public Health England (PHE), NHS and TfL. To our knowledge, no other studies have focused on assessing COVID-19 transmission in London. In our analyses, we confirm that lockdown is a highly effective strategy in reducing infections and mortality, as is clear from empirical data in many countries. Our data show that lifting of lockdown would likely lead to a resurgence of cases, leading to a second peak, as shown by other modelling approaches [10]. However, since lockdown has severe societal and economic implications, we assume that this renders it an unsustainable intervention in the medium- to long-term. We therefore comprehensively assessed a range of potential public health strategies that may be implemented to facilitate lifting of the national lockdown. We find that a strategy that combines continued lockdown with universal testing with case isolation, contact tracing and isolation, and facemask use by the general population is the only scenario with the potential for higher effectiveness in reducing infections, number of deaths and the duration of lockdown, compared to ongoing lockdown with no additional interventions. This strategy can potentially reduce the number of deaths up to 48%, leading to early elimination of the infection from London over an interval of four to six months. At this point, release of lockdown may be possible, though this would have to be followed by sustained measures to prevent importation and contain mini-outbreaks where cases are inadvertently imported once virtual elimination is achieved until a vaccine or effective treatment is found.
The other scenarios evaluated in our analyses were less effective in reducing infections and deaths than ongoing lockdown. Firstly, local, district-level lockdown had little effect on city-wide transmission when implemented after the infection has seeded to other areas or imported from overseas. Such an approach may still be of value if implemented before infections have spread beyond the local level. Second, restricting lockdown to the 60+ age group only results in a reduction of 37% of total deaths within this age group, but has little effect on the younger population. Third, less-stringent social distancing, encompassing encouragement of home-working and avoidance of mass gatherings, with weekly or more frequent universal testing with case isolation has little effect in reducing infections and deaths in the absence of concurrent lockdown.
An extended lockdown is highly effective as long as restriction of movement continues, but this is likely to be unsustainable from an economic and societal point of view. Furthermore, the recent observed increase in all-cause mortality during lockdown, which is in part due to individuals dying from other causes warrants investigation. Nevertheless, lifting the lockdown early, in the absence of other robust control measures, would likely lead to a resurgence of cases and deaths, due to new transmission from residual cases and the ongoing risk of importation. This was recently seen in the Hokkaido prefecture in Japan, where its state of emergency was lifted on 19th March and then reintroduced less than a month later because of a resurgence in numbers of cases.
Facemasks and proper face coverings might well be highly effective at interrupting transmission if used consistently and properly, in line with a recent review highlighting the possible effect of mask-wearing on COVID-19 death toll [24]. However, adherence to such consistent and proper use has been generally poor in prior studies so there is not a strong body of evidence to support effectiveness of their use in practice, beyond use by health care workers 25, 26. We conducted sensitivity analyses to consider what effects might be possible should adherence to efficacious face covering use be higher than that seen in past research studies, which suggest we should not rule out the possibility of substantial benefits from widespread facemask use.
Our analyses have a number of limitations. Firstly, despite making every effort to obtain the best available data for model parameterisation, some data were lacking in the wider literature. Specifically, additional data on hospital admissions and testing and uptake of interventions would be needed for more precise calibration of mortality and notification rates. The lack of community testing data results in more uncertainty in estimates of the size of the epidemic and the cause of deaths in settings such as nursing homes. Moreover, the recent emergence of SARS-CoV-2 entails the use of important epidemic assumptions, such as the assumed efficacy of the interventions evaluated in the absence of randomised controlled trials evaluating each measure on COVID-19. However, our overall results are supported by observations that the cities with current low notifications and deaths are employing the same measures. Furthermore, we assumed natural history characteristics of COVID-19, however, these are in line with other recent COVID-19 models. 4, 5, 6, 8, 10, 13, 14, 15, 16, 7, 27 We used UK-specific parameters such as hospital and ICU admissions, and disease assumptions on latency period, time to recovery and asymptomatic infectiousness from a recent analysis by Ferguson et al [27], which analysed the UK epidemic in detail. This approach ensures consistency in assumptions with this previous work. While we used this previous work 27, 28 as starting points for the calculation of the mortality rates in our model, we obtained different results as we also calibrated the model to local deaths data from the NHS.
In summary, we show that a combined strategy of universal testing, high coverage of contact tracing and general population facemask use while still under lockdown can potentially decrease the total burden on society by leading to elimination in 4 to 8 months. Successful implementation of this approach would require massive scale-up of testing infrastructure, novel contact-tracing strategies, and adherence to case isolation, contact quarantine and facemask use by the general population [29]. The scale and speed of innovation and investment needed will be massive, however, the potential economic gain and human lives saved by such measures would likely be worthwhile, if the need for long-term lockdown can be averted.
Declaration of competing interests
We declare no competing interests.
Ethical approval
Not required.
Funding
No external funding.
Contributors
LG and IA conceived and designed the study. LG and AP contributed to the literature search, LG contributed to data collection, the creation of the model and coding. LG and PS contributed to data analysis. LG, AP and IA contributed to scenario design and interpretation of results. LG, RKG, AP and IA contributed to writing the report.
Acknowledgments
We acknowledge Public Health England (PHE) and NHS for COVID-19 data on cases and deaths. We also acknowledge Transport for London (TfL) for mobility data in London.
Footnotes
Supplementary material associated with this article can be found, in the online version, at doi:10.1016/j.jinf.2020.05.037.
Appendix. Supplementary materials
References
- 1.Chen, S., et al., COVID-19 control in China during mass population movements at New Year. The Lancet, 2020. 395(10226): p. 764-766. [DOI] [PMC free article] [PubMed]
- 2.Ferguson, N.M., et al., Strategies for mitigating an influenza pandemic. Nature, 2006. 442(7101): p. 448-452. [DOI] [PMC free article] [PubMed]
- 3.Halloran, M.E., et al., Modeling targeted layered containment of an influenza pandemic in the United States. Proceedings of the National Academy of Sciences, 2008. 105(12): p. 4639-4644. [DOI] [PMC free article] [PubMed]
- 4.Kucharski, A.J., et al., Early dynamics of transmission and control of COVID-19: a mathematical modelling study. The lancet infectious diseases, 2020. [DOI] [PMC free article] [PubMed]
- 5.Peng, L., et al., Epidemic analysis of COVID-19 in China by dynamical modeling. arXiv preprint arXiv:2002.06563, 2020.
- 6.Hellewell, J., et al., Feasibility of controlling COVID-19 outbreaks by isolation of cases and contacts. The Lancet Global Health, 2020. [DOI] [PMC free article] [PubMed]
- 7.Tang, B., et al., Estimation of the transmission risk of the 2019-nCoV and its implication for public health interventions. Journal of Clinical Medicine, 2020. 9(2): p. 462. [DOI] [PMC free article] [PubMed]
- 8.Tang, B., et al., An updated estimation of the risk of transmission of the novel coronavirus (2019-nCov). Infectious disease modelling, 2020. 5: p. 248-255. [DOI] [PMC free article] [PubMed]
- 9.Leung, K., et al., First-wave COVID-19 transmissibility and severity in China outside Hubei after control measures, and second-wave scenario planning: a modelling impact assessment. The Lancet, 2020. [DOI] [PMC free article] [PubMed]
- 10.Prem, K., et al., The effect of control strategies to reduce social mixing on outcomes of the COVID-19 epidemic in Wuhan, China: a modelling study. The Lancet Public Health, 2020. [DOI] [PMC free article] [PubMed]
- 11.Hong, N., et al., Evaluating the secondary transmission pattern and epidemic prediction of the COVID-19 in metropolitan areas of China. medRxiv, 2020. [DOI] [PMC free article] [PubMed]
- 12.Stier, A., M. Berman, and L. Bettencourt, COVID-19 attack rate increases with city size. Mansueto Institute for Urban Innovation Research Paper Forthcoming, 2020.
- 13.Rocha Filho, T.M., et al., Expected impact of COVID-19 outbreak in a major metropolitan area in Brazil. medRxiv, 2020.
- 14.Gilbert, M., et al., Preparedness and vulnerability of African countries against importations of COVID-19: a modelling study. The Lancet, 2020. 395(10227): p. 871-877. [DOI] [PMC free article] [PubMed]
- 15.Tuite, A.R., et al., Estimation of COVID-19 outbreak size in Italy. The Lancet infectious diseases, 2020. [DOI] [PMC free article] [PubMed]
- 16.Chinazzi, M., et al., The effect of travel restrictions on the spread of the 2019 novel coronavirus (COVID-19) outbreak. Science, 2020. [DOI] [PMC free article] [PubMed]
- 17.Du, Z., et al., Risk for transportation of 2019 novel coronavirus (COVID-19) from Wuhan to cities in China. medRxiv, 2020.
- 18.Dong, E., H. Du, and L.J.T.L.I.D. Gardner, An interactive web-based dashboard to track COVID-19 in real time. 2020. [DOI] [PMC free article] [PubMed]
- 19.Goscé, L. and A. Johansson, Analysing the link between public transport use and airborne transmission: mobility and contagion in the London underground. Environmental Health, 2018. 17(1): p. 84. [DOI] [PMC free article] [PubMed]
- 20.England, P.H. Coronavirus (COVID-19) in the UK. 2020; Available from: https://coronavirus.data.gov.uk/.
- 21.van den Driessche, P., Reproduction numbers of infectious disease models. Infectious Disease Modelling, 2017. 2(3): p. 288-303. [DOI] [PMC free article] [PubMed]
- 22.Diekmann, O., J.A.P. Heesterbeek, and J.A. Metz, On the definition and the computation of the basic reproduction ratio R 0 in models for infectious diseases in heterogeneous populations. Journal of mathematical biology, 1990. 28(4): p. 365-382. [DOI] [PubMed]
- 23.Van den Driessche, P. and J. Watmough, Reproduction numbers and sub-threshold endemic equilibria for compartmental models of disease transmission. Mathematical biosciences, 2002. 180(1-2): p. 29-48. [DOI] [PubMed]
- 24.Howard, J.H., A.; Li, Z.; Tufekci, Z.; Zdimal, V.; van der Westhuizen, H.; von Delft, A.; Price, A.; Fridman, L.; Tang, L.; Tang, V.; Watson, G.L.; Bax, C.E.; Shaikh, R.; Questier, F.; Hernandez, D.; Chu, L.F.; Ramirez, C.M.; Rimoin, A.W., Face Masks Against COVID-19: An Evidence Review. . Preprints, 2020. 2020040203.
- 25.MacIntyre, C.R. and A.A. Chughtai, Facemasks for the prevention of infection in healthcare and community settings. Bmj, 2015. 350: p. h694. [DOI] [PubMed]
- 26.Liang, M., et al., Efficacy of face mask in preventing respiratory virus transmission: a systematic review and meta-analysis. medRxiv, 2020. [DOI] [PMC free article] [PubMed]
- 27.Ferguson, N., et al., Report 9: Impact of non-pharmaceutical interventions (NPIs) to reduce COVID19 mortality and healthcare demand. 2020. [DOI] [PMC free article] [PubMed]
- 28.Verity, R., L. Okell, and I. Dorigatti, Estimates of the severity of COVID-19 disease. medRxiv 2020.
- 29.WHO head: 'Our key message is: test, test, test', in BBC. 2020.
Associated Data
This section collects any data citations, data availability statements, or supplementary materials included in this article.