

Abstract
Purpose:
The CA19–9 biomarker is elevated in a substantial group of patients with pancreatic ductal adenocarcinoma (PDAC), but not enough to be reliable for the detection or diagnosis of the disease. We hypothesized that a glycan called sTRA (sialylated tumor-related antigen) is a biomarker for PDAC that improves upon CA19–9.
Experimental Design:
We examined sTRA and CA19–9 expression and secretion in panels of cell lines, patient-derived xenografts, and primary tumors. We developed candidate biomarkers from sTRA and CA19–9 in a training set of 147 plasma samples and used the panels to make case–control calls, based on predetermined thresholds, in a 50-sample validation set and a blinded, 147-sample test set.
Results:
The sTRA glycan was produced and secreted by pancreatic tumors and models that did not produce and secrete CA19–9. Two biomarker panels improved upon CA19–9 in the training set, one optimized for specificity, which included CA19–9 and 2 versions of the sTRA assay, and another optimized for sensitivity, which included 2 sTRA assays. Both panels achieved statistical improvement (P < 0.001) over CA19–9 in the validation set, and the specificity-optimized panel achieved statistical improvement (P < 0.001) in the blinded set: 95% specificity and 54% sensitivity (75% accuracy), compared with 97%/30% (65% accuracy). Unblinding produced further improvements and revealed independent, complementary contributions from each marker.
Conclusions:
sTRA is a validated serological biomarker of PDAC that yields improved performance over CA19–9. The new panels may enable surveillance for PDAC among people with elevated risk, or improved differential diagnosis among patients with suspected pancreatic cancer.
Introduction
The proper management and treatment of cancer begins with reliable detection and diagnosis of the disease. Reliable detection and diagnosis can be particularly challenging for pancreatic ductal adenocarcinoma (PDAC), owing to the internal location of the tumors, similarities to benign conditions, and heterogeneity between patients in the makeup of the tumors. A molecular feature shared by most PDACs is increased levels of a glycan called the CA19–9 antigen. CA19–9 is used for specific purposes, such as to confirm the diagnosis of PDAC, assess responses to treatment, or screen for recurrence, but it has limitations (1–3). It is not useful for the substantial group of patients without elevations in the marker, and it shows a ~25% false-positive rate among patients with benign conditions of the pancreas using a threshold that gives a ~75% true-positive rate (4). Elevated cutoffs provide <5% false-positive rates, but with detection of just 25% to 50% of patients (1). CA19–9 by itself, therefore, is not sufficient for rendering a diagnosis or for unequivocally assessing responses to treatment. However, it detects a major subset of patients and is still one of the most-used biomarkers in oncology. In fact, over the several decades since the discovery of CA19–9, no biomarker has been established to surpass its performance.
We previously investigated the concept that the tumors that do not overproduce CA19–9 are different from those that do, and that they produce alternate glycans that are structurally similar to the CA19–9 antigen. One class of glycans we found is based on a structural isomer of the CA19–9 antigen called sialyl-Lewis X (5, 6). The sialy-Lewis X glycan showed elevations in 30%–50% of the patients with low CA19–9 but also showed elevations in about 10% of patients with benign pancreatic diseases. Another glycan, referred to as sTRA, was elevated in up to half of the patients with low CA19–9, with very low false-positive rates (7). In subsequent research, we found that the cells producing sTRA are different in location, morphologies, and molecular characteristics than the cells producing CA19–9 (8). The above findings suggested that the sTRA glycan would be a serological biomarker for pancreatic cancer that could improve upon CA19–9.
Many previous studies have examined candidate biomarkers for PDAC [see reviews (9–11) and discussion]. Based on information from the previous work, we incorporated several considerations into this study. The most rigorous test of a bio-marker is to apply it to independent, blinded samples, make case/control calls on each sample, and assess performance by comparing the calls to a “true” case/control status based on a gold standard. Most reports of candidate biomarkers do not include such a test. In this study, the gold standard was the diagnosis arrived at through the full information available for each patient, and a benchmark was the performance of CA19–9. We further ensured a rigorous test of performance by emphasizing the detection of resectable cancer (stage I/II cancers), and by testing specificity for cancer relative to benign conditions of the pancreas.
Another unique aspect of this study is an examination of the biomarker production and secretion in tumor models and primary tumors. The most effective cancer markers are the ones produced and secreted by the cancer cells, rather than as secondary effects from the liver or inflammatory processes. An analysis of biomarker production across tumor models and primary tumors, together with an assessment of the secreted levels in each, could help to confirm that the biomarker is directly produced by the cancer cells and that elevations in the blood plasma result from secretion by the cancer cells. Such a study also could confirm the complementary relationship between CA19–9 and sTRA, which many cancers that do not produce CA19–9 produce sTRA.
In this study, we demonstrate that sTRA provided significantly improved performance over CA19–9 in a double-blinded test using preset thresholds and classification rules. The improved performance was the result of complementary elevations among CA19–9 and 2 versions of the sTRA assay, comprising a 3-marker panel. Studies of cell-culture and patient-derived xenograft (PDX) models of pancreatic cancer and primary tumors confirmed these relationships.
Materials and Methods
Human specimens
The study was conducted under protocols approved by the Institutional Review Boards at the Van Andel Research Institute, the University of Pittsburgh Medical Center, MD Anderson Cancer Center, the Mayo Clinic, and the Medical University of South Carolina. All subjects provided written, informed consent, and all methods were performed in accordance with an assurance filed with and approved by the U.S. Department of Health and Human Services.
All collections took place prior to any surgical, diagnostic, or medical procedures. The donors consisted of patients with pancreatic cancer or a benign condition involving the pancreas, and from healthy subjects (Table 1). The healthy subjects had no evidence of pancreatic, biliary, or liver disease. All blood samples (EDTA plasma) were collected according to the standard operating procedure from the Early Detection Research Network and were frozen at −70 °C or colder within 4 hours of time of collection. Aliquots were shipped on dry ice and thawed no more than 3 times prior to analysis.
Table 1.
Composition of the sample sets
| Training/validation | Test | ||||||
|---|---|---|---|---|---|---|---|
| Site | UPMC | All | UPMC | MDACC | Mayo | ||
| Total samples, N | 147 | 50 | 197 (147 + 50) | 147 | 86 | 41 | 20 |
| Cancer, N | 72 | 25 | 97 | 71 | 30 | 41 | 0 |
| Average age, y (SD) | a65.3 (10.6) | a72.8 (8.6) | a67.3 (10.6) | 66.3 (9.0) | 68.7 (8.6) | 64.5 (9.0) | – |
| Percent male | 55.6% | 40.0% | 51.6% | 52.1 | 50.0 | 53.7 | – |
| Control, N | 75 | 25 | 100 | 76 | 56 | 0 | 20 |
| Average age, y (SD) | a57.8 (15.6) | a61.1 (15.4) | a58.7 (15.5) | 65.0 (10.6) | 65.1 (9.2) | – | 64 (13.8) |
| Percent male | 45.3% | 48.0% | 46.0% | 44.1 | 37.5 | – | 61.9 |
| Cancer stages | |||||||
| Stage I, N (%) | 2 (2.8) | 1 (4.0) | 3 (3.1) | 17 (23.9) | 2 (6.7) | 15 (36.6) | 0 |
| Stage II, N (%) | 43 (59.7) | 15 (60.0) | 58 (59.8) | 40 (56.3) | 28 (93.3) | 12 (29.3) | 0 |
| Stage III, N (%) | 14 (19.4) | 6 (24.0) | 20 (20.6) | 5 (7.0) | 0 | 5 (12.2) | 0 |
| Stage IV, N (%) | 13 (18.1) | 3 (12.0) | 16 (16.5) | 9 (12.7) | 0 | 9 (22.0) | 0 |
| Control types | |||||||
| Chronic pancreatitis, N (%) | 33 (44.0) | 13 (52.0) | 46 (46.0) | 15 (19.7) | 15 (26.8) | 0 | 0 |
| Benign biliary stricture, N (%) | 14 (18.7) | 9 (36.0) | 23 (23.0) | 8 (10.5) | 8 (14.3) | 0 | 0 |
| Abnormal imaging, N (%) | 24 (32.0) | 3 (12.0) | 27 (27.0) | 0 | 0 | 0 | 0 |
| Chronic diabetic, N (%) | 0 | 0 | 0 | 24 (31.6) | 4 (7.1) | 0 | 20 (100.0) |
| Healthy control, N (%) | 0 | 0 | 0 | 20 (26.3) | 20 (35.7) | 0 | 0 |
| Pancreatic cyst, N (%) | 4 (5.3) | 0 | 4 (4.0) | 9 (11.8) | 9 (16.1) | 0 | 0 |
Indicates a significant difference (P < 0.001, Wilcoxon rank-sum test) between cases and controls. Cells with an em-dash have no value because subjects were not included in that category.
Sandwich immunoassays
The antibody array methods followed those presented earlier (12–14) with slight modifications. The capture antibodies were CA19–9 (1116-NS-19–9; MyBioSource), anti-MUC5AC (45M1; Thermo Scientific), and anti-MUC16 (X325; Abcam). The biotinylated primary antibodies were CA19–9 (clone 1116-NS-19–9; MyBioSource) or TRA-1–60 (TRA-160; Novus Biologicals). The secondary detection agent was Cy5-conjugated streptavidin (Roche Applied Science). The Supplementary Materials and Methods contain details of the assays, the calibrators and controls, and the processing of biomarker data and the acquisition of immunofluorescence data.
Statistical methods
The case/control comparisons of individual biomarker values measured on a continuous scale were performed using the 2-sided Student t test. The case/control comparisons of gender used the Fisher exact test, and the comparisons of age used the Wilcoxon rank-sum test. To assess relationship between biomarkers and covariates, we presented Spearman correlation between biomarker and continuous covariates and tested for equivalence in biomarker distribution across covariate categories using Wilcoxon rank-sum test (when there are 2 categories) or the Kruskal–Wallis rank-sum test (when there are more than 2 categories). To test for difference in the average of sensitivity and specificity between a panel and CA19–9, we computed bootstrap standard error of the summary measure using nonparametric bootstrap (15) with 1,000 resamples stratified on case/control status, and computed 2-sided P value with the Wald test. Statistical analyses were performed using R statistical software (version 3.5.1).
Results
Detecting the sTRA and CA19–9 glycans
The CA19–9 antigen (Fig. 1A) is a tetrasaccharide detected by the CA19–9 monoclonal antibody (16). A monoclonal antibody called TRA-1–60 (17) detects the presumed precursor of the CA19–9 antigen, a non-fucosylated and non-sialylated tetrasaccharide (Fig. 1A; ref. 18). To indirectly detect the sialylated version of the TRA-1–60 antigen, which is referred to as sTRA (sialylated tumor-related antigen), we treat the antigen with sialidase prior to detection (Fig. 1A). Both CA19–9 and sTRA appear on multiple glycoproteins and glycolipids (19, 20). In the blood of patients with pancreatic cancer, we previously detected the glycans primarily on the mucins MUC1, MUC5AC, and MUC16, and more rarely on MUC5B and MUC3A (7, 13, 21). We further showed that the cancer cells producing CA19–9 are separate from those producing sTRA (8). If the cancer cells secrete the antigens accordingly (Fig. 1B), we would expect plasma samples to show elevations of one, both, or neither of the markers with frequencies similar to observed in tissue.
Figure 1.

The CA19–9 and sTRA assays. A, The epitopes detected by the CA19–9 and TRA-1–60 antibodies. B, Potential secretion of carriers of single or dual antigens. C, In the CA19–9 assay, both the capture and detection antibodies detect the glycan epitope of the CA19–9 antibody. In the sTRA assay, the capture antibodies target either the CA19–9 antigen or a protein carrier of sTRA. After sample incubation, the captured material is treated with sialidase and then probed with the TRA antibody.
The standard CA19–9 assay uses a CA19–9 antibody for both capture and detection (Fig. 1C). For sTRA, we detected the antigen on 3 different capture antibodies: CA19–9, anti-MUC5AC, and anti-MUC16 (Fig. 1C). The combinations of capture and detection antibodies are referred to as CA19–9:sTRA, MUC5AC: sTRA, and MUC16:sTRA, respectively.
The sTRA antigen in CA19–9-negative cancer models and primary tumors
To determine whether various models of pancreatic cancer make and secrete sTRA, and whether it is produced by some that do not produce CA19–9, we examined a panel of 10 cell lines derived from pancreatic cancers. Some of the cell lines produced only CA19–9, others only sTRA, and others both or neither (Fig. 2A and B). The amount secreted into the media roughly corresponded to the amount on the cell surfaces (Fig. 2B; Supplementary Fig. S1), and certain cell lines secreted almost exclusively only one of the glycans (Fig. 2B). PDX models potentially provide a more faithful representation of primary tumors. Across a panel of 13 PDX models, sTRA was produced and secreted by several tumors showing low levels of CA19–9 (Fig. 2C and D), and the levels of sTRA and CA19–9 in the sera correlated with tumor expression (Supplementary Fig. S1). The prevalence of each type could be different from those observed in clinical plasma samples, because differences could exist between the types in the take rates in culture or in PDX mice, but the models confirm that some PDACs make only one of the glycans, and others make both.
Figure 2.

Complementary elevations of CA19–9 and sTRA in model systems. A, Immunofluorescence staining of mouse xenografts of cell lines showed variable expression of the 2 markers. B, Quantification of the cell surface and secreted levels showed the certain cell lines produced primarily one or the other glycans. C, Immunofluorescence staining of PDX tissue also showed variable expression of the 2 markers. D, Quantification of the levels in the mouse tissue and sera showed complementary patterns of expression.
Next, we used a tissue microarray to determine glycan expression in the primary tumors of 52 patients, and we used the CA19–9 and sTRA sandwich assays (Fig. 1D) to determine the levels in matched blood plasma. The staining in the tumors was diverse (Fig. 3A and B), as observed in the cell lines and PDX models, and the levels in blood plasma showed that certain patients had elevations in only CA19–9 or sTRA (Fig. 3B). The blood levels of each marker correlated with the tissue levels (Supplementary Fig. S1). Overall, the models and primary tumors showed that sTRA is produced by a substantial subset of PDACs, that the secreted levels reflect the tumor levels, and that it occurs in many cases not showing production or secretion of CA19–9.
Figure 3.

Complementary elevations in primary tumors and plasma. A, Immunofluorescence staining showed expression of one, both, or neither of the markers. B, The quantification of tissue and plasma levels revealed low correspondence between the 2 markers. A substantial group of patients was elevated in only sTRA, based on thresholds set to the highest control samples (dashed lines), but the high correlation (0.74) was caused by one outlier value (arrowhead).
Improved classification performance using the combined markers
To explore the performance of sTRA as a plasma biomarker, we measured CA19–9 and the 3 sTRA assays (complete data in Supplementary Table S1) in an initial set of blood plasma from 147 subjects (Table 1). As an individual marker, the CA19–9:sTRA assay performed similarly to CA19–9 (Fig. 4A). The CA19–9 performance was in agreement with previous reports (1) and our previous studies (4) on similar cohorts, yielding 70% to 75% sensitivity at 70% to 75% specificity (Fig. 4A). All markers except MUC5AC:sTRA had significantly-higher (P < 0.05) means in stage III to IV than in stage I to II cancer (Supplementary Table S2), but the overall biomarker performance, as assessed by receiver-operator characteristic analysis, was only slightly higher in stage III to IV cancer (Supplementary Fig. S2). None of the markers showed a significant difference between control types (Supplementary Table S2).
Figure 4.

Biomarker panel development. A, The CA19–9 and sTRA assays were quantified in 72 case and 75 control plasma specimens. As a single marker, the CA19–9:sTRA assay performed similarly to CA19–9. B, The correlations between the sTRA markers and CA19–9 were very low, with samples elevated in one, both, or neither of the markers. C, A threshold was applied to each marker in the panel or to CA19–9 alone, and samples with an elevation in any marker were called as cases. In the panel optimized for specificity shown here, the panel identified more of the cases than CA19–9. D, The performance of both panels was better than CA19–9 in the training set and in the application of the predetermined thresholds to the 50-sample validation set. For both panels, the difference in the average of sensitivity and specificity was significant (P < 0.001). The difference is the average over 1,000-fold bootstrapping analysis, and the error bars are the 95% confidence intervals. E, The breakdown of marker contributions and the improvement in final performance were similar between the training and validation sets.
The relationships between the assays were the same as in the model systems—complementary, non-correlated elevations in the sTRA and CA19–9 assays (Fig. 4B). We therefore sought to develop a biomarker panel that included any combination of CA19–9 and the sTRA assays. Using the MSS method (22), we identified 2 lead panels, one that provided high specificity for the detection of cancer (low false-positive rate), and another with high sensitivity (low false-negative rate). A threshold is applied to each of 2 or 3 markers, and each pattern of is assigned as a “case state” or a “control state” (Fig. 4C; Supplementary Materials and Methods for details on the thresholds used for each marker). By classifying the subjects with an elevation in any member of the panel as a case, overall performance was improved relative to CA19–9, both for the specificity-optimized panel and for the sensitivity-optimized panel that did not include CA19–9 (Fig. 4D).
We then applied the biomarker panels to independent samples, comprising 25 cases and 25 controls with similar makeup as the training set (Table 1). We used the predetermined thresholds and classification rules from the 147-sample training set to make a case/control call on each sample (complete data in Supplementary Table S1). For CA19–9, the thresholds also were based on the training set—one to give high specificity, and another to give high sensitivity—and subjects with levels above the threshold were called as cases. The increases in average sensitivity and specificity over CA19–9 was statistically significant for both panels (P < 0.001, 1,000-fold bootstrapping), and improvements in either sensitivity or specificity relative to CA19–9 were consistent with the training set (Fig. 4D).
In both panels, we saw that a substantial percentage of patients were in the complementary subsets of patients that were classified as cases (Fig. 4E), indicating that each member of the panels contributed independent information. In addition, the complementary contributions of the individual panel members were consistent between the training and validation sets.
Blinded validation of improved sensitivity and specificity
We then applied each panel to a new set of 147 samples that was run blinded. We applied the predetermined thresholds, made a case/control call on each sample, and sent the calls to a separate site for determination of performance. The predetermined thresholds for both the panel biomarkers and CA19–9 were based on the combined 147-sample training and the 50-sample validation sets. The data and thresholded results are in Supplementary Tables S3 and S4.
The panel optimized for specificity gave high specificity and improved sensitivity over CA19–9 from 30% to 54%. The panel optimized for sensitivity gave moderate gains over CA19–9 in both sensitivity and specificity (Fig. 5A). The difference in the average of specificity and sensitivity was statistically significant (P < 0.001) for the specificity panel, and the difference was positive but not statistically significant (P = 0.18) for the sensitivity panel (Fig. 5A).
Figure 5.
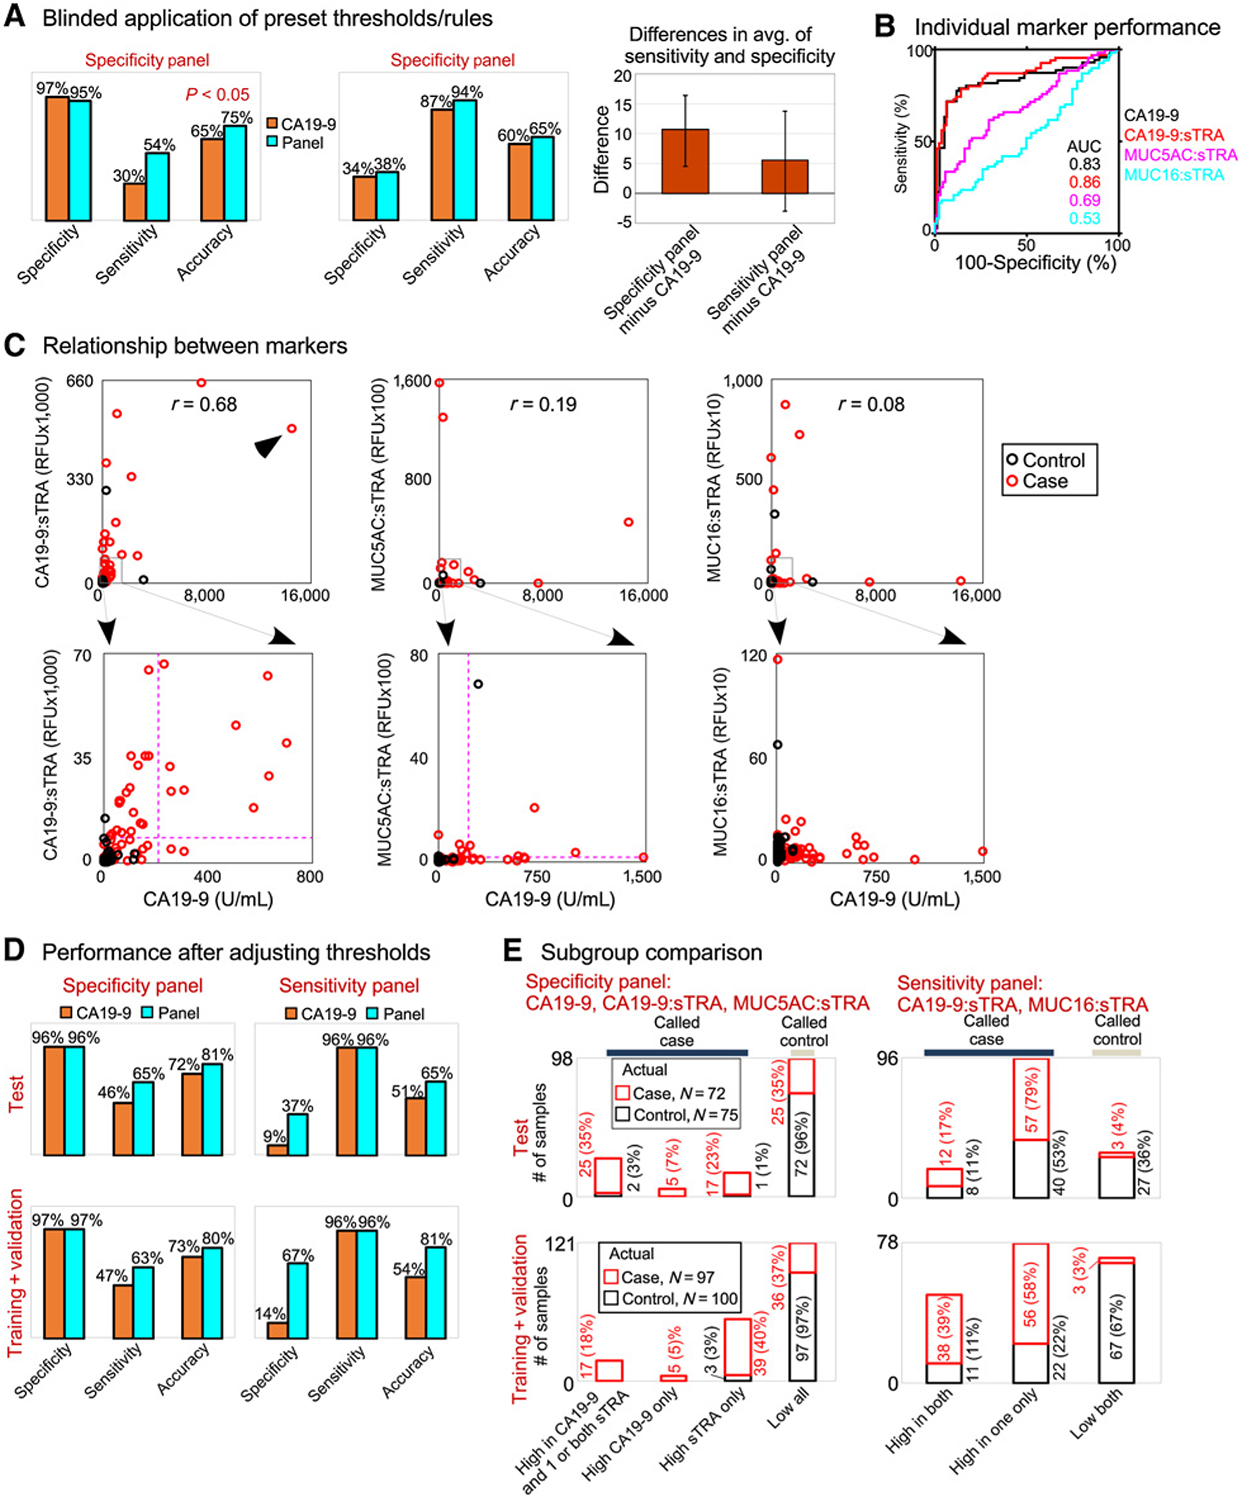
Application to blinded samples. The 2 biomarker panels were applied to a blinded set of 147 samples, using predetermined marker thresholds and classification rules. A, Both panels improved upon CA19–9. The difference in the average of sensitivity and specificity was significant (P < 0.001) for the specificity panel, based on 1,000-fold bootstrapping analysis. B, The individual marker performances matched the training set. C, The sTRA and CA19–9 markers showed complementary elevations. The higher correlation (0.68) was caused by a sample that was very high in both (arrowhead). The dashed lines show the predetermined thresholds for the specificity panel. D, The improvements in either sensitivity or specificity were consistent between the training and test sets. E, The independent contributions of each panel member and the improvements of the panels over CA19–9 were consistent between the training and test sets.
The performance of the individual panel members and their relationship to each other was consistent with the training and validation sets. The individual CA19–9:sTRA assay performed similarly to CA19–9 and better than the other sTRA assays (Fig. 5B), and complementary elevations were observed between CA19–9 and the sTRA assay (Fig. 5C). The CA19–9 and CA19–9:sTRA assays were correlated, due to 2 samples with high levels in both, but several samples were elevated in only one or the other of the assays. The marker levels were higher (P < 0.05) in stage III to IV cancers (Supplementary Table S2), but the AUCs in ROC analysis were similar between stage I to II and stage III to IV cancers (Supplementary Fig. S2). Among the controls, benign biliary stricture and chronic pancreatitis showed higher levels than the other control groups in CA19–9 and CA19–9:sTRA (Supplementary Table S2). Such elevations are commonly observed, and the difference from the training set is likely due to natural variation.
Because the training set may not fully represent the whole population of cases and controls, we investigated whether a simple adjustment of the individual marker thresholds would improve the performance of the panels or CA19–9. The adjusted specificity-optimized panel gave 96% specificity and 65% sensitivity, better than the optimized CA19–9 performance of 96% specificity and 46% sensitivity (Fig. 5D). The adjusted sensitivity-optimized panel gave 96% sensitivity and 37% specificity, but CA19–9 gave just 9% specificity at 96% sensitivity (Fig. 5D). The improvements of the panels relative to CA19–9 were very similar between the test set and the full 197-sample training set.
In both the test set and the full, 197-sample training set, each member of the panels provided independent, complementary value (Fig. 5E). The percentages in patient subsets were remarkably similar between the sets. These results indicate that the relationships between the individual markers were consistent over all sets, and that the marker panels gave consistently improved performance over CA19–9.
Discussion
A biomarker that improves upon CA19–9 would be a significant advance in diagnostics for pancreatic cancer, given the fact that no biomarker has achieved that feat in the several decades since the development of CA19–9. The uses for such a bio-marker could include screening or surveillance for pancreatic cancer, and differential diagnosis of pancreatic cancer relative to benign conditions. Whether a new biomarker will find value in clinical application depends on the performance requirements of the application.
For the early detection of pancreatic cancer, screening among the general population is not viable because the prevalence of the disease is too low to justify the cost. An alternative strategy is surveillance for incipient pancreatic cancer among a population with elevated risk. An elevated-risk condition that has gained attention in recent years is sudden-onset type 2 diabetes (23). In that group, the prevalence of pancreatic cancer may be as high as 0.8% (24). At such a prevalence, a biomarker with 96% specificity and 65% sensitivity would have a positive predictive value (PPV) of 11.6% and negative predictive value (NPV) of 99.7%, which could be acceptable in a cost–benefit analysis. Thus, the biomarker panel presented here is achieving the performance required for use in surveillance among elevated risk groups.
For differential diagnosis, the goal is to differentiate cancer from noncancer among people with a suspected abnormality of the pancreas, for example individuals with abnormal imaging of the pancreas in an initial evaluation. In the application of a blood test to such patients, those positive for the test could receive further workup or treatment, and those negative for the test could be spared unnecessary procedures, thus reducing cost, risk, and emotional burden to the patient. In this use of a blood test, high sensitivity is critical. The prevalence of pancreatic cancer among referral patients with abnormal imaging would vary greatly between centers, but it could be as high as 15% (the experience of the collaborators in this study). As such prevalence, a biomarker with 96% sensitivity and 50% specificity would have PPV = 25.3% and NPV = 98.6%, potentially high enough to find adoption.
Other serological biomarkers have shown promise for the diagnosis of pancreatic cancer and will be important for comparative studies. Many have been investigated (9–11), more than can be listed individually, but the following are some important examples. Plasma thrombospondin-2 was combined with CA19–9 to yield high specificity and sensitivity in multiple sample sets (25), and a drop in specific isoforms of apolipo-protein. AII strongly discriminated pancreatic cancer from healthy controls, although not from benign diseases, in a blinded study (26). Panels of biomarkers including metabolic markers (27) and protein indicators of a migratory signature (28) showed particularly encouraging results in recent studies. One of the most promising developments has been the detection of mutated, cell-free DNA in the circulation of cancer patients. The great majority of patients with pancreatic cancer harbor oncogenic mutations in the KRAS genes in their tumors. A PCR-based assay to detect such mutated DNA in the circulation identified about 30% of pancreatic cancer patients with near-perfect specificity relative to healthy controls, and the combination with CA19–9 and other markers could increase sensitivity to 64% at 99.5% specificity (29). The generalization of this strategy to include additional mutations showed promise for screening for 8 common cancer types, including pancreatic cancer (30). Further research will address specificity among benign conditions and performance in blinded studies. The performance of the panels in this study compares favorably with those cited above, and the precise, relative merits could be determined in comparison studies using common samples. Given that combining CA19–9 with the PCR-based assay improved sensitivity (29), it is reasonable that the addition of sTRA would further improve sensitivity.
This study has certain limitations. The samples were collected prior to knowledge of diagnosis, which is one of the PROBE design requirements (31), but they were not collected in prospective manner that mimicked clinical application. The training and validation sets included cases and controls all collected from the same location and same setting, but in the test set, some controls were collected at a separate site to include subjects with diabetes. For further validation, the sample size should be expanded; prospective sample collection at multiple sites should be used; and the measurements should be acquired using the clinical assay that would be used in practice (32).
The overall performance of the panels potentially could be improved through additional glycans in the Lewis blood group, of which CA19–9 is a member called sialyl-Lewis A (sLeA). Some pancreatic cancers have upregulated tumor expression of an isomer of sLeA called sialyl Lewis X (sLeX; ref. 33), which we (5, 6) and others (34) found elevated in the circulation of many patients with pancreatic cancer. Other patients elevate a glycan detected by the DUPAN-2 monoclonal antibody (35, 36), identified primarily as type 1 sialyl-LacNAc (37, 38). The elevation of CA19–9 in the blood potentially results from accumulations in the stroma followed by leakage into the capillaries or lymph (39, 40). Therefore, new leads potentially could be found by analyzing tumors with a non-glandular histopathology using glycan-discovery methods such as whole-tissue MALDI imaging (41).
This research establishes the sTRA glycan as a new biomarker for PDAC that improves diagnostic accuracy over CA19–9. This is the first biomarker, to our knowledge, to statistically-significantly improve upon CA19–9 in a double-blinded test with preset thresholds and classification rules. The applicability of the findings to future PDAC samples is supported by the similar breakdowns of distinct, complementary groups in each set and the similar improvements in performance between sets. Furthermore, the importance of sTRA was supported by its expression and secretion in pancreatic cancer models and primary tumors that do not produce CA19–9. The true value will become clearer over time, but at this point it appears the new biomarker identifies a distinct subset of PDACs. Based on the performance observed here, the biomarker panels could be valuable for surveillance among elevated-risk people or for the differential diagnosis of pancreatic cancer.
Supplementary Material
Translational Relevance.
Here we report a new biomarker for pancreatic cancer, called sTRA, which yields better performance than CA19–9, the current best biomarker for pancreatic cancer. sTRA is produced by pancreatic cancers that do not produce CA19–9. As a result, biomarker panels including sTRA gave improved specificity or sensitivity. In a rigorous, double-blinded study, the panels performed well enough to potentially warrant clinical use. One panel could be valuable for surveillance for incipient pancreatic cancer among people with elevated risk, and another panel could be valuable for differential diagnosis relative to benign pancreatic disease. Such biomarkers could lead to improved outcomes for many patients afflicted with pancreatic cancer.
Acknowledgments
We thank the VARI Confocal Microscopy and Quantitative Imaging core for assistance with fluorescence image acquisition on the tissue samples; and Luke Wisniewski at VARI for assistance preparing the cell cultures. NCI: U01 CA152653 (to B.B. Haab, R.E. Brand, Y. Huang); U01 CA200466 (to R.E. Brand); U01 CA200468 (to A. Maitra); U01 CA168896 (to B.B. Haab, R.E. Brand, Y. Huang); U01 CA196403 (to A. Maitra); P30 CA138313 (to R.R. Drake).
Footnotes
Note: Supplementary data for this article are available at Clinical Cancer Research Online (http://clincancerres.aacrjournals.org/).
Disclosure of Potential Conflicts of Interest
A.D. Singhi is a consultant/advisory board member for Foundation Medicine. No potential conflicts of interest were disclosed by the other authors.
References
- 1.Goonetilleke KS, Siriwardena AK. Systematic review of carbohydrate antigen (CA 19–9) as a biochemical marker in the diagnosis of pancreatic cancer. Eur J Surg Oncol 2007;33:266–70. [DOI] [PubMed] [Google Scholar]
- 2.Steinberg W. The clinical utility of the CA 19–9 tumor-associated antigen. Am J Gastroenterol 1990;85:350–5. [PubMed] [Google Scholar]
- 3.Malesci A, Montorsi M, Mariani A, Santambrogio R, Bonato C, Bissi O, et al. Clinical utility of the serum CA 19–9 test for diagnosing pancreatic carcinoma in symptomatic patients: a prospective study. Pancreas 1992;7: 497–502. [DOI] [PubMed] [Google Scholar]
- 4.Haab BB, Huang Y, Balasenthil S, Partyka K, Tang H, Anderson M, et al. Definitive characterization of CA 19–9 in resectable pancreatic cancer using a reference set of serum and plasma specimens. PLoS One 2015;10: e0139049. [DOI] [PMC free article] [PubMed] [Google Scholar]
- 5.Tang H, Singh S, Partyka K, Kletter D, Hsueh P, Yadav J, et al. Glycan motif profiling reveals plasma sialyl-Lewis X elevations in pancreatic cancers that are negative for CA 19–9. Mol Cell Proteomics 2015;14:1323–33. [DOI] [PMC free article] [PubMed] [Google Scholar]
- 6.Singh S, Pal K, Yadav J, Tang H, Partyka K, Kletter D, et al. Upregulation of glycans containing 3′ fucose in a subset of pancreatic cancers uncovered using fusion-tagged lectins. J Proteome Res 2015;14:2594–605. [DOI] [PMC free article] [PubMed] [Google Scholar]
- 7.Tang H, Partyka K, Hsueh P, Sinha JY, Kletter D, Zeh H, et al. Glycans related to the CA19–9 antigen are elevated in distinct subsets of pancreatic cancers and improve diagnostic accuracy over CA19–9. Cell Mol Gastroenterol Hepatol 2016;2:201–21e15. [DOI] [PMC free article] [PubMed] [Google Scholar]
- 8.Barnett D, Liu Y, Partyka K, Huang Y, Tang H, Hostetter G, et al. The CA19–9 and Sialyl-TRA antigens define separate subpopulations of pancreatic cancer cells. Sci Rep 2017;7:4020. [DOI] [PMC free article] [PubMed] [Google Scholar]
- 9.Lennon AM, Wolfgang CL, Canto MI, Klein AP, Herman JM, Goggins M, et al. The early detection of pancreatic cancer: what will it take to diagnose and treat curable pancreatic neoplasia? Cancer Res 2014;74:3381–9. [DOI] [PMC free article] [PubMed] [Google Scholar]
- 10.Kelly KA, Hollingsworth MA, Brand RE, Liu CH, Singh VK, Srivastava S, et al. Advances in biomedical imaging, bioengineering, and related technologies for the development of biomarkers of pancreatic disease: summary of a National Institute of Diabetes and Digestive and Kidney Diseases and National Institute of Biomedical Imaging and Bioengineering Workshop. Pancreas 2015;44:1185–94. [DOI] [PMC free article] [PubMed] [Google Scholar]
- 11.Young MR, Wagner PD, Ghosh S, Rinaudo JA, Baker SG, Zaret KS, et al. Validation of biomarkers for early detection of pancreatic cancer: summary of the alliance of pancreatic cancer consortia for biomarkers for early detection workshop. Pancreas 2018;47:135–41. [DOI] [PMC free article] [PubMed] [Google Scholar]
- 12.Chen S, LaRoche T, Hamelinck D, Bergsma D, Brenner D, Simeone D, et al. Multiplexed analysis of glycan variation on native proteins captured by antibody microarrays. Nat Methods 2007;4:437–44. [DOI] [PubMed] [Google Scholar]
- 13.Yue T, Goldstein IJ, Hollingsworth MA, Kaul K, Brand RE, Haab BB. The prevalence and nature of glycan alterations on specific proteins in pancreatic cancer patients revealed using antibody-lectin sandwich arrays. Mol Cell Proteomics 2009;8:1697–707. [DOI] [PMC free article] [PubMed] [Google Scholar]
- 14.Yue T, Maupin KA, Fallon B, Li L, Partyka K, Anderson MA, et al. Enhanced discrimination of malignant from benign pancreatic disease by measuring the CA 19–9 antigen on specific protein carriers. PLoS One 2011;6:e29180. [DOI] [PMC free article] [PubMed] [Google Scholar]
- 15.Efron B, Tibshirani RJ. An introduction to the bootstrap. Boca Raton, FL: CRC Press; 1994. [Google Scholar]
- 16.Herlyn M, Steplewski Z, Herlyn D, Koprowski H. Colorectal carcinoma-specific antigen: detection by means of monoclonal antibodies. Proc Natl Acad Sci 1979;76:1438–42. [DOI] [PMC free article] [PubMed] [Google Scholar]
- 17.Andrews PW, Banting G, Damjanov I, Arnaud D, Avner P. Three monoclonal antibodies defining distinct differentiation antigens associated with different high molecular weight polypeptides on the surface of human embryonal carcinoma cells. Hybridoma 1984;3:347–61. [DOI] [PubMed] [Google Scholar]
- 18.Natunen S, Satomaa T, Pitkanen V, Salo H, Mikkola M, Natunen J, et al. The binding specificity of the marker antibodies Tra-1–60 and Tra-1–81 reveals a novel pluripotency-associated type 1 lactosamine epitope. Glycobiology 2011;21:1125–30. [DOI] [PMC free article] [PubMed] [Google Scholar]
- 19.Magnani JL, Nilsson B, Brockhaus M, Zopf D, Steplewski Z, Koprowski H, et al. A monoclonal antibody-defined antigen associated with gastrointestinal cancer is a ganglioside containing sialylated lacto-N-fucopentaose II. J Biol Chem 1982;257:14365–9. [PubMed] [Google Scholar]
- 20.Magnani JL, Brockhaus M, Smith DF, Ginsburg V, Blaszczyk M, Mitchell KF, et al. A monosialoganglioside is a monoclonal antibody-defined antigen of colon carcinoma. Science 1981;212:55–6. [DOI] [PubMed] [Google Scholar]
- 21.Yue T, Partyka K, Maupin KA, Hurley M, Andrews P, Kaul K, et al. Identification of blood-protein carriers of the CA 19–9 antigen and characterization of prevalence in pancreatic diseases. Proteomics 2011;11: 3665–74. [DOI] [PMC free article] [PubMed] [Google Scholar]
- 22.Fallon BP, Curnutte B, Maupin KA, Partyka K, Choi S, Brand RE, et al. The Marker State Space (MSS) method for classifying clinical samples. PLoS One 2013;8:e65905. [DOI] [PMC free article] [PubMed] [Google Scholar]
- 23.Sah RP, Nagpal SJ, Mukhopadhyay D, Chari ST. New insights into pancreatic cancer-induced paraneoplastic diabetes. Nat Rev Gastroenterol Hepatol 2013;10:423–33. [DOI] [PMC free article] [PubMed] [Google Scholar]
- 24.Chari ST, Leibson CL, Rabe KG, Ransom J, de Andrade M, Petersen GM. Probability of pancreatic cancer following diabetes: a population-based study. Gastroenterology 2005;129:504–11. [DOI] [PMC free article] [PubMed] [Google Scholar]
- 25.Kim J, Bamlet WR, Oberg AL, Chaffee KG, Donahue G, Cao XJ, et al. Detection of early pancreatic ductal adenocarcinoma with thrombospondin-2 and CA19–9 blood markers. Sci Transl Med 2017;9:eaah5583. [DOI] [PMC free article] [PubMed] [Google Scholar]
- 26.Honda K, Kobayashi M, Okusaka T, Rinaudo JA, Huang Y, Marsh T, et al. Plasma biomarker for detection of early stage pancreatic cancer and risk factors for pancreatic malignancy using antibodies for apolipoprotein-AII isoforms. Sci Rep 2015;5:15921. [DOI] [PMC free article] [PubMed] [Google Scholar]
- 27.Capello M, Bantis LE, Scelo G, Zhao Y, Li P, Dhillon DS, et al. Sequential validation of blood-based protein biomarker candidates for early-stage pancreatic cancer. J Natl Cancer Inst 2017;109:djw266. [DOI] [PMC free article] [PubMed] [Google Scholar]
- 28.Balasenthil S, Huang Y, Liu S, Marsh T, Chen J, Stass SA, et al. A plasma biomarker panel to identify surgically resectable early-stage pancreatic cancer. J Natl Cancer Inst 2017;109:djw341. [DOI] [PMC free article] [PubMed] [Google Scholar]
- 29.Cohen JD, Javed AA, Thoburn C, Wong F, Tie J, Gibbs P, et al. Combined circulating tumor DNA and protein biomarker-based liquid biopsy for the earlier detection of pancreatic cancers. Proc Natl Acad Sci U S A 2017;114: 10202–07. [DOI] [PMC free article] [PubMed] [Google Scholar]
- 30.Cohen JD, Li L, Wang Y, Thoburn C, Afsari B, Danilova L, et al. Detection and localization of surgically resectable cancers with a multi-analyte blood test. Science 2018;359:926–30. [DOI] [PMC free article] [PubMed] [Google Scholar]
- 31.Pepe MS, Feng Z, Janes H, Bossuyt PM, Potter JD. Pivotal evaluation of the accuracy of a biomarker used for classification or prediction: standards for study design. J Natl Cancer Inst 2008;100:1432–8. [DOI] [PMC free article] [PubMed] [Google Scholar]
- 32.Sullivan Pepe M, Etzioni R, Feng Z, Potter JD, Thompson ML, Thornquist M, et al. Phases of biomarker development for early detection of cancer. J Natl Cancer Inst 2001;93:1054–61. [DOI] [PubMed] [Google Scholar]
- 33.Pour PM, Tempero MM, Takasaki H, Uchida E, Takiyama Y, Burnett DA, et al. Expression of blood group-related antigens ABH, Lewis A, Lewis B, Lewis X, Lewis Y, and CA 19–9 in pancreatic cancer cells in comparison with the patient’s blood group type. Cancer Res 1988;48:5422–6. [PubMed] [Google Scholar]
- 34.Balmana M, Sarrats A, Llop E, Barrabes S, Saldova R, Ferri MJ, et al. Identification of potential pancreatic cancer serum markers: increased sialyl-Lewis X on ceruloplasmin. Clin Chim Acta 2015;442C:56–62. [DOI] [PubMed] [Google Scholar]
- 35.Metzgar RS, Gaillard MT, Levine SJ, Tuck FL, Bossen EH, Borowitz MJ. Antigens of human pancreatic adenocarcinoma cells defined by murine monoclonal antibodies. Cancer Res 1982;42:601–8. [PubMed] [Google Scholar]
- 36.Kawa S, Tokoo M, Oguchi H, Furuta S, Homma T, Hasegawa Y, et al. Epitope analysis of SPan-1 and DUPAN-2 using synthesized glycoconju-gates sialyllact-N-fucopentaose II and sialyllact-N-tetraose. Pancreas 1994; 9:692–7. [DOI] [PubMed] [Google Scholar]
- 37.Takasaki H, Uchida E, Tempero MA, Burnett DA, Metzgar RS, Pour PM. Correlative study on expression of CA 19–9 and DU-PAN-2 in tumor tissue and in serum of pancreatic cancer patients. Cancer Res 1988;48:1435–8. [PubMed] [Google Scholar]
- 38.Partyka K, Maupin KA, Brand RE, Haab BB. Diverse monoclonal antibodies against the CA 19–9 antigen show variation in binding specificity with consequences for clinical interpretation. Proteomics 2012;12:2212–20. [DOI] [PMC free article] [PubMed] [Google Scholar]
- 39.Haglund C, Lindgren J, Roberts PJ, Nordling S. Gastrointestinal cancer-associated antigen CA 19–9 in histological specimens of pancreatic tumours and pancreatitis. Br J Cancer 1986;53:189–95. [DOI] [PMC free article] [PubMed] [Google Scholar]
- 40.Kalthoff H, Kreiker C, Schmiegel WH, Greten H, Thiele HG. Characterization of CA 19–9 bearing mucins as physiological exocrine pancreatic secretion products. Cancer Res 1986;46:3605–7. [PubMed] [Google Scholar]
- 41.Powers TW, Jones EE, Betesh LR, Romano PR, Gao P, Copland JA, et al. Matrix assisted laser desorption ionization imaging mass spectrometry workflow for spatial profiling analysis of N-linked glycan expression in tissues. Anal Chem 2013;85:9799–806. [DOI] [PMC free article] [PubMed] [Google Scholar]
Associated Data
This section collects any data citations, data availability statements, or supplementary materials included in this article.