

Abstract
Background:
Cannabinoids may potentiate opioid analgesia and therefore could be used to reduce reliance on opioids for analgesia.
Aims:
The current study evaluated whether the concurrent availability of cannabis influences opioid consumption using a behavioral economic demand framework.
Methods:
An online survey assessed cannabis and opioid use frequency and dependence measures, pain severity, and demand for both cannabis and opioids alone and when concurrently available using hypothetical purchase tasks. Adults reporting current use of opioids for pain management and past 30-day cannabis exposure (N=155) completed two hypothetical purchase tasks in which only grams of cannabis or units of participants’ index opioids were available for purchase, and two hypothetical tasks in which both were concurrently available and the price of one drug increased whereas the other was kept constant. Paired-sample t-tests compared the demand of each drug alone with when it was available concurrently with an alternative.
Results:
Demand intensity was significantly reduced and demand elasticity was significantly increased for both cannabis and opioids when the alternate commodity was available, although the reductions in cannabis consumption were more pronounced than they were for opioid consumption in the presence of the alternate commodity.
Conclusions:
These data provide behavioral economic evidence that cannabis access may modestly reduce demand for opioids in persons who have pain. Additional clinical studies that evaluate the analgesic effects of cannabis and cannabis-opioid effects on pain are warranted.
Keywords: Opioids, cannabis, pain, demand, behavioral economics
Introduction
Rates of opioid use disorder (OUD) and opioid overdose deaths have reached unprecedented levels, engendering substantial societal and economic burden (Reinhart et al., 2018). Therapeutically, opioids are potent analgesics used to treat pain. However, misuse of prescription opioids, especially at high doses, contributes to opioid-related morbidity and mortality (Bohnert et al., 2011; Dunn et al., 2010; Gomes et al., 2011). Recent efforts aim to decrease the amount of opioids necessary to produce sufficient analgesia (opioid-sparing), to reduce opioid-related morbidity and mortality while preserving opioid therapeutic value.
Substantial preclinical evidence suggests cannabinoid and opioid co-administration increases opioid analgesic potency, allowing for lower doses of opioids while maintaining analgesic efficacy (Cichewicz, 2004; Finn et al., 2004; Nguyen et al., 2019; Nielsen et al., 2017; Williams et al., 2006). Although the independent analgesic properties of opioids and cannabis have been investigated, studies examining how they may interact to influence analgesia at the clinical level are still ongoing and definitive data are not yet available (Aviram and Samuelly-Leichtag, 2017; Lynch and Ware, 2015). In lieu of clinical studies, cannabis and opioid co-use has been assessed by epidemiological and convenience-sample survey research (Bachhuber et al., 2014; Corroon et al., 2017; Lucas, 2017; Lucas et al., 2016; Reiman et al., 2017; Rogers et al., 2017). One notable time-series analysis reported states that legalized medical cannabis experienced lower annual rates of opioid analgesic overdose deaths compared to states that maintained barriers to cannabis (Bachhuber et al., 2014). However, although these data provide a valuable signal, this effect is not reliably replicated and evidence suggests it may be more related to differences in state-level healthcare policies than inherent relationships between opioids and cannabinoids (for a review see Campbell et al., 2018). In other survey-based studies, 30–72% of cannabis users qualitatively reported ‘substituting’ cannabis for opioids (Corroon et al., 2017; Lucas, 2017). Although these data provide evidence that naturalistic substitution of cannabis for opioids may occur, such observational data have limitations and are not optimal for assessing how the availability of one drug impacts the other.
This study utilized behavioral economic demand analyses to rigorously assess the potential opioid-sparing effects of cannabinoids in persons with pain. Behavioral economic demand analyses are multi-faceted, validated methods of evaluating drug reinforcement and characterizing how the availability of specific commodities influence the valuation of others (Bergeria et al., 2019; Johnson and Bickel, 2006; MacKillop et al., 2019).
Hypothetical purchase tasks (PTs) query how many units of a given commodity an individual would purchase at adjusting price points and generate curves that portray the demand intensity and elasticity of the assessed commodity. Demand intensity corresponds to the quantity of a commodity consumed at the lowest price approaching zero and elasticity refers to the influence of adjusting prices on commodity consumption (i.e., consumption that does not change appreciably with increases in price are considered less elastic). Individuals demonstrating greater intensity or lesser elasticity are conceptualized as having greater demand for the commodity in question. These tasks can also evaluate how the simultaneous availability of one or more alternative commodities changes the expected consumption patterns of other commodities. Specifically, cross-price elasticity characterizes how one product is used when another concurrently available good is available at a higher cost.
Behavioral demand analyses are frequently used to inform regulatory decisions and have addressed public health concerns related to tobacco product co-use (Grace et al., 2015; Johnson et al., 2017; Tucker et al., 2018) but have not yet been applied to assess opioid and cannabis co-use. This framework also models the degree to which restriction or prohibition of one medication may impact the consumption of others. For instance, medications that are consumed at greater quantities as prices for the alternative medication increases are considered substitute commodities, whereas medications that are consumed to a lesser degree as the price of the alternative increases are complementary commodities. Medications that are consumed at a constant rate, regardless of the price of the alternative medication, are considered independent commodities. Within that framework, behavioral economic assessments model whether the restriction of opioids could produce increases in cannabis demand.
Previous studies have used behavioral economic tasks to assess the demand for opioids and cannabis separately (Strickland et al., 2017, 2019); however, their co-use and cross-price elasticity have not yet been examined. Assessing the behavioral demand of cannabis and opioids will help inform the degree to which cannabis access may impact both opioid and cannabis use for pain management. This is important because of two current major initiatives that are expected to directly impact national cannabis and opioid availability; the first is state-level approval of cannabis for OUD treatment and the second is the new federal and state-level restrictions being imposed on opioid prescribing for pain management. Both initiatives are rapid responses to the current opioid crisis that should be subject to further empirical testing. Given this context, the aims of this study were to evaluate (a) whether the availability of cannabis or opioids might influence the consumption of the alternative and (b) how the consumption of cannabis or opioids changes when the alternative is under restriction in persons currently prescribed opioids for pain management.
Method
Recruitment
Participants were recruited between November 2018 and January 2019 from the crowdsourcing website Amazon Mechanical Turk (AMT). AMT provides a method for recruiting difficult-to-reach populations and has been shown to produce data that are consistent with results from field and laboratory experiments, especially data from behavioral economic demand analyses and hypothetical PTs (Chandler and Shapiro, 2016; Johnson et al., 2017; Strickland et al., 2019; Walters et al., 2018).
This study was open to workers with a ⩾80% approval rate from completion of previous AMT assignments (independent of the previous number of HITS completed) who resided in the United States. Participants completed a brief eligibility survey to establish appropriateness for the study before proceeding into the primary study. The description of the study was purposefully left vague to prevent falsification of screening question responses to meet inclusion criteria. Only one survey completion was allowed per IP address to prevent multiple survey completions to meet eligibility requirements. Participants were compensated US$0.10 for completing the eligibility survey and those who met eligibility criteria were offered the opportunity to complete a series of questionnaires related to their pain and drug use. Participants could earn US$4 for completing the surveys and an additional US$2 for correctly responding to embedded attention checks and for providing consistent responses. The Johns Hopkins University Institutional Review Board reviewed this study and categorized it as not human subject research.
Participants were eligible to complete the survey if they endorsed (a) experiencing acute (<3 months) or chronic (⩾3 months) pain, (b) past 30-day use of opioids that was prescribed to them for pain management, (c) past 30-day use of smoked cannabis, and (d) being at least 18 years old.
Procedures and measures
Eligible participants completed a demographic survey, questionnaires related to pain, medication and illicit drug use history, and a series of behavioral economic hypothetical PTs.
Brief Pain Inventory.
The Brief Pain Inventory is a 15-item, self-report questionnaire that generates composite scales for two pain-related factors, Pain Severity and Pain Interference (Poquet and Lin, 2016). Pain Severity scores are computed by averaging the severity of participants’ worst, least, average, and current pain on a scale from 0 (no pain) to 10 (pain as bad as you can imagine). Pain Interference scores are computed by averaging the extent to which pain interferes with nine different activities (e.g., general activity, mood, walking ability) rated on a scale from 0 (does not interfere) to 10 (completely interferes). Questions also query how long the participant experienced pain (i.e., pain longer than 3 months? (y/n), how many days in the last 30 did the participant experience pain?). Acute and chronic pain were categorized as pain lasting <3 and ⩾3 months, respectively.
Index opioid assessment.
At screening, participants indicated whether they had used any prescription opioids as prescribed or outside of their prescription during the past 30 days. Participants were presented with a list of numerous different licit and illicit opioids and allowed to select as many of the opioid options as applicable (an “other” option was presented for those whose drugs were unlisted). Eligible participants completed follow-up questions to identify their “index opioid,” defined as the opioid they reported using the most frequently, in the form and dose they typically used to manage their pain. Participants were asked which of the endorsed opioids they used the majority of the time to treat their pain, the method by which it was generally consumed (e.g., tablet, sublingual film), the typical dose (if known), and the duration of time they had been using that drug/medication for pain.
Opioid/cannabis dependence questionnaires.
OUD and cannabis use disorder symptoms were quantified as the number of self-reported symptoms endorsed on separate Diagnostic and Statistical Manual of Mental Disorders 5th edition checklists for each substance (range 0–11). Participants were also asked to provide the number of days in the past 30 that they used both opioids (prescribed and illicit) or cannabis.
Hypothetical PTs.
Participants completed two single-item and two cross-commodity PTs for grams of cannabis and their “index” opioid. Each PT asked participants to imagine a typical day in which they were experiencing pain and needed medicine to treat their pain, and to assume they (a) had not consumed any alcohol or other illicit drugs/medicines, (b) had their current income and savings available for use, (c) would consume all medications purchased within 24 hours of purchasing, (d) could not save or stockpile medications, and (e) did not have access to other medications aside from the ones purchased in the task. These directions are consistent with those given in previous research with hypothetical PTs (Higgins et al., 2017; Johnson et al., 2017; Strickland et al., 2019). These drug units were based on previous PT studies that evaluated cannabis and prescription drug use (Amlung et al., 2019; Pickover et al., 2016). Participants were allowed to enter quantities with up to 2 decimal places.
After reviewing the PT instructions, participants were required to answer comprehension questions (with feedback provided) to confirm they understood: (a) drugs purchased must be used within a single day, (b) drugs could not be stockpiled, (c) they were making purchases based on their current savings/income, and (d) the drugs were purchased for the purpose of treating pain. Participants had to select the correct answers to begin the task.
After successfully answering comprehension questions, participants entered how much of each drug they would purchase at the following prices: US$0.01, US$0.03, US$0.10, US$0.30, US$1, US$3, US$10, US$30, US$100, US$300, and US$1000. In the single-item tasks, only one drug (either cannabis or the index opioid) was hypothetically available for purchase at the escalating prices. In the cross-commodity tasks or concurrent choice paradigms, both drugs were available. In one cross-commodity task, the index opioid was available at escalating prices and cannabis was available at a fixed price of US$10 per gram. In the opposite task, the price of cannabis increased as the index opioid was fixed at US$1 per unit.
Statistical method
Preparation of PT data.
Group data (across all participants) from hypothetical PTs were described as the median number of units purchased at each price up to the price point at which the median consumption reached zero. These data were plotted on log-log axes as a function of price of the adjusting-price commodity. To allow for logarithmic transformation, the first instance of zero consumption was changed to an arbitrary nonzero value of 0.1 and subsequent zeroes were not evaluated (Aston et al., 2015; Johnson et al., 2017; MacKillop et al., 2019; Peters et al., 2017). The data were then fitted to a demand curve (Hursh and Silberberg, 2008).
| (1) |
In Equation 1, Q refers to consumption at price C, k represents the range of consumption across prices, Q0 represents demand intensity (consumption at the lowest price), and α is an elasticity-related rate constant describing the change in consumption as a function of price. The value of k was the range of all log-transformed possible consumption values, and was calculated as the difference between the log-transformed maximum observed and the transformed minimum consumption value. For all applications of Equation 1, k was set to 2.8, reflecting the range of consumption reported by participants across the prices. The number of units purchased at US$0.01/unit was imputed as Q0 instead of the parameter derived from Equation 1. At the group level, values for Q0 and α were highly skewed so were square-root and log transformed, respectively, for subsequent parametric analyses.
This process was replicated to characterize demand for individual-level data.
In the cross-commodity task, 0 consumption of the fixed-price commodity was transformed to 0.1 to allow for log transformation; however, all zero values were used for calculation of cross-price elasticity of the fixed-item commodity. Cross-price elasticity was determined at the individual level by calculating the slope of the log-transformed consumption of the fixed-price commodity as a function of the log-transformed price of the adjusting-price commodity.
Consistent with previous research, we selected an a priori cutoff for unrealistic consumption patterns (Johnson et al., 2017). PT datasets in which consumption exceeded 20 units/day at any price point were operationalized as being unrealistic for consumption in a single day and potentially representative of a misunderstanding of task instructions, and were subsequently excluded from further analysis. Orderliness of individual demand curves was determined using established criteria for eliminating nonsystematic data from PTs (Bruner and Johnson, 2014; Stein et al., 2015). Purchasing was identified as nonsystematic if (a) units purchased at a given price were at least 20% greater than at the preceding price, (b) units purchased at the final price were not less than the first price by at least 10%, or (c) units purchased were greater than zero after zero consumption was reported at a lower price. Datasets violating these criteria were not included in the final analysis; however, datasets only violating criterion 2 were still included in analyses of demand intensity, given that they are still generally orderly, unlike those violating criteria 1 and 3. Datasets with 0 or unchanging consumption across prices still provide valuable information regarding consumption, but nonlinear curves cannot be fit to these data for analysis of elasticity.
The characteristics of participants whose data were and were not excluded based on these criteria were compared using independent t-tests (continuous variables) and chi-squared tests (categorical variables).
Classifying fixed-price commodities as complements, independents or substitutes.
In GraphPad Prism (version 8, GraphPad software, La Jolla, CA), F tests determined whether fixed-price slopes significantly differed from zero. Slopes of fixed-price lines that were significantly different from zero and negatively sloped were designated as complements, lines that were not significantly different from zero were designated as independents, and lines that were significantly different from zero and positively sloped were designated as substitutes. Each individual was categorized as treating fixed-price cannabis and opioids as a (a) complement, (b) independent, and/or (c) substitute.
Comparing and characterizing demand indices.
Group-level Q0 and α values were analyzed using separate paired-samples t-tests to compare differences between demand for the adjusting-price commodities when available alone or with a concurrently available medication. Significant differences in α for the opioid PTs were further characterized with matched-pairs t-tests and Cohen’s d effect sizes at individual price points. Given the exploratory nature of these analyses, we report the results of these matched-pairs t-tests with both unadjusted and Bonferroni-corrected p values.
Linear regressions were used to assess substitutability of cannabis for opioids and vice-versa at the group level, with F tests to determine if either slope significantly differed from zero.
Correlates of PT indices.
Pearson correlation coefficients and independent t-tests were used to assess the relationships between individual-level transformed Q0 and α values and pain and drug use variables. Individual-level Q0 values from the opioid/cannabis + fixed-price alternative task were subtracted from the Q0 values of the opioid/cannabis alone task to compute a change score that characterized the impact of a fixed-price alternative on Q0. Individual-level α values from the opioid/cannabis alone task were divided by the α values from the opioid/cannabis + fixed-price alternative task to compute a fold-change that characterized the impact of a fixed-price alternative on α. Linear regressions were computed to assess the relationship between the PT parameter change scores and pain and drug use variables while controlling for baseline PT parameters (without alternative drugs available). Finally, Pearson correlation coefficients were used to characterize the relationship between the slope of the fixed-price alternative and measures of pain and drug use.
Pain and drug use variables were compared across groups who treated the drugs/medicine as substitutes, complements or independents using a one-way analysis of variance for continuous variables and chi-squared tests for categorical variables.
Results
Participant characteristics
Participant (N = 155) characteristics are presented in Table 1. A total of 930 datasets were collected (six tasks, 155 participants).
Table 1.
Participant demographics, drug use and pain characteristics.
| Demographics | All participants (N = 155) | Participants who were excluded from at least one task (N = 58) |
|---|---|---|
| Sex (% male) | 53 | 57 |
| Age (years, mean ± SD) | 33.1 ± 8.6 | 33.6 ± 7.8 |
| Education (% with high school diploma) | 32 | 34 |
| Employment (% employed full time) | 69 | 62 |
|
Pain characteristics Chronic pain (pain for past 3 months, %) |
94 | 91 |
| Pain in last 30 days (days, mean ± SD) | 19.5 ± 8.2 | 19.6 ± 8.3 |
| Brief Pain Index: Severity scale (range: 0–10; mean ± SD) | 4.3 ± 1.6 | 4.3 ± 1.5 |
| Brief Pain Index: Interference scale (range: 0–10; mean ± SD) | 4.8 ± 2.2 | 4.9 ± 2.1 |
|
Drug use characteristics % reporting non-prescribed opioid use |
39 | 39 |
| Opioid use disorder symptoms (range: 0–11; mean ± SD) | 3.3 ± 3.3 | 4.0 ± 3.5 |
| Cannabis use disorder symptoms (range: 0–11; mean ± SD) | 2.3 ± 2.7 | 3.3 ± 3.3 |
| Drug/medicine use in last 30 days (days ± SD) | ||
| Cannabis | 15.8 ± 9.9 | 16.6 ± 10.3 |
| Index opioid | 17.5 ± 9.4 | 15.1 ± 9.8 |
Between-group comparisons conducted using independent groups t-tests (continuous) or chi-square (categorical) analyses; no significant differences were observed. SD: standard deviation.
Data quality control.
Datasets (n = 236, 25%) that were identified as exceeding the outlier criterion or violating the data orderliness criteria were not included in the final analyses. In total, 103 sets of PT responses were eliminated because >20 units of cannabis/opioids were entered, 83 sets of PT responses were eliminated because there was no change in consumption across escalating price points, 20 sets of PT responses were eliminated because there was an increase in consumption across escalating price points, and 29 sets of PT responses were eliminated because a participant indicated 0 consumption at one price point but indicated greater consumption at higher price points.
Participants with excluded datasets did not differ from participants that had all datasets included (Table 1).
Opioid demand.
Demand Intensity was significantly lower for opioids with concurrently available cannabis relative to opioids alone, t(78) = 2.68, p = .009, d = 0.15 (Figures 1 and 2). Similarly, the elasticity of opioids with concurrently available cannabis was significantly greater (i.e., more sensitive to price) than elasticity for opioids alone, t(72) = 2.992, p = .004), d = 0.19 (Figures 1 and 2). Unadjusted post-hoc matched-pairs t-tests showed differences in opioid consumption significantly differed at the US$0.01-, US$1-, US$3-, US$10-, US$30-, and US$100-unit price points (Table 2), such that opioid consumption was significantly greater at all price points when cannabis was unavailable compared to when cannabis was available. Bonferroni-corrected post-hoc tests indicated differences in opioid consumption at the US$30-unit price point, p < .005. There was a moderate effect of cannabis availability on opioid consumption at the higher price points, (d = .23–.35). Overall, opioid demand for pain management decreased when cannabis was made available.
Figure 1.
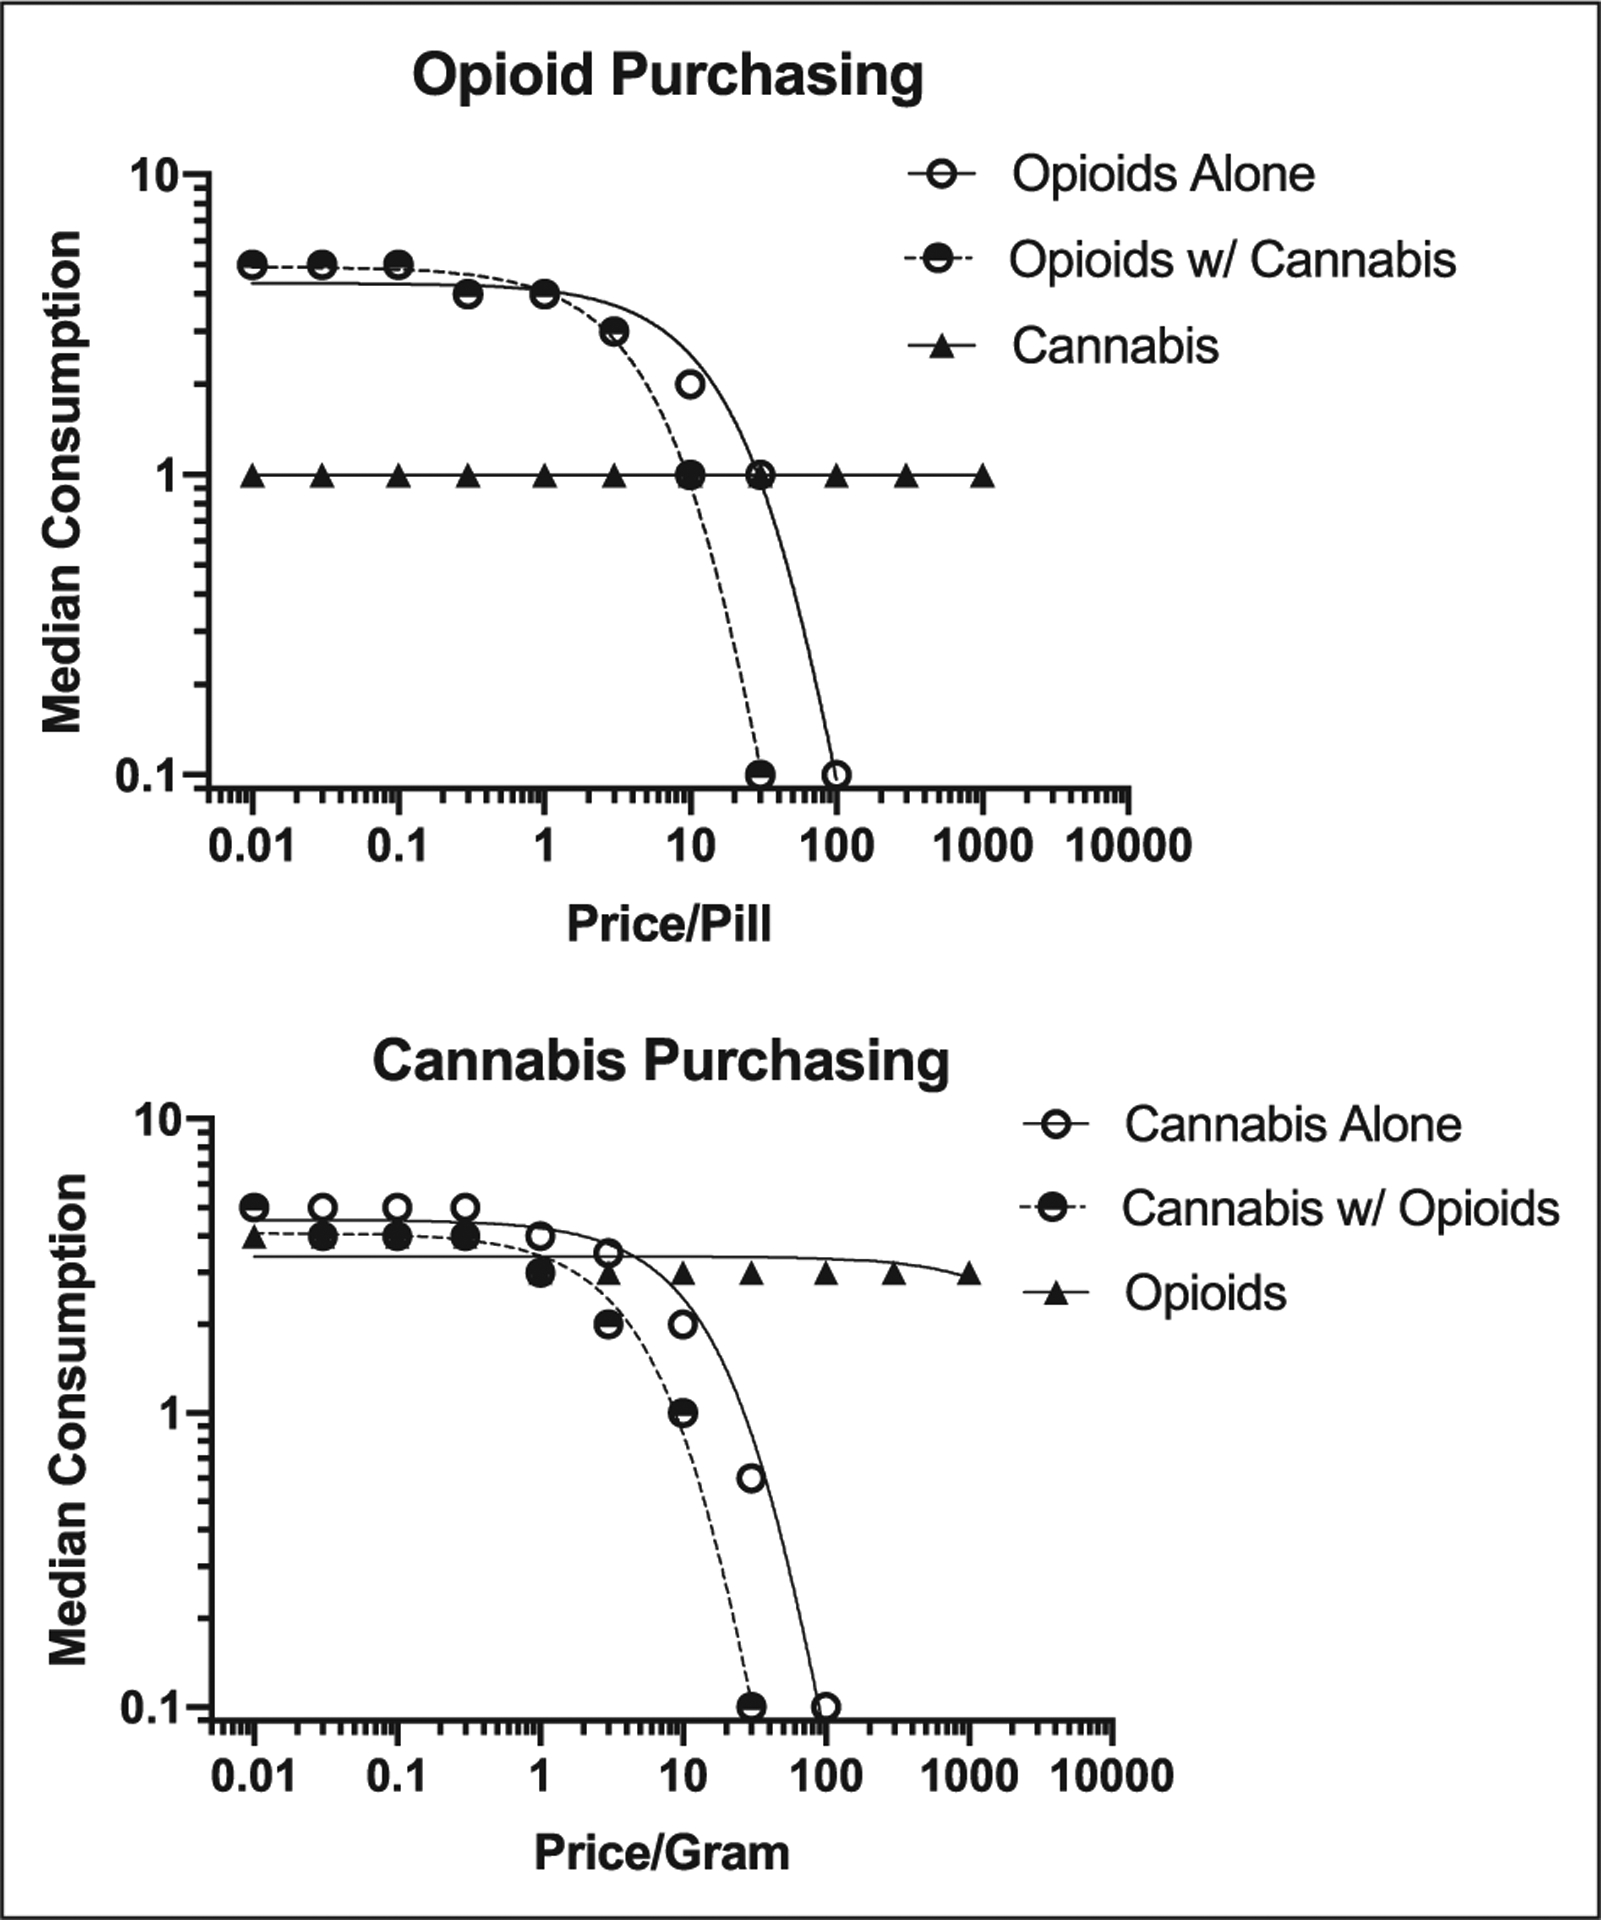
Demand curves demonstrating median consumption for single-item opioids, adjusting-price opioids, and fixed-price cannabis (top panel) and for single-item cannabis, adjusting-price cannabis, and fixed-price index opioids (bottom panel).
Figure 2.

Mean (+SEM) square-root transformed demand intensity (left) and log-transformed demand elasticity (right) single-item and cross-commodity purchase tasks. *p < .05 relative to single item.
Table 2.
Self-reported non-transformed opioid consumption (mean ± standard deviation) at each price point with and without cannabis available.
| Opioid consumption alone | Opioid consumption, cannabis available | Effect size Cohen’s d | ||
|---|---|---|---|---|
| Price Points | US$0.01* | 6.2 ± 4.7 | 5.8 ± 4.2 | .15 |
| US$0.03 | 5.5 ± 4.1 | 5.3 ± 3.5 | - | |
| US$0.10 | 5.3 ± 3.5 | 5.1 ± 3.3 | - | |
| US$0.30 | 5.1 ± 3.5 | 4.7 ± 3.2 | - | |
| US$1* | 4.7 ± 3.2 | 4.0 ± 2.9 | .33 | |
| US$3* | 3.7 ± 3.1 | 3.1 ± 2.4 | .32 | |
| US$10* | 2.4 ± 2.6 | 2.0 ± 2.3 | .23 | |
| US$30*# | 1.5 ± 2.4 | 0.9 ± 1.5 | .35 | |
| US$100* | 0.8 ± 1.2 | 0.4 ± 0.8 | .23 | |
| US$300 | 0.4 ± 0.8 | 0.3 ± 0.6 | - | |
| US$1000 | 0.2 ± 0.4 | 0.2 ± 0.4 | - |
Price points with an asterisk (*) and bolded data indicate there was a significant effect at p < .05 and a hash (#) indicates there was a significant effect at Bonferroni corrected p < .005 of cannabis availability on opioid consumption when transformed data were analyzed, Cohen’s d characterizes the effect size of the matched-pairs t-test at each individual price point.
Cannabis demand.
There was a significant reduction in demand intensity for cannabis with concurrently-available opioids relative to cannabis alone, t(78)= 3.706, p < .001, d = 0.31, and elasticity of cannabis with concurrently-available opioids was significantly greater than for cannabis alone, t(70) = 4.445, p < .001, d = 0.35. These data suggest that hypothetical cannabis use for pain decreased when opioids were made available.
Cross-price elasticity.
Cross-price elasticity is evaluated using the fixed-price commodity data from the concurrent choice task. At the group level, cross price elasticity slopes were significantly less than 0 for both cannabis (slope = −0.076, F(1,1208) = 38.25, p < .001) and opioids (slope = −0.050, F(1,1153) = 13.60, p < .001) (Figure 1), suggesting that cannabis use decreases when opioid use is constrained and opioid use decreases when cannabis use is constrained.
Correlates of demand.
Pearson r values across correlations between demand indices and pain and substance use history are provided in Table 3.
Table 3.
Correlation coefficients for the relationship between indices of demand and measures of pain and drug use disorder.
| Opioid demand | Cannabis demand | |||||||
|---|---|---|---|---|---|---|---|---|
| Q0 | α | Q0 | α | |||||
| Alone | Cannabis US$10 | Alone | Cannabis US$10 | Alone | Opioid US$1 | Alone | Opioid US$1 | |
| Brief Pain Index: Severity scale (range: 0–10) | .22* | ns | −.29** | ns | ns | .27** | ns | ns |
| Brief Pain Index: Interference scale (range: 0–10) | .23* | ns | ns | ns | ns | ns | ns | ns |
| Number of days experienced pain in last 30 | −.23* | −.29** | ns | ns | ns | −.21* | ns | ns |
| Opioid use disorder symptoms (range: 0–11) | .31** | .28** | −.26* | ns | ns | ns | ns | ns |
| Cannabis use disorder symptoms (range: 0–11) | .28** | ns | −.23* | ns | ns | .28** | ns | −.22* |
| Number of days of opioid use in last 30 | ns | ns | ns | ns | ns | ns | ns | ns |
| Number of days of cannabis use in last 30 | ns | ns | ns | ns | ns | ns | ns | ns |
p < .05.
p < .01.
ns: nonsignificant; Q0: demand intensity; α: demand elasticity.
Controlling for cannabis elasticity at baseline (opioids unavailable), a multiple linear regression revealed changes in elasticity were significantly related to past 30-day cannabis use, F(2,88) = 4.29, p = .02, β = −.34. Change scores in cannabis or opioid Q0 or α was not related to any other pain or drug use variable.
Factors related to fixed-price designation.
In total, 36% of participants treated cannabis as an opioid complement, 36% treated cannabis as an independent commodity, and 28% treated cannabis as an opioid substitute. Those who used cannabis to complement opioids used opioids less often in the past 30 days than those who treated cannabis as an independent or substitute to opioids, F(2, 109)= 5.5, p < .001 (Figure 3). Correspondingly, the fixed-price cannabis slope was significantly and positively correlated with past 30-day opioid use, r = .27, p < .01 and days with pain in the past 30 days, r = .21, p < .05. Therefore, increasing cannabis use in the absence of opioids is associated with greater past 30-day frequency of pain and usage of opioids.
Figure 3.

Days of opioid use and days of pain (M ± SEM) among those who treated cannabis as a complement, independent or substitute. Data points with letters in common are not statistically different at p < .05.
In total, 36% of participants treated opioids as a cannabis complement, 48% treated opioids as an independent commodity, and 22% treated opioids as a cannabis substitute. Those who treated opioids as a complement to cannabis used opioids less often in the past 30-days compared to those that treated opioid as an independent commodity or substitute to cannabis, F(2, 102) = 6.56, p < .001 (Figure 4). Individuals who treated opioids as complements to cannabis also had significantly fewer days with pain in the past 30 days compared to those that treated opioids as an independent or a substitute, F(2, 102)= 4.26, p < .05. No other outcomes differed across the cross-price category. Similarly, the fixed-price opioid slope was significantly and positively correlated with past 30-day opioid use, r = .21, p < .05, and days of pain in the last 30-days, r = .19, p < .05. Fixed-price opioid slope did not correlate with any other outcomes.
Figure 4.

Days of opioid use and days of pain (M ± SEM) among those who treated opioids as a complement, independent or substitute. Data points with letters in common are not statistically different at p < .05.
Overall, 15% of the sample treated opioids and cannabis as complements. Among those who treated at least one (opioid or cannabis) as a complement, 40% treated the other also as a complement and 60% treated the other as either a substitute or an independent.
Discussion
In line with previous laboratory-based reports (Cooper et al., 2018; Nguyen et al., 2019), our demand analyses suggests the availability of cannabis decreased opioid consumption (intensity) and increased the degree to which opioid consumption was influenced by opioid price (elasticity). These results suggest cannabis may confer an opioid-sparing effect in this population. Notably, the availability of cannabis produced the largest decrease in opioid demand when the cost for opioids was high (Table 2). Results also suggest that, with regard to pain treatment, opioid availability was more likely to decrease the demand for cannabis than was cannabis to decrease the demand for opioids. This may reflect the more efficacious analgesic effects of opioids relative to cannabis, or a relatively limited history of these participants in using cannabis for primary pain management.
Interestingly, changes in opioid demand when cannabis was or was not available were not sensitive to many characteristics that were expected to influence and/or inform medication preference, such as past 30-day analgesia use, opioid or cannabis use disorder severity, or pain severity or interference. These outcomes suggest cannabis availability decreased patient anticipated use of opioids to the same small degree, regardless of patient-level pain or drug use disorder severity.
Consistent with previous reports, participants who endorsed being in more pain utilized opioids and cannabis more frequently and those endorsing symptoms of OUD were more likely to report greater demand for opioids when it was the only medicine available (Pickover et al., 2016; Strickland et al., 2019).
Recent epidemiological research suggests cannabis may act as a “substitute” for opioids to treat pain (Boehnke et al., 2019; Corroon et al., 2017; Lucas et al., 2016). The current demand analyses suggest that, on average, study respondents were more likely to treat cannabis as a complement (i.e., use together) rather than substitute for opioids (i.e., cannabis supplanting opioids). However, at the individual level, somewhat equal proportions treated cannabis as a complement (30%), independent (47%), and substitute (23%). A similar trend emerged with fixed-price opioids, such that on average, opioids were treated as a complement to cannabis, although the proportion of individuals who treated opioids as complements (36%), independents (36%), and substitutes (28%) were roughly equivalent. Individuals who treated cannabis as an independent or substitute commodity used opioids more frequently and experienced pain more frequently than did persons who treated cannabis as an opioid complement. These data suggest the likelihood that cannabis use will persist or increase in the absence of opioids is influenced by an individual’s opioid use history and pain history.
The prevalence of individuals substituting cannabis for opioids as we defined it (23%) may be less common than rates reported previously in non-behavioral economic studies (30–72%) and appears to function as a substitute most commonly among those with higher rates of opioid use and pain. For survey-based studies (Corroon et al., 2017; Lucas et al., 2016), participants are queried about whether they substitute cannabis for opioids, but the definition of what constitutes a substitute is not detailed in the instructions. Therefore, it is possible that we are capturing a unique and specific cohort of individuals according to the behavioral economic definition of “substitute” and that prevalence comparisons across studies are not appropriate.
Limitations and future directions
This study is limited by the self-report nature of data collection, which is appropriate for behavioral economic evaluations and previously validated, but is likely less sensitive than clinical studies that objectively measure behavior. Second, several cases that violated our quality control criteria were eliminated from analysis; replicating these data in settings where researchers could provide feedback to individuals reporting purchasing unrealistic units of daily drugs could eliminate this problem in the future. Additionally, the tasks featuring cannabis were limited to grams of cannabis plant matter, which may not approximate the index opioid in terms of efficacy and potency or match participants’ preferred cannabis consumption method. Follow-up studies evaluating alternative cannabis products (such as cannabidiol), doses, and forms (i.e., edibles or concentrates) may provide a more in-depth understanding of the economic relation of cannabis and opioids.
Importantly, these data do not represent all chronic pain patients, only those who have a recent history with both drugs/medicines. In addition, participants in this study were asked to specifically think about their consumption for the purpose of treating pain. Although important, this approach does not provide an opportunity to assess circumstances wherein individuals use opioids and/or cannabis for a mix of therapeutic and recreational purposes and additional research to evaluate that context is warranted. Further, it is possible that some participants used cannabis legally as a medicinal product, and that other were using cannabis illicitly for medical purposes. Future studies should investigate how these factors may influence the co-use of these products for treating pain.
Finally, even though hypothetical cannabis use during constrained opioid availability was related to the severity of pain, we cannot completely rule out that the behavioral economic relations are due to factors unrelated to analgesic properties. This study should be replicated including a non-analgesic commodity to compare how it functions relative to cannabis.
Conclusion
Overall, this is the first study to examine the opioid-sparing effect of cannabis using a behavioral economic framework. Results provide critical insight into the decision-making processes surrounding cannabis and opioid co-use for pain treatment in a clinical population that is especially vulnerable to OUD. Data suggest cannabis availability may confer an opioid-sparing effect and may therefore serve as a potential means for mitigating some of the risks associated with opioid prescribing for pain management. Importantly, this study suggests that increasing the availability of cannabis (e.g., via legalization or decriminalization) is not likely to increase opioid use. These data also indicate that fewer individuals are likely to substitute cannabis (i.e., increase cannabis use in the absence of opioids) than had been suggested by the previous literature, suggesting that the availability of cannabis is not likely to give way to substantial increases in its consumption among pain populations if the availability of opioids becomes constrained. Future studies evaluating non-hypothetical co-use of cannabinoids and opioids are essential for determining whether the reductions in consumption seen here are representative of clinical behavior; these simulation findings suggest that, on average, persons prescribed opioids for pain and who have experience with cannabis are willing to modestly reduce their use of opioids when cannabis is available.
Funding
The author(s) disclosed receipt of the following financial support for the research, authorship, and/or publication of this article: This study was funded by National Institute on Drug Abuse grants R01DA040644 (Dunn and Campbell) and R01DA042751 (Campbell and Dunn). The training of SBD and CLB was supported by National Institute on Drug Abuse grant T32DA007209.
Footnotes
Declaration of conflicting interests
The author(s) declared no potential conflicts of interest with respect to the research, authorship, and/or publication of this article.
References
- Amlung M, Reed DD, Morris V, et al. (2019) Price elasticity of illegal versus legal cannabis: A behavioral economic substitutability analysis. Addiction 114: 112–118. [DOI] [PubMed] [Google Scholar]
- Aston ER, Metrik J and MacKillop J (2015) Further validation of a marijuana purchase task. Drug Alcohol Depend 152: 32–38. [DOI] [PMC free article] [PubMed] [Google Scholar]
- Aviram J and Samuelly-Leichtag G (2017) Efficacy of cannabis-based medicines for pain management: A systematic review and meta-analysis of randomized controlled trials. Pain Physician 20: E755–E796. [PubMed] [Google Scholar]
- Bachhuber MA, Saloner B, Cunningham CO, et al. (2014) Medical cannabis laws and opioid analgesic overdose mortality in the United States, 1999–2010. JAMA Intern Med 174: 1668–1673. [DOI] [PMC free article] [PubMed] [Google Scholar]
- Bergeria CL, Heil SH, Davis DR, et al. (2019) Evaluating the utility of the modified cigarette evaluation questionnaire and cigarette purchase task for predicting acute relative reinforcing efficacy of cigarettes varying in nicotine content. Drug Alcohol Depend 197: 56–64. [DOI] [PMC free article] [PubMed] [Google Scholar]
- Boehnke KF, Scott JR, Litinas E, et al. (2019) Pills to pot: Observational analyses of cannabis substitution among medical cannabis users with chronic pain. J Pain. Epub ahead of print 29 January 2019. DOI: 10.1016/j.jpain.2019.01.010. [DOI] [PubMed] [Google Scholar]
- Bohnert AS, Valenstein M, Bair MJ, et al. (2011) Association between opioid prescribing patterns and opioid overdose-related deaths. JAMA 305: 1315–1321. [DOI] [PubMed] [Google Scholar]
- Bruner NR and Johnson MW (2014) Demand curves for hypothetical cocaine in cocaine-dependent individuals. Psychopharmacology (Berl) 231: 889–897. [DOI] [PMC free article] [PubMed] [Google Scholar]
- Campbell G, Hall W and Nielsen S (2018) What does the ecological and epidemiological evidence indicate about the potential for cannabinoids to reduce opioid use and harms? A comprehensive review. Int Rev Psychiatry 30: 91–106. [DOI] [PubMed] [Google Scholar]
- Chandler J and Shapiro D (2016) Conducting clinical research using crowdsourced convenience samples. Annu Rev Clin Psychol 12: 53–81. [DOI] [PubMed] [Google Scholar]
- Cichewicz DL (2004) Synergistic interactions between cannabinoid and opioid analgesics. Life Sci 74: 1317–1324. [DOI] [PubMed] [Google Scholar]
- Cooper ZD, Bedi G, Ramesh D, et al. (2018) Impact of co-administration of oxycodone and smoked cannabis on analgesia and abuse liability. Neuropsychopharmacology 43: 2046–2055. [DOI] [PMC free article] [PubMed] [Google Scholar]
- Corroon JM Jr, Mischley LK and Sexton M (2017) Cannabis as a substitute for prescription drugs - a cross-sectional study. J Pain Res 10: 989–998. [DOI] [PMC free article] [PubMed] [Google Scholar]
- Dunn KM, Saunders KW, Rutter CM, et al. (2010) Opioid prescriptions for chronic pain and overdose: A cohort study. Ann Intern Med 152: 85–92. [DOI] [PMC free article] [PubMed] [Google Scholar]
- Finn DP, Beckett SR, Roe CH, et al. (2004) Effects of coadministration of cannabinoids and morphine on nociceptive behaviour, brain monoamines and HPA axis activity in a rat model of persistent pain. Eur J Neurosci 19: 678–686. [DOI] [PubMed] [Google Scholar]
- Gomes T, Mamdani MM, Dhalla IA, et al. (2011) Opioid dose and drug-related mortality in patients with nonmalignant pain. Arch Intern Med 171: 686–691. [DOI] [PubMed] [Google Scholar]
- Grace RC, Kivell BM and Laugesen M (2015) Estimating cross-price elasticity of e-cigarettes using a simulated demand procedure. Nicotine Tob Res 17: 592–598. [DOI] [PubMed] [Google Scholar]
- Higgins ST, Heil SH, Sigmon SC, et al. (2017) Addiction potential of cigarettes with reduced nicotine content in populations with psychiatric disorders and other vulnerabilities to tobacco addiction. JAMA Psychiatry 74: 1056–1064. [DOI] [PMC free article] [PubMed] [Google Scholar]
- Hursh SR and Silberberg A (2008) Economic demand and essential value. Psychol Rev 115: 186–198. [DOI] [PubMed] [Google Scholar]
- Johnson MW and Bickel WK (2006) Replacing relative reinforcing efficacy with behavioral economic demand curves. J Exp Anal Behav 85: 73–93. [DOI] [PMC free article] [PubMed] [Google Scholar]
- Johnson MW, Johnson PS, Rass O, et al. (2017) Behavioral economic substitutability of e-cigarettes, tobacco cigarettes, and nicotine gum. J Psychopharmacol 31: 851–860. [DOI] [PMC free article] [PubMed] [Google Scholar]
- Lucas P (2017) Rationale for cannabis-based interventions in the opioid overdose crisis. Harm Reduct J 14: 58. [DOI] [PMC free article] [PubMed] [Google Scholar]
- Lucas P, Walsh Z, Crosby K, et al. (2016) Substituting cannabis for prescription drugs, alcohol and other substances among medical cannabis patients: The impact of contextual factors. Drug Alcohol Rev 35: 326–333. [DOI] [PubMed] [Google Scholar]
- Lynch ME and Ware MA (2015) Cannabinoids for the treatment of chronic non-cancer pain: An Updated systematic review of randomized controlled trials. J Neuroimmune Pharmacol 10: 293–301. [DOI] [PubMed] [Google Scholar]
- MacKillop J, Goldenson NI, Kirkpatrick MG, et al. (2019) Validation of a behavioral economic purchase task for assessing drug abuse liability. Addict Biol 24: 303–314. [DOI] [PMC free article] [PubMed] [Google Scholar]
- Nguyen JD, Grant Y, Creehan KM, et al. (2019) Delta(9)-tetrahydrocannabinol attenuates oxycodone self-administration under extended access conditions. Neuropharmacology 151: 127–135. [DOI] [PMC free article] [PubMed] [Google Scholar]
- Nielsen S, Sabioni P, Trigo JM, et al. (2017) Opioid-sparing effect of cannabinoids: A systematic review and meta-analysis. Neuropsychopharmacology 42: 1752–1765. [DOI] [PMC free article] [PubMed] [Google Scholar]
- Peters EN, Rosenberry ZR, Schauer GL, et al. (2017) Marijuana and tobacco cigarettes: Estimating their behavioral economic relationship using purchasing tasks. Exp Clin Psychopharmacol 25: 208–215. [DOI] [PubMed] [Google Scholar]
- Pickover AM, Messina BG, Correia CJ, et al. (2016) A behavioral economic analysis of the nonmedical use of prescription drugs among young adults. Exp Clin Psychopharmacol 24: 38–47. [DOI] [PubMed] [Google Scholar]
- Poquet N and Lin C (2016) The Brief Pain Inventory (BPI). J Physiother 62: 52. [DOI] [PubMed] [Google Scholar]
- Reiman A, Welty M and Solomon P (2017) Cannabis as a substitute for opioid-based pain medication: Patient self-report. Cannabis Cannabinoid Res 2: 160–166. [DOI] [PMC free article] [PubMed] [Google Scholar]
- Reinhart M, Scarpati LM, Kirson NY, et al. (2018) The economic burden of abuse of prescription opioids: A systematic literature review from 2012 to 2017. Appl Health Econ Health Policy. Epub ahead of print 22 July 2018. DOI: 10.1007/s40258-018-0402-x. [DOI] [PMC free article] [PubMed] [Google Scholar]
- Rogers MA, Lemmen K, Kramer R, et al. (2017) Internet-delivered health interventions that work: Systematic review of meta-analyses and evaluation of website availability. J Med Internet Res 19: e90. [DOI] [PMC free article] [PubMed] [Google Scholar]
- Stein JS, Koffarnus MN, Snider SE, et al. (2015) Identification and management of nonsystematic purchase task data: Toward best practice. Exp Clin Psychopharmacol 23: 377–386. [DOI] [PMC free article] [PubMed] [Google Scholar]
- Strickland JC, Lile JA and Stoops WW (2017) Unique prediction of cannabis use severity and behaviors by delay discounting and behavioral economic demand. Behav Processes 140: 33–40. [DOI] [PMC free article] [PubMed] [Google Scholar]
- Strickland JC, Lile JA and Stoops WW (2019) Evaluating non-medical prescription opioid demand using commodity purchase tasks: Test-retest reliability and incremental validity. Psychopharmacology (Berl). Epub ahead of print 31 March 2019. DOI: 10.1007/s00213-019-05234-y. [DOI] [PMC free article] [PubMed] [Google Scholar]
- Tucker MR, Laugesen M and Grace RC (2018) Estimating demand and cross-price elasticity for very low nicotine content (VLNC) cigarettes using a simulated demand task. Nicotine Tob Res 20: 843–850. [DOI] [PubMed] [Google Scholar]
- Walters K, Christakis DA and Wright DR (2018) Are Mechanical Turk worker samples representative of health status and health behaviors in the U.S.? PLoS One 13: e0198835. [DOI] [PMC free article] [PubMed] [Google Scholar]
- Williams IJ, Edwards S, Rubo A, et al. (2006) Time course of the enhancement and restoration of the analgesic efficacy of codeine and morphine by delta9-tetrahydrocannabinol. Eur J Pharmacol 539(1–2): 57–63. [DOI] [PubMed] [Google Scholar]