

Abstract
Background
MicroRNA‐146b (miR‐146b) is a critical regulator and prognosis biomarker in several hematological malignancies, whereas its role in multiple myeloma (MM) was unclear. Therefore, this study aimed to investigate the significance of miR‐146b in MM patients.
Methods
The plasma cells were separated from bone marrow samples of 180 symptomatic MM patients (before treatment) and 50 healthy controls (HCs), and subsequently detected by reverse transcription‐quantitative polymerase chain reaction for miR‐146b expression.
Results
MiR‐146b was increased in MM patients compared with HCs (P < .001), and it predicted increased MM risk (area under curve (AUC): 0.879, 95% confidence interval (CI): 0.822‐0.936). For clinical parameters, miR‐146b was positively correlated with serum creatinine (P = .047), beta‐2‐microglobulin (P < .001), lactate dehydrogenase (P < .001), bone lesion (P = .027), International Staging System (ISS) stage (P < .001), and t (4; 14; P = .006), while negatively correlated with albumin (P = .004) in MM patients. For prognosis, miR‐146b was decreased in complete response (CR) patients compared with non‐CR patients (P = .025), as well as in overall response rate (ORR) patients compared with non‐ORR patients (P = .036), and it discriminated CR patients from non‐CR patients (AUC: 0.610, 95% CI: 0.523‐0.698) and distinguished ORR patients from non‐ORR patients (AUC: 0.602, 95% CI: 0.501‐0.703) in MM patients. Moreover, miR‐146b was correlated with worse progression‐free survival (P = .007) and overall survival (P = .014) in MM patients.
Conclusion
MiR‐146b was overexpressed in MM patients and predicted increased MM risk; meanwhile, it correlated with deteriorated clinical properties, increased ISS stage, cacoethic chromosome abnormality, and worse prognosis in MM patients.
Keywords: disease severity, microRNA‐146b, multiple myeloma, progress‐free and overall survival, response to treatment
1. INTRODUCTION
Multiple myeloma (MM), a malignancy of plasma cells that mostly affect the elderly, accounts for over 10% of hematologic cancers and approximately 1% of all cancers, which is characterized by clonal plasma cells as well as monoclonal protein in the blood and urine.1, 2, 3, 4 It is widely recognized that several factors are correlated with the enhanced risk of MM, such as aging, consumption of tobacco and alcohol, and obesity. 5, 6, 7 Due to the introduction of effective drugs (such as proteasome inhibitors and immunomodulatory drugs), the outcomes of MM patients have been greatly improved; however, the prognosis for patients with high‐risk features (such as enhanced beta‐2‐microglobulin [β2‐MG], t [4; 14], and elevated lactose dehydrogenase [LDH]) is still unsatisfying (median survival is 2‐3 years).8, 9, 10 Therefore, it is critical to screen for potential biomarkers for early prevention of MM to improve the prognosis of MM patients.
MiR‐146b, located on chromosome 10, has been demonstrated to be a key factor in the leukemic transformation of hematopoietic cells by suppressing anti‐oncogene NUMB.11 Moreover, various studies report that miR‐146b is a vital regulator in hematological malignancies (such as chronic lymphocytic leukemia, acute myeloid leukemia, and mycosis fungoides).12, 13, 14 However, the significance of miR‐146b in MM patients remains to be clarified. Therefore, we hypothesized that miR‐146b was also an important regulator in MM. In the present study, we enrolled 180 newly diagnosed symptomatic MM patients and 50 healthy subjects, and detected miR‐146b expression in the plasma cells from their bone marrow samples. This study aimed to explore the predictive value of miR‐146b for MM risk, as well as investigate its correlation with the clinical characteristics and prognosis in MM patients.
2. MATERIALS AND METHODS
2.1. Participants
We consecutively recruited 180 newly diagnosed symptomatic MM patients from our hospitals, between January 2016 and June 2019. The inclusion criteria were as follows: (a) diagnosed as de novo symptomatic MM according to International Myeloma Working Group (IMWG) criteria of multiple myeloma15; (b) age ≥18 years old; (c) no history of chemotherapy, radiotherapy, or stem cell transplantation; and (d) seronegative for human immunodeficiency virus (HIV). Patients who complicated with other hematologic malignancies or solid tumors were excluded. Pregnant or lactating women were also excluded from this study. In addition, from January 2016 to June 2019, 50 healthy subjects who underwent bone marrow donation in our hospitals were enrolled as healthy controls (HCs). And the healthy conditions of HCs were confirmed before donation. This study was approved by the Institutional Review Board of our hospitals. All participants or their guardians signed the written informed consent before enrollment.
2.2. Data collection
After enrollment, the clinical characteristics of MM patients were recorded, which included age, gender, immunoglobulin subtype, hemoglobin (Hb) level, calcium level, serum creatinine (Scr), albumin (ALB), beta‐2‐microglobulin (β2‐MG), lactate dehydrogenase (LDH), t (4; 14), t (14; 16), and del (17p). Bone lesion and renal impairment were evaluated according to the guideline of MM.16 Besides, the Durie‐Salmon stage and International Staging System (ISS) stage were assessed according to the criteria of Durie‐Salmon and the criteria of ISS, respectively.17, 18
2.3. Sample collection and processing
The bone marrow samples of MM patients were obtained before initiation of treatment. The bone marrow samples of HCs were collected when examining their eligibility for bone marrow transplantation. Then, bone marrow mononuclear cells were separated from bone marrow samples by gradient density centrifugation, and CD138‐positive plasma cells were purified from bone marrow mononuclear cells using CD138‐coated magnetic beads (Miltenyi Biotec). After separation, the plasma cells were stored in liquid nitrogen until further detection.
2.4. MiR‐146b detection
The relative expression of miR‐146b (NCBI Gene ID: 574447) in plasma cells was detected by reverse transcription‐quantitative polymerase chain reaction (RT‐qPCR). TRIzol™ Reagent (Invitrogen) was used for total RNA extraction. Reverse transcription was conducted using ReverTra Ace® qPCR RT Master Mix (Toyobo) according to the manufacturer's instructions. KOD SYBR® qPCR Mix (Toyobo) was used for conducting qPCR according to the manufacturer's guidance. U6 was set as the internal reference. The relative expression of miRNA was calculated by the formula. The measurement of miR‐146b relative expression was triplicated, and the internal consistency was good. Primers (5′‐3′): miR‐146b forward primer: ACACTCCAGCTGGGTGAGAACTGAATTCCA, reverse primer: TGTCGTGGAGTCGGCAATTC; U6 forward primer: CTCGCTTCGGCAGCACATATACTA, reverse primer: ACGAATTTGCGTGTCATCCTTGC.
2.5. Treatment and follow‐up
Appropriate treatments were given to the patients, which decided by their attending physician according to NCCN Clinical Practice Guidelines in Oncology: Multiple Myeloma (2015.V4).16 After treatment for two cycles, the clinical response of patients was assessed according to the guideline for MM,16 which included complete response (CR), very good partial response (VGPR), and partial response (PR). Overall response rate (ORR) was defined as the proportion of patients who achieved confirmed CR, VGPR, or PR during treatment. Routine follow‐up was carried out for all patients by telephone or clinical visit. The last follow‐up date was 2019/06/30, and the median follow‐up duration was 26.0 months (ranges 2.0‐42.0 months). Progression‐free survival (PFS) was defined as the duration from initiation of treatment to disease progression or death, and for the patients not known whether the disease had progressed or whether they had died at the last follow‐up date, they were censored on the date of last visit. Overall survival (OS) was defined as the duration from initiation of treatment to death, and for the patients not known to have died at the last follow‐up date, they were censored on the date they were last known to be alive.
2.6. Statistical analysis
The statistical analysis was performed with the use of SPSS 22.0 (IBM). Figures were plotted using GraphPad Prism 7.00 (GraphPad Software). The normality of the continuous variable was determined by Kolmogorov‐Smirnov test. The normally distributed variable was presented as mean ± standard deviation (SD), and the non‐normal distributed variables were expressed as median (interquartile range, IQR). Categorical variables were displayed as count (percentage). Comparison of miR‐146b relative expression between two groups was determined by Wilcoxon rank‐sum test. Correlation of miR‐146b relative expression with clinical characteristics (continuous variables) was analyzed by Spearman's rank correlation test, and correlation of miR‐146b relative expression with clinical characteristics (categorical variable) was determined by Wilcoxon rank‐sum test, Kruskal‐Wallis H test, or Spearman's rank correlation test. The ability of miR‐146b in discriminating MM patients from HCs or in predicting CR or ORR for MM patients was displayed by receiver operating characteristic (ROC) curve and the area under the curve (AUC) with 95% confidence interval (CI). All MM patients were further classified as miR‐146b high group and miR‐146b low group based on the median value of miR‐146b in plasma cells of MM patients. PFS and OS were expressed using Kaplan‐Meier curves, and the differences of PFS and OS between miR‐146b high and miR‐146b low group were determined by log‐rank test. All tests were two‐tailed; P value < .05 was considered as significant.
3. RESULTS
3.1. Clinical characteristics of MM patients
For demographic characteristics, the mean age of MM patients was 57.7 ± 8.6 years, and there were 72 (40.0%) females and 108 (60.0%) males in MM patients. For clinical characteristics, there were 103 (57.2%) patients with IgG subtype, 43 (23.9%) patients with IgA subtype, and 34 (18.9%) patients with other immunoglobulin subtypes. There were 20 (11.1%) patients with Durie‐Salmon stage II and 160 (88.9%) patients with stage III. Meanwhile, there were 40 (22.2%) patients with ISS stage I, 53 (29.4%) patients with ISS stage II, and 87 (48.3%) patients with ISS stage III. In addition, there were 18 (10.0%) patients with t (4; 14), while 162 (90.0%) patients without it; 28 (15.6%) patients with t (14; 16), while 152 (84.4%) patients without it; and 15 (8.3%) patients with del (17p), while 165 (91.7%) patients without it. The detailed information about other clinical characteristics of MM patients is listed in Table 1.
Table 1.
Clinical characteristics of MM patients
| Items | MM patients (N = 180) |
|---|---|
| Age (y), Mean ± SD | 57.7 ± 8.6 |
| Gender, No. (%) | |
| Female | 72 (40.0) |
| Male | 108 (60.0) |
| Immunoglobulin subtype, No. (%) | |
| IgG | 103 (57.2) |
| IgA | 43 (23.9) |
| Others | 34 (18.9) |
| Bone lesion, No. (%) | |
| No | 47 (26.1) |
| Yes | 133 (73.9) |
| Renal impairment, No. (%) | |
| No | 108 (60.0) |
| Yes | 72 (40.0) |
| Durie‐Salmon stage, No. (%) | |
| II | 20 (11.1) |
| III | 160 (88.9) |
| ISS stage, No. (%) | |
| I | 40 (22.2) |
| II | 53 (29.4) |
| III | 87 (48.3) |
| Biochemical indexes | |
| Hb (g/L), Mean ± SD | 100.0 ± 24.5 |
| Calcium (mg/dL), Mean ± SD | 9.8 ± 2.0 |
| Scr (mg/dL), median (IQR) | 1.8 (1.4‐2.2) |
| ALB (g/L), median (IQR) | 34.0 (29.0‐37.0) |
| β2‐MG (mg/L), median (IQR) | 5.4 (2.6‐8.7) |
| LDH (U/L), median (IQR) | 214.3 (181.9‐250.4) |
| Cytogenetics abnormalities, No. (%) | |
| t (4; 14) | |
| No | 162 (90.0) |
| Yes | 18 (10.0) |
| t (14; 16) | |
| No | 152 (84.4) |
| Yes | 28 (15.6) |
| Del (17p) | |
| No | 165 (91.7) |
| Yes | 15 (8.3) |
| Treatment, No. (%) | |
| BD | 115 (63.9) |
| MPB | 65 (36.1) |
Abbreviations: ALB, albumin; BD, bortezomib/dexamethasone; Hb, hemoglobin; IgA, immunoglobulin A; IgG, immunoglobulin G; IQR, interquartile range; ISS, International Staging System; LDH, lactate dehydrogenase; MM, multiple myeloma; MPB, melphalan/prednisone/bortezomib; Scr, serum creatinine; SD, standard deviation; β2‐MG, beta‐2‐microglobulin.
3.2. MiR‐146b expression and its predictive value for MM risk
The RT‐qPCR assays showed that miR‐146b was increased in MM patients (2.738 [2.052‐4.220]) compared with HCs (0.904 [0.350‐1.597]; P < .001; Figure 1A), and ROC curve revealed that miR‐146b possessed a good predictive value for MM risk (AUC: 0.879, 95% CI: 0.822‐0.936; Figure 1B).
Figure 1.
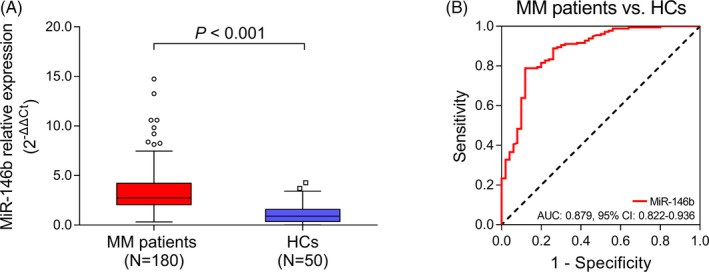
MiR‐146b in MM patients and HCs, and its predictive value for MM risk. A, Comparison of miR‐146b in MM patients and HCs. B, Predictive value of miR‐146b for MM risk. Comparison of miR‐146b between groups was conducted by Wilcoxon rank‐sum test. ROC curve was conducted to evaluate the predictive value of miR‐146b for MM risk. P < .05 was considered significant. AUC, area under curve; CI, confidence interval; HC, healthy control; MiR‐146b, microRNA‐146b; MM, multiple myeloma; ROC, receiver operating characteristic
3.3. Correlation of miR‐146b with clinical characteristics in MM patients
For continuous variables, miR‐146b was positively correlated with Scr (r = 0.148, P = .047), β2‐MG (r = 0.291, P < .001), and LDH (r = 0.303, P < .001), while negatively correlated with ALB (r = −0.216, P = .004) in MM patients. However, no correlation was found between miR‐146b and age (r = −0.071, P = .343), Hb (r = 0.052, P = .488), or calcium (r = −0.045, P = .544) in MM patients (Table 2). For categorical variables, miR‐146b was positively associated with bone lesion (P = .027), ISS stage (P < .001), and t (4; 14; P = .006), whereas no association was found between miR‐146b and gender (P = .452), immunoglobulin subtype (P = .134), renal impairment (P = .286), Durie‐Salmon stage (P = .881), t (14; 16; P = .998), or del (17p; P = .395) in MM patients (Table 3).
Table 2.
Correlation of miR‐146b relative expression with clinical characteristics (continuous variables) in MM patients
| Items | MiR‐146b relative expression | |
|---|---|---|
| P value | Correlation coefficient (r) | |
| Age | .343 | −0.071 |
| Hb | .488 | 0.052 |
| Calcium | .544 | −0.045 |
| Scr | .047 | 0.148 |
| ALB | .004 | −0.216 |
| β2‐MG | <.001 | 0.291 |
| LDH | <.001 | 0.303 |
Correlation was determined by Spearman's rank correlation test.
Abbreviations: ALB, albumin; Hb, hemoglobin; LDH, lactate dehydrogenase; MM, multiple myeloma; Scr, serum creatinine; β2‐MG, beta‐2‐microglobulin.
Table 3.
Correlation of miR‐146b relative expression with clinical characteristics (categorical variables) in MM patients
| Items | MiR‐146b relative expression | |
|---|---|---|
| Median (IQR) | P value | |
| Gender, No. (%) | .452 | |
| Female | 2.708 (2.065‐4.158) | |
| Male | 2.754 (1.954‐4.465) | |
| Immunoglobulin subtype, No. (%) | .134 | |
| IgG | 2.602 (2.030‐3.764) | |
| IgA | 3.392 (2.184‐5.361) | |
| Others | 3.085 (2.218‐4.884) | |
| Bone lesion, No. (%) | .027 | |
| No | 2.358 (1.570‐3.289) | |
| Yes | 2.862 (2.141‐4.442) | |
| Renal impairment, No. (%) | .286 | |
| No | 2.708 (2.049‐3.825) | |
| Yes | 2.779 (2.085‐4.620) | |
| Durie‐Salmon stage, No. (%) | .881 | |
| II | 2.432 (2.188‐4.399) | |
| III | 2.764 (2.049‐4.220) | |
| ISS stage, No. (%) | <.001 | |
| I | 2.254 (1.303‐3.391) | |
| II | 2.725 (1.992‐3.534) | |
| III | 3.470 (2.273‐5.243) | |
| Cytogenetics abnormal, No. (%) | ||
| t (4; 14) | .006 | |
| No | 2.726 (2.006‐4.187) | |
| Yes | 4.021 (2.504‐7.701) | |
| t (14; 16) | .998 | |
| No | 2.731 (2.049‐4.227) | |
| Yes | 2.862 (2.109‐4.193) | |
| Del (17p) | .395 | |
| No | 2.725 (2.050‐4.200) | |
| Yes | 3.470 (2.122‐4.607) | |
Correlation was determined by Wilcoxon rank‐sum test, Kruskal‐Wallis H test, or Spearman's rank correlation test.
Abbreviations: IgA, immunoglobulin A; IgG, immunoglobulin G; ISS, International Staging System; MM, multiple myeloma.
3.4. Correlation of miR‐146b with treatment response in MM patients
After 2 cycles of primary treatment, there were 47 (26.1%) CR patients and 132 (73.3%) ORR patients (Figure 2A). MiR‐146b was decreased in CR patients compared with non‐CR patients (P = .025; Figure 2B), and it distinguished CR patients from non‐CR patients (AUC: 0.610, 95% CI: 0.523‐0.698; Figure 2C). Meanwhile, miR‐146b was decreased in ORR patients compared with non‐ORR patients (P = .036; Figure 2D), and it distinguished ORR patients from non‐ORR patients (AUC: 0.602, 95% CI: 0.501‐0.703; Figure 2E). Moreover, there were 115 (63.9%) patients received bortezomib/dexamethasone (BD) and 65 (36.1%) patients received melphalan/prednisone/bortezomib (MPB). No difference was found in miR‐146b between patients treated with BD and MPB (Figure S1).
Figure 2.
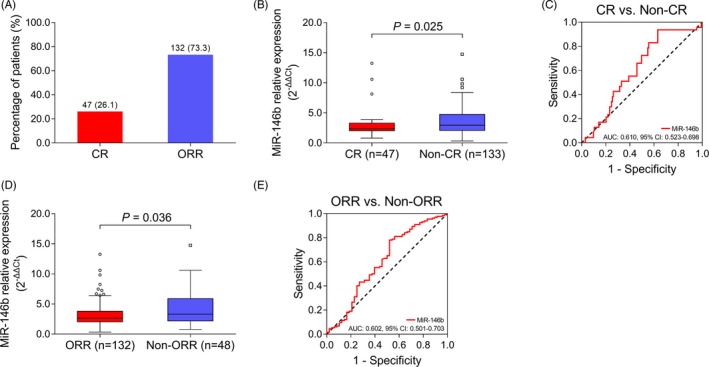
Predictive value of miR‐146b for treatment response in MM patients. A, Number and portion of CR and ORR patients. B, Comparison of miR‐146b between CR and non‐CR patients. C, Predictive value of miR‐146b for CR in MM patients. D, Comparison of miR‐146b between ORR and non‐ORR patients. E, Predictive value of miR‐146b for ORR in MM patients. Comparison of miR‐146b between groups was conducted by Wilcoxon rank‐sum test. ROC curve was conducted to evaluate the predictive value of miR‐146b for CR and ORR P < .05 was considered significant. AUC, area under curve; CI, confidence interval; CR, complete response; MiR‐146b, microRNA‐146b; MM, multiple myeloma; ORR, overall response rate; ROC, receiver operating characteristic
3.5. Correlation of miR‐146b with PFS and OS in MM patients
According to the median value of miR‐146b in MM patients, they were further divided into miR‐146b high group and miR‐146b low group. MiR‐146b was correlated with worse PFS (P = .007; Figure 3A) and OS (P = .014; Figure 3B) in MM patients.
Figure 3.

Association of miR‐146b with PFS and OS in MM patients. A, Association of miR‐146b with PFS. B, Association of miR‐146b with OS in MM patients. Kaplan‐Meier curve was conducted to display PFS/OS. The difference of PFS/OS between miR‐146b high group and miR‐146b low group was determined by log‐rank test. P < .05 was considered significant. MiR‐146b, microRNA‐146b; MM, multiple myeloma; OS, overall survival; PFS, progression‐free survival
3.6. Correlation of miR‐146b with PFS and OS in age>=60 subgroup and age <60 subgroup
MM patients <60 years were further divided into miR‐146b high group and miR‐146b low group according to the median value of miR‐146b in them. No correlation was found between miR‐146b and PFS (P = .114; Figure 4A), but miR‐146b was correlated with worse OS (P = .019; Figure 4B) in MM patients <60 years. Meanwhile, MM patients>=60 years were further divided into miR‐146b high group and miR‐146b low group according to the median value of miR‐146b in them. MiR‐146b was associated with poor PFS (P = .013; Figure 4C), while no correlation was observed between miR‐146b and OS (P = .320; Figure 4D) in MM patients>=60 years.
Figure 4.

Subgroup analysis. A, Association of miR‐146b with PFS in MM patients < 60 y. B, Association of miR‐146b with OS in MM patients < 60 y. C, Association of miR‐146b with PFS in MM patients>=60 y. D, Association of miR‐146b with OS in MM patients>=60 y. Kaplan‐Meier curve was conducted to display PFS/OS in MM patients. The difference of PFS/OS between miR‐146b high and miR‐146b low group was determined by log‐rank test. P < .05 was considered significant. MiR‐146b, microRNA‐146b; MM, multiple myeloma; OS, overall survival; PFS, progression‐free survival
4. DISCUSSION
In this study, we discovered that: (a) MiR‐146b was increased in MM patients compared with HCs, and it showed a good predictive value for increased MM risk. (b) MiR‐146b was positively correlated with increased renal impairment, ISS stage, and chromosome abnormality in MM patients. (c) MiR‐146b was associated with worse CR and ORR to inductive treatment, as well as PFS and OS in MM patients.
MiR‐146b is one of the negative regulators of nuclear factor‐kappa B (NF‐κB) pathway, whose dysregulation has been found in several hematologic malignancies.19 It is reported that the overexpression of miR‐146b in microvesicles promotes the transformation of hematopoietic cells to a leukemic state by repressing tumor suppressor gene NUMB.11 Meanwhile, the knockdown of miR‐146b in chronic lymphocytic leukemia (CLL) cells leads to the enhanced transcriptional expression of several tumor suppressors such as ATM serine/threonine kinase (ATM), histone deacetylase 1 (HDAC1), and Caenorhabditis elegans small worm phenotype and Drosophila mothers against decapentaplegic family member 4 (SMAD4); moreover, miR‐146b knockdown decreased cell proliferation markers such as antigen KI‐67 and DNA topoisomerase 2‐alpha in CLL cells.20 Clinically, miR‐146b is reported to be an independent poor prognostic factor in CLL patients.12 Additionally, it is described that the up‐regulation of miR‐146b differentiates early patients with mycosis fungoides, one of the variants of cutaneous T‐cell lymphoma, from patients with atopic dermatitis.13 Collectively, these results reveal that miR‐146b is a key regulator in hematologic malignancies.
According to previous researches, miR‐146b is highly expressed in hematologic malignance patients and showed predictive value for increased disease risk.13, 20 For example, miR‐146b expression is elevated in circulating B cells of CLL patients compared to that of healthy donors, and it displays predictive value for the risk of mycosis fungoides.13, 20 However, the role of miR‐146b in MM is yet to be clarified. In this study, an elevation in the expression of miR‐146b was observed in MM patients compared with HCs, and the ROC curve revealed that miR‐146b showed a good predictive value for increased MM risk. Possible explanations might be that: MiR‐146b might inhibit anti‐oncogene (such as NUMB, HDAC1, ATM, and SMAD4) to promote the malignant transformation of plasma cells; therefore, miR‐146b was overexpressed in MM patients and it predicted increased MM risk.
As to the correlation of miR‐146b with clinical parameters in patients, it is reported that miR‐146b is associated with chromosome abnormality trisomy 12 in CLL patients.14 Meanwhile, it is shown that miR‐146b is up‐regulated in acute renal injury mice patients compared to controls, and further in vivo study shows that knockdown of miR‐146b protects renal tubular epithelial cells from apoptosis, indicating its significance in renal impairment.21 In this study, clinical characteristics were recorded and their correlations with miR‐146b were analyzed. Data revealed that miR‐146b was positively correlated with Scr, β2‐MG, LDH, bone lesion, ISS stage, and t (4; 14), while negatively correlated with ALB. Possible explanations were as follows: (a) MiR‐146b might inhibit several tumor suppressors (such as NUMB, ATM, and SMAD4) to enhance the survival and proliferation of MM cells and contribute to the expression of monoclonal free light chain. Meanwhile, high expression of miR‐146b might induce apoptosis in renal tubular epithelial cells, which resulted in elevated renal impairment and worse general status in MM patients. Therefore, miR‐146b was positively correlated with Scr, β2‐MG, and ISS stage in MM patients. (b) MiR‐146b is reported to regulate the Wnt/β‐catenin pathway in glioma stem cells; meanwhile, Wnt/β‐catenin plays a vital role in the activation of osteoblasts.3, 22 In MM patients, miR‐146b might inhibit osteoblasts via Wnt/β‐catenin to induce the imbalanced function of osteoblasts and osteoclasts and caused bone lesions. (c) LDH plays an important role in the Warburg effect, which also exists in MM, and miR‐146b was correlated with advanced stage in MM patients; therefore, miR‐146b was correlated with increased LDH.23 (d) MiR‐146b might regulate several signaling pathways (such as NF‐κB pathway), therefore indirectly induced the genetic alteration (such as t [4; 14]) in MM patients, which need further demonstration.
As to the prognosis value of miR‐146b, previous studies display that miR‐146b is decreased in CLL patients in response to ibrutinib, and it independently predicts worse prognosis in acute myeloid leukemia.12, 20 In line with these studies, we disclosed miR‐146b was correlated with decreased CR and ORR to inductive treatment, as well as worse PFS and OS. However, the statistical significance was relatively low, and further validation should be done. These data could be explained by that: (a) MiR‐146b was positively correlated with Scr, β2‐MG, ISS stage, and t (4; 14), while negatively correlated with ABL, which are prognostic factors for worse survival in MM patients. Therefore, miR‐146b was negatively correlated with PFS and OS. (b) Similar to the previous research that miR‐146b induces chemoresistance in osteosarcoma cells, miR‐146b might also target Wnt/β‐catenin pathway in MM cells to enhance cell survival, thereby induced drug tolerance to MM cells, which resulted in the poorer treatment effect and decreased CR as well as ORR, and finally caused worse PFS and OS in MM patients.24
Despite the interesting results, there were several limitations in this study. (a) This study only enrolled newly diagnosed MM patients; therefore, for patients with recurrent MM, the correlation of miR‐146b with clinical characteristics and prognosis was still unclear, which could be studied further. (b) The embedded mechanism of miR‐146b function in MM progression was not investigated, and further research including in vitro and in vivo studies could be conducted. (c) The follow‐up period in this study was relatively short (the longest follow‐up duration was 42.0 months), which might cause bias in the survival comparison, and the correlation of miR‐146b with long‐term prognosis in MM patients was unclear. And studies with a long‐term follow‐up duration should be conducted. (d) The effect of MiR‐146b in the drug sensitivity to treatment of MM patients was not explored in this study, which might be investigated in the future. (e) The change of miR‐146b after treatment was not investigated in this study, which might be explored in the future.
To collect up, miR‐146 is highly expressed in MM patients and it predicts increased MM risk; meanwhile, its elevated expression is correlated with worse clinical properties, ISS stage, genetic lesion, and deteriorative prognosis in MM patients. In other words, miR‐146b might be a potential biomarker for the prevention and improvement of prognosis in MM.
CONFLICT OF INTEREST
The authors declare that they have no conflicts of interest.
Supporting information
Bao Y, Wei M, Ji X. MicroRNA‐146b overexpression associates with deteriorated clinical characteristics, increased International Staging System stage, cacoethic chromosome abnormality, and unfavorable prognosis in multiple myeloma patients. J Clin Lab Anal. 2020;34:e23168 10.1002/jcla.23168
Bao and Wei contributed equally to this work.
REFERENCES
- 1. Siegel RL, Miller KD, Jemal A. Cancer statistics, 2016. CA Cancer J Clin. 2016;66(1):7‐30. [DOI] [PubMed] [Google Scholar]
- 2. Rajkumar SV. Multiple myeloma: 2016 update on diagnosis, risk‐stratification, and management. Am J Hematol. 2016;91(7):719‐734. [DOI] [PMC free article] [PubMed] [Google Scholar]
- 3. Palumbo A, Anderson K. Multiple myeloma. N Engl J Med. 2011;364(11):1046‐1060. [DOI] [PubMed] [Google Scholar]
- 4. Palumbo A, Bringhen S, Ludwig H, et al. Personalized therapy in multiple myeloma according to patient age and vulnerability: a report of the European Myeloma Network (EMN). Blood. 2011;118(17):4519‐4529. [DOI] [PubMed] [Google Scholar]
- 5. Manier S, Kawano Y, Bianchi G, Roccaro AM, Ghobrial IM. Cell autonomous and microenvironmental regulation of tumor progression in precursor states of multiple myeloma. Curr Opin Hematol. 2016;23(4):426‐433. [DOI] [PubMed] [Google Scholar]
- 6. Walker BA, Boyle EM, Wardell CP, et al. Mutational spectrum, copy number changes, and outcome: results of a sequencing study of patients with newly diagnosed myeloma. J Clin Oncol. 2015;33(33):3911‐3920. [DOI] [PMC free article] [PubMed] [Google Scholar]
- 7. Avet‐Loiseau H, Hulin C, Campion L, et al. Chromosomal abnormalities are major prognostic factors in elderly patients with multiple myeloma: the intergroupe francophone du myelome experience. J Clin Oncol. 2013;31(22):2806‐2809. [DOI] [PMC free article] [PubMed] [Google Scholar]
- 8. Kyle RA, Rajkumar SV. Multiple myeloma. Blood. 2008;111(6):2962‐2972. [DOI] [PMC free article] [PubMed] [Google Scholar]
- 9. Rajkumar SV, Jacobus S, Callander NS, et al. Lenalidomide plus high‐dose dexamethasone versus lenalidomide plus low‐dose dexamethasone as initial therapy for newly diagnosed multiple myeloma: an open‐label randomised controlled trial. Lancet Oncol. 2010;11(1):29‐37. [DOI] [PMC free article] [PubMed] [Google Scholar]
- 10. Munshi NC, Avet‐Loiseau H, Rawstron AC, et al. Association of minimal residual disease with superior survival outcomes in patients with multiple myeloma: a meta‐analysis. JAMA Oncol. 2017;3(1):28‐35. [DOI] [PMC free article] [PubMed] [Google Scholar]
- 11. Zhang HM, Li Q, Zhu X, et al. miR‐146b‐5p within BCR‐ABL1‐positive microvesicles promotes leukemic transformation of hematopoietic cells. Can Res. 2016;76(10):2901‐2911. [DOI] [PubMed] [Google Scholar]
- 12. Zhu R, Zhao W, Fan F, et al. A 3‐miRNA signature predicts prognosis of pediatric and adolescent cytogenetically normal acute myeloid leukemia. Oncotarget. 2017;8(24):38902‐38913. [DOI] [PMC free article] [PubMed] [Google Scholar]
- 13. Ralfkiaer U, Lindahl LM, Litman T, et al. MicroRNA expression in early mycosis fungoides is distinctly different from atopic dermatitis and advanced cutaneous T‐cell lymphoma. Anticancer Res. 2014;34(12):7207‐7217. [PubMed] [Google Scholar]
- 14. Visone R, Rassenti LZ, Veronese A, et al. Karyotype‐specific microRNA signature in chronic lymphocytic leukemia. Blood. 2009;114(18):3872‐3879. [DOI] [PMC free article] [PubMed] [Google Scholar]
- 15. Rajkumar SV, Dimopoulos MA, Palumbo A, et al. International Myeloma Working Group updated criteria for the diagnosis of multiple myeloma. Nihon Rinsho Jpn J Clin Med. 2014;15(12):e538‐e548. 10.1016/S1470-2045(14)70442-5 [DOI] [PubMed] [Google Scholar]
- 16. NCCN clinical practice guidelines in oncology: multiple myeloma (2015. V4). http://www.nccn.org [DOI] [PubMed]
- 17. Durie BG, Salmon SE. A clinical staging system for multiple myeloma. Correlation of measured myeloma cell mass with presenting clinical features, response to treatment, and survival. Cancer. 1975;36(3):842‐854. [DOI] [PubMed] [Google Scholar]
- 18. Greipp PR, San Miguel J, Durie BG, et al. International staging system for multiple myeloma. J Clin Oncol. 2005;23(15):3412‐3420. [DOI] [PubMed] [Google Scholar]
- 19. Chou CK, Liu RT, Kang HY. MicroRNA‐146b: a novel biomarker and therapeutic target for human papillary thyroid cancer. Int J Mol Sci. 2017;18(3):636. [DOI] [PMC free article] [PubMed] [Google Scholar]
- 20. Saleh LM, Wang W, Herman SE, et al. Ibrutinib downregulates a subset of miRNA leading to upregulation of tumor suppressors and inhibition of cell proliferation in chronic lymphocytic leukemia. Leukemia. 2017;31(2):340‐349. [DOI] [PMC free article] [PubMed] [Google Scholar]
- 21. Zhu Y, Yu J, Yin L, et al. MicroRNA‐146b, a sensitive indicator of mesenchymal stem cell repair of acute renal injury. Stem Cells Transl Med. 2016;5(10):1406‐1415. [DOI] [PMC free article] [PubMed] [Google Scholar]
- 22. Yang W, Yu H, Shen Y, Liu Y, Yang Z, Sun T. MiR‐146b‐5p overexpression attenuates stemness and radioresistance of glioma stem cells by targeting HuR/lincRNA‐p21/beta‐catenin pathway. Oncotarget. 2016;7(27):41505‐41526. [DOI] [PMC free article] [PubMed] [Google Scholar]
- 23. Jurisic V, Radenkovic S, Konjevic G. The actual role of LDH as tumor marker, biochemical and clinical aspects. Adv Exp Med Biol. 2015;867:115‐124. [DOI] [PubMed] [Google Scholar]
- 24. Xu E, Zhao J, Ma J, et al. miR‐146b‐5p promotes invasion and metastasis contributing to chemoresistance in osteosarcoma by targeting zinc and ring finger 3. Oncol Rep. 2016;35(1):275‐283. [DOI] [PubMed] [Google Scholar]
Associated Data
This section collects any data citations, data availability statements, or supplementary materials included in this article.
Supplementary Materials