Abstract
Background
In previous research, we found diabetes rather than obesity was an independent risk factor of breast cancer. However, why diabetes could lead to increased risk of breast cancer patients remains elusive. Long non‐coding RNAE330013P06 has been shown to be upregulated in diabetes, and long non‐coding RNAs generally promote progression of cancer.
Methods
About 200 specimens of breast patients were obtained in previous clinical trial; 34 samples diagnosed as type 2 diabetes in breast cancer patient were enrolled in this research. Blood samples from 36 patients diagnosed as breast cancer without diabetes; 35 diabetic patients and 35 healthy peoples were obtained as control. All blood samples were measured by quantitative real‐time PCR (qRT‐PCR). Invasion and migration were tested by Transwell assay. Cell proliferation assay was tested by CCK‐8. Protein analysis was determined by Western blot.
Results
Compared with breast cancer patients without diabetes, diabetic patients without breast cancer and healthy peoples, LncRNAE330013P06 was upregulated in breast cancer patient with diabetes. Furthermore, of 34 breast patients, high LncRNAE330013P06 expression was significantly associated with family history, tumor‐node‐metastasis stage and lymph node metastasis. E33 promoted cancer cell growth in vitro via downregulation of P53.
Conclusion
Upregulation of LncRNAE330013P06 driven by type 2 diabetes is one of the factors which promoted progression of breast cancer.
Keywords: breast cancer, cell growth, diabetes, long non‐coding RNAE330013P06
1. INTRODUCTION
Breast cancer remains to be a major cause of cancer death in females worldwide.1 Like several epithelial cancers, breast cancer is also a heterogeneous disease characterized by multiple pathological subtypes.2
Traditional views thought diabetes especially type 2 diabetes was associated with increased risk of breast cancer, because of higher body mass index (BMI). Our previous research showed that diabetes is an independent factor for risk of breast cancer rather than BMI.3 Nevertheless, there were few breast patients with diabetes 1 that might be accounted for shorter life span of patients or its lower BMI. It has been demonstrated diabetic patients with breast cancer receiving metformin and neoadjuvant chemotherapy have a higher pCR rate than do diabetics not receiving metformin.4 So, the underlying mechanism remains unknown. Upregulation of IGF‐1 of plasm is an explanation why diabetes 2 would increase the risk of breast cancer.5 But, some other researches seemed not to support this explanation.
Recently, long non‐coding RNAs (LncRNA) of plasma, that were thought to promote cancer development, were found to take a significant role in diabetes 2 progression.6 Long non‐coding RNAs are non‐coding RNAs that are longer than 200 nucleotides, and many of them were demonstrated to play a pivotal role in the development and progression of many diseases including cancer.7, 8 A series of LncRNAs have been demonstrated as oncogenes and/or tumor suppressor genes.9 Furthermore, a number of recent studies suggested the involvement of LncRNAs in cancer development, including in breast cancer.10, 11 BC200 LncRNA plays an oncogenic role in estrogen‐dependent breast cancer by targeting for attenuating deregulated cell proliferation and possibly serves as a prognostic marker.12 Some of the candidate LncRNAs that are shown to be deregulated in breast cancer have the potential to be used as prognostic biomarkers.13
For breast patients with diabetes 2, it is reported there are crosslink molecular factors in serum of patient plasma between these two diseases. So to find whether there is any kind of LncRNA in these two diseases and what role it takes in disease progression became very important to understand molecular mechanism of these two diseases. H19 (H19 Imprinted Maternally Expressed Transcript) is an RNA Gene, and is affiliated with the non‐coding RNA class. Diseases associated with H19 include Wilms tumor 2 and Beckwith‐Wiedemann syndrome.14 MT‐LIPCAR (Mitochondrially Encoded Long Non‐Coding Cardiac Associated RNA) is an RNA gene and is affiliated with the non‐coding RNA class. Diseases associated with MT‐LIPCAR include congestive heart failure and myocardial infarction.15 GAS5 (growth arrest specific 5) is an RNA gene and is affiliated with the non‐coding RNA class. Diseases associated with GAS5 include inflammatory bowel disease and autoimmune disease.16 LncRNAs, E330013P06 (hereafter referred to as E33) showed that it is significantly upregulated in vivo and in vitro in macrophages under T2D conditions.17 All these four types of non‐coding RNA could be tested to upregulate in serum of some diabetic patients. So, we tested all these four types of RNA in serum of breast cancer patients with and without type 2 diabetes, and we found E33 is higher in breast cancer patients with type 2 diabetes than in those without it. Further, E33 is higher in breast cancer patients with type 2 diabetes than those healthy ones or those patients only with type 2 diabetes without breast cancer. In vitro, T47D and MDA‐MB‐231 showed E33 transfection increased cell proliferation rather than migration and invasion. E33 downregulated P53, but not other protein factors in downstream pathways. All findings above showed E33 is a long non‐coding RNA driven by diabetes that promotes development of breast cancer.
2. MATERIALS AND METHODS
2.1. Breast cancer blood sample and cell culture
Plasma samples were prepared using the blood extracted from total 105 patients and 35 healthy ones. The study was approved by ethics committee of medical faculty of the Shanxi Cancer Hospital and the First Affiliated Hospital of Shanxi Medical University, and written informed consent was taken from all included patients or their families in accordance with the Declaration of Helsinki. About 34 breast cancer patients with type 2 diabetes and another 36 breast patients without diabetes were enrolled in this research, and we collected fresh plasma samples from September 2012 to November 2013 at Shanxi Cancer Hospital. And 35 paired diabetic patients without breast cancer were enrolled as control in this research, and we collected fresh plasma samples from at the First Hospital of Shanxi Medical University. About 35 healthy people plasma samples were obtained from Medical Examination Center of Shanxi Cancer Hospital. Fresh peripheral blood samples (3 mL) were collected in EDTA tubes and then centrifuged (3000 × g for 10 minutes). Subsequently, the plasma samples were stored at −80°C.
Clinical characteristics were collected, which was individuals including age, family history, tumor differentiation, tumor‐node‐metastasis stage (TNM), lymph node status, estrogen receptor (ER), progesterone receptor (PR), and human epidermal growth factor receptor‐2 (Her2). Tumors were staged according to the tumor‐node‐metastasis (TNM) staging system of the International Union Against Cancer. There was no radiotherapy, chemotherapy, or targeted therapy prior to the operation.
2.2. cell culture
Two breast cancer cell lines (MDA‐MB‐231, T47D) purchased from Chinese Academy of Sciences. All cells were cultured in DMEM medium (RSBM) containing 10% of fetal bovine serum (FBS) (RSBM) at 37°C with 5% CO2.
2.3. Cell transfection
MDA‐MB‐231 and T47D cells were transplanted into 24‐well plates incubated 12 hours in advance, so that the confluence of the cells reached about 30%, and 1 mL of the whole culture medium was added. E330013P06 cDNA was cloned in the lentiviral expression vector pEZ‐LV105 (Kindly provided by Qihong, Fudan University) and verified by DNA sequencing. Plasmid pEZ‐LV105 expressing EGFP (LVGFP) was used as vector control. HEK293T cells were co‐transfected with lentiviral vector plasmids and three packaging plasmids. Cell culture supernatants containing lentiviruses were collected 48‐ to 96‐h post‐transfection and concentrated using Lenti‐Kit (Takara). MDA‐MB‐231 and T47D were transduced with the indicated lentiviral vectors in the presence of Polybrene (8 μg/mL), and cells resistant to puromycin (2 μg/mL) were selected for further analysis.
2.4. Reverse transcription quantitative real‐time PCR (qRT‐PCR)
Total RNAs of plasma were extracted by TRIzol reagent (Invitrogen) according to the manufacturer's instructions and stored immediately at −80°C. Then, total RNA was quantified using a Nanovue (GE). Reverse transcription (RT) reaction was performed in the Bio‐Rad C1000 PCR System (Bio‐Rad). The E33 was determined using SYBR Mix (Tiangen) via Step‐One System (Applied Biosystem). The processes of qRT‐PCR reaction were conducted in a volume of 20 μL mixed with 30 ng cDNA templates and gene‐specific primers for E3318 (forward primer 5′‐TCTTTCTCACAGGCCGCATT‐3′, reverse primer 5′‐TGATTTCTCCACGGTCAGGC‐3′), LncRNA H1919 (forward primer TGCTGCACTTTACAACCACTG, reverse primer ATGGTGTCTTTGATGTTGGGC), LncRNA LIPCAR14 (forward primer TAAAGGATGCGTAGGGATGG, reverse primer TTCATGATCACGCCCTCATA) and LncRNA GAS520 (forward primer TTTCGAGGTAGGAGTCGACTCCTGTG, reverse primer TTTTTTTTTTTTTTTTTTTGTATTGCAAA) and internal control GAPDH21 (forward primer 5′‐CTCTGCTCCTCCTGTTCGAC‐3′, reverse primer 5′‐GCGCCCAATACGACCAAATC‐3′) for each well. The data were analyzed using 2−ΔΔCt method. The experiments were conducted in triplicate, and the mean value was obtained.
2.5. Cell proliferation assay
The cells were cultured in 96‐well plates. 10 μL CCK‐8 solution (Dojindo) was added to each well and incubated for 2 hours at 37°C. The absorbance was measured at 450 nm on a microplate reader according to the manufacturer's instructions. Three multiple holes were set in each hole to calculate the proliferation rate of the two groups of cells.
2.6. Cell cycle assay
The cells were cultured in 24‐well plates for 48 hours. The cells were collected and fixed with cold 70% ethanol at −20℃ overnight. Then, the cells were washed and resuspended in cold PBS and incubated at 37°C for 30 minutes with 10 mg/mL RNase and 1 mg/mL propidium iodide (Beyotime). RNA content was detected by flow cytometry (BD). The percentage of cells at G0/G1 and S phases was analyzed using the Cell Quest acquisition software (BD Bioscience).
2.7. Transwell invasion assay
The invasion assay was performed in Transwell (Corning Incorporated) plates. The upper wells were coated with Matrigel (BD Biosciences) at 37°C for 24 hours in a 5% CO2 incubator. The cells were starved without serum for 24 hours, and then, 500 μL of cell suspension containing 5 × 10⁵ cells were seeded in the upper chamber. Culture medium supplemented with 10% FBS (750 µL) was added into the lower chamber and incubated for 48 hours. After the incubation, the cells on the upper surface were wiped with a cotton swab. The migrated cells on the lower surface were washed with PBS, fixed in with cold methanol, and stained with crystal violet. The cells that invaded to the lower surface were counted in every five high power fields (100×) under a microscope.
2.8. Cell apoptosis assay
Apoptosis was quantitated by flow cytometry after staining cells with FITC‐labeled Annexin‐V (AV) (Beyotime) and propidium iodide (PI). Cells were harvested and centrifuged at 1000g for 5 minutes; the cells were washed twice with PBS and then resuspend in 100 µL of Annexin‐V binding buffer. About 1 µL Annexin‐V and 5 µL PI were added to the samples and incubated in the dark for 15 minutes. Samples were kept on ice after incubation until FACS analysis was performed. Results were expressed as mean ± S.D (n = 3), and P < .05 was considered to be statistically significant.
2.9. Western blot assay
Protein Mycodin, KLF4, ELK‐1 and P5322, 23, 24, 25 were separated by 10% SDS‐PAGE and transferred into polyvinylidene fluoride membranes (Millipore). After blocking with 5% non‐fat milk overnight at 4°C, the membranes were incubated with rat anti‐Mycodin, anti‐KLF4, anti‐ELK‐1, and anti‐P53. Then, membranes were washed and incubated with HRP‐conjugated rabbit anti‐rat IgG as the secondary antibody. Protein bands were detected using enhanced chemiluminescence kit (ECL, Pierce).
2.10. Statistical analysis
We used Statistical Product and Service Solution (SPSS) software 18.0 (SPSS Inc) to analyze the experimental data. A paired t test was employed to evaluate LncRNAE330013P06 expression in plasma samples. By one‐way analysis of variance (ANOVA), we further evaluated the correlation between E33 levels and clinicopathologic factors of patients with diabetes. Five‐year overall survival rates for breast cancer patients with diabetes and the risk of breast cancer in diabetes also be assessed (Table 1).
Table 1.
Patients of breast cancer with diabetes (B&D), breast cancer without diabetes (B without D), diabetes (D), and healthy ones (H)
| Factor | B&D | B without D | D | H |
|---|---|---|---|---|
| Age (y) | 24 (70.6) | 24 (66.7) | 24 (68.6) | 24 (68.6) |
| <65 | 10 (29.4) | 12 (33.3) | 11 (31.4) | 11 (31.4) |
| ≥65 | ||||
| Tumor grade | ||||
| Ⅰ‐Ⅱ | 23 (66.7) | 26 (72.2) | ||
| Ⅲ | 11 (32.4) | 10 (27.8) | ||
| TNM stage | ||||
| Ⅰ | 9 (26.5) | 9 (25.0) | ||
| Ⅱ | 14 (41.2) | 14 (38.9) | ||
| Ⅲ | 8 (23.5) | 8 (22.2) | ||
| Ⅳ | 3 (8.8) | 5 (13.9) | ||
| ER status | ||||
| +++ | 10 (29.4) | 11 (30.6) | ||
| ++ | 10 (29.4) | 10 (27.8) | ||
| + | 7 (20.6) | 8 (22.2) | ||
| − | 7 (20.6) | 7 (19.4) | ||
| PR status | ||||
| +++ | 11 (32.4) | 10 (27.8) | ||
| ++ | 10 (29.4) | 10 (27.8) | ||
| + | 6 (17.6) | 9 (25.0) | ||
| − | 7 (20.6) | 7 (19.4) | ||
| Her‐2 status | ||||
| +++ | 8 (23.5) | 8 (22.2) | ||
| ++ | 6 (17.6) | 6 (16.7) | ||
| + | 6 (17.6) | 8 (22.2) | ||
| − | 14 (41.2) | 14 (38.9) | ||
| BMI | 24 ± 1.5 | 26.3 ± 2.1 | 26.2 ± 3.1 | 23.1 ± 1.2 |
| Insulin | 16 (44.4) | 16 (45.7) | ||
3. RESULTS
3.1. Upregulation of LncRNAE330013P06 in breast cancer specimens with diabetics
To confirm the higher E33 expression in breast cancer induced by diabetes, we selected four LncRNAs (H19, E33, LIPCAR, and GAS5) that have been shown to be associated with diabetes. These four LncRNAs expression was determined by qRT‐PCR in breast cancer patients with diabetes and breast cancer patients without diabetes. All RNAs were extracted from serum of blood samples. And cDNA was obtained by RT‐PCR, and then RNA was tested by real‐time PCR. Results were averaged. It was very clear that E33 was the only one overexpressed in breast cancer patients with diabetes far more than those without diabetes in four types of LncRNA, about 78% (Figure 1A).
Figure 1.
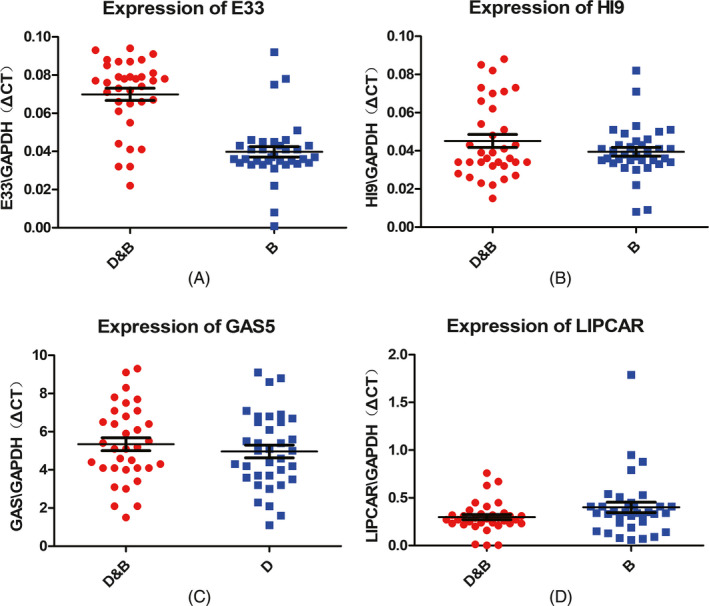
(A‐D) Relative levels of four LncRNA/GAPDH in plasma samples of breast cancer patients with diabetes (D&B) and breast cancer patients without diabetes (B). A paired t test was performed, indicate P < .001. D&B was breast cancer patients with diabetes and B was breast patients without diabetes
To investigate whether higher expression of E33 in plasma in breast cancer patients with diabetes existed in diabetic patients without breast cancer, we used a qRT‐PCR to detect the expression levels of E33 of 35 blood samples from patients who diagnosed as type 2 diabetes without breast cancer and 35 healthy people in Medical Examination Center (MEC). The results showed that E33 was highly expressed just in breast cancer patients with diabetes rather than other groups (P < .001, Figure 2) (Table 2).
Figure 2.
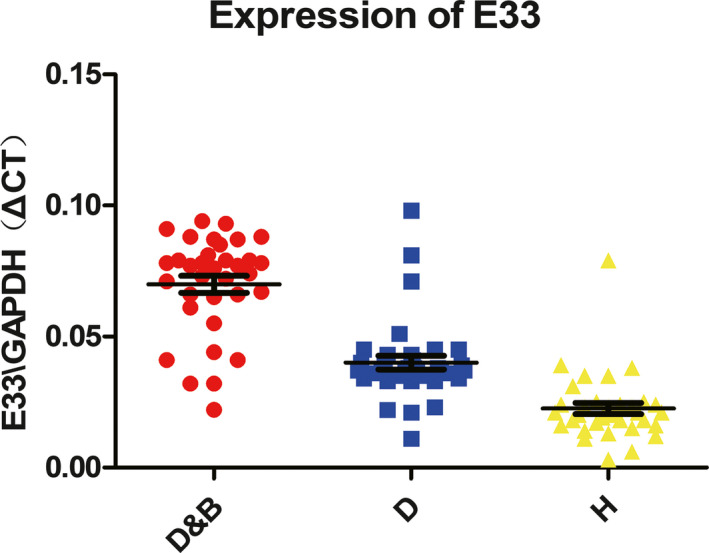
(A and B). Relative levels of E33/GAPDH in plasma samples of breast cancer patients with diabetes (D&B), diabetic patients without breast cancer (D) and healthy people (H). A paired t test was performed, indicate P < .001
Table 2.
Expression of E33 of breast cancer patients with diabetes
| Factor | D&B | E330013P06 expression |
|---|---|---|
| Family history | ||
| Absent | 28 (82.4) | 0.074 |
| Present | 6 (17.6) | 0.093 |
| TNM stage | ||
| Ⅰ | 9 (26.5) | 0.068 |
| Ⅱ | 14 (41.2) | 0.075 |
| Ⅲ | 8 (23.5) | 0.092 |
| Ⅳ | 3 (8.8) | 0.101 |
| Lymph node metastasis | ||
| 0 | 11 (32.4) | 0.082 |
| 1‐3 | 13 (38.2) | 0.067 |
| 4‐9 | 8 (23.5) | 0.094 |
| 10 | 2 (5.9) | 0.166 |
3.2. LncRNAE330013P06 high‐expression was associated with poor prognosis of breast patients with diabetes
High E33 expression was remarkably correlated with TNM stage (P = .002), lymph node metastasis (P = .015), and family history (P = .013), but not correlated with patient's age and tumor grade, as well as ER, PR, and Her2 status (P > .05). Furthermore, Kaplan‐Meier survival analysis revealed that high E33 expression was associated with low overall survival (Figure 3). In 34 breast patients with diabetes, the median follow‐up time was 51 months. About 15% cases with high E33 expression got worse in breast cancer.
Figure 3.
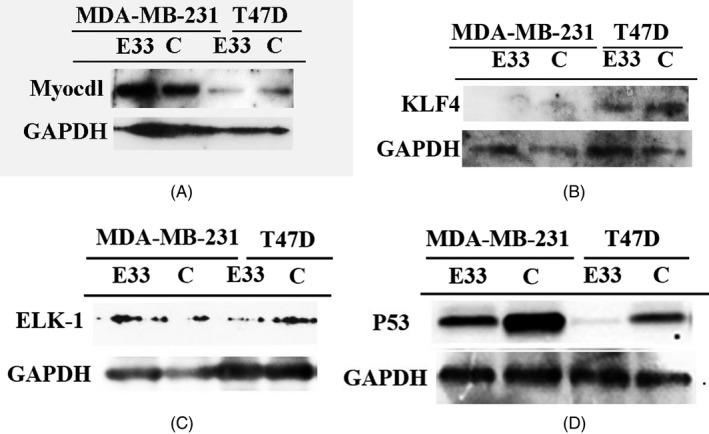
Five years of overall survival (OS) in different stage, Kaplan‐Meier survival curve
3.3. Proliferation rate of breast cancer cells slows down after gene silencing
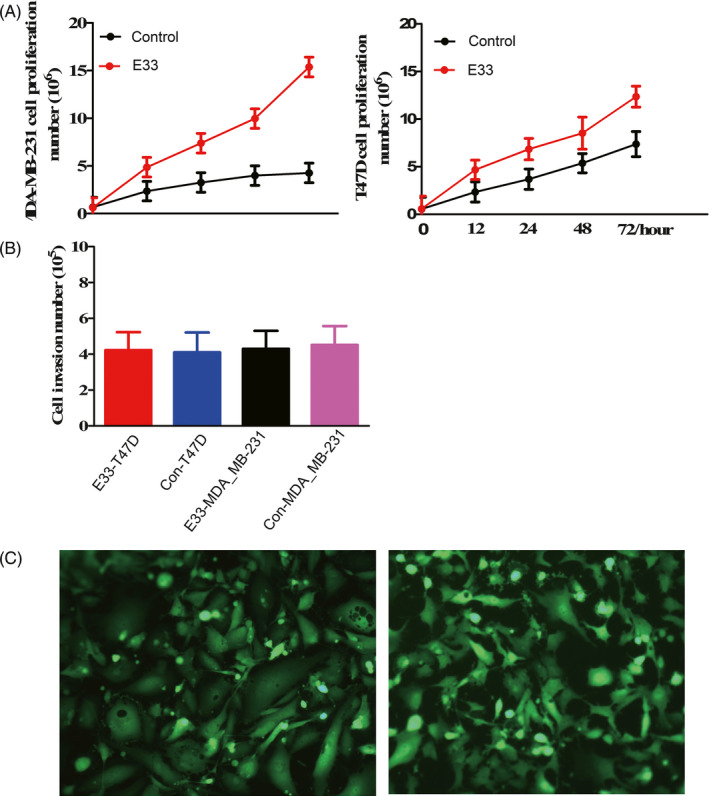
After transfection of E33, proliferation of the MDA‐MB‐231 and T47D cell cycle was measured; it was higher than that of the control. The proliferation rate of the E33 overexpression MDA‐MB‐231 cells was also higher than that of the T47D cells (Figure 4A).
Figure 4.
Proliferation (A) and invasion (B) of transfected and control breast cancer cells MDA‐MB‐231 and T47D. E33 transfection in MDA‐MB‐231 and T47D showed by EGFP in inverted fluorescent microscope (C)
These results showed E33 stimulated growth of breast cancer cells. Often, LncRNAs stimulated invasion or inhibited cell apoptosis according to past researches. But, direct transfection of E33 to breast cancer cell lines could promote cell growth.
3.4. Invasion number of breast cancer cells, cell cycle, and apoptosis of breast cancer cells associated with E33
At same time, the invasion number of the E33 overexpression MDA‐MB‐231 and T47D cells were almost same with that control, and the invasion rate did not change too much after transfection (Figure 4B).
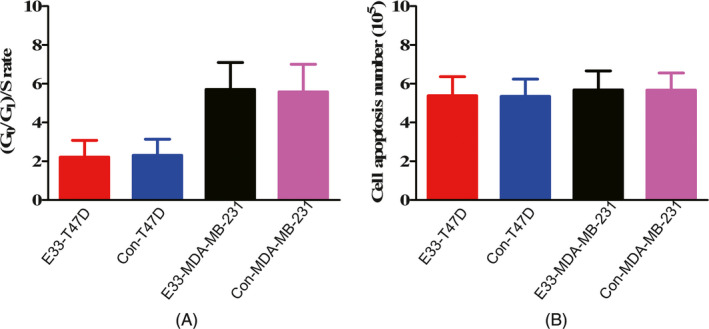
We tested cell cycles in MDA‐MB‐231 and T47D cells transfected and control cells with vector. Transfected cells led to a little higher increase in the fraction in the S phase but not very meaningful. Flow cytometry analysis showed cell apoptosis number of transfected MDA‐MB‐231 and T47D cells showed no difference with control (Figure 5B). These results revealed LncRNA E33 influenced on proliferation rather than cell apoptosis and invasion of breast cancer cells.
Figure 5.
Cell cycle (A) and apoptosis (B) in transfected and control MDA‐MB‐231 and T47D cells
3.5. E33 promote cell growth via P53
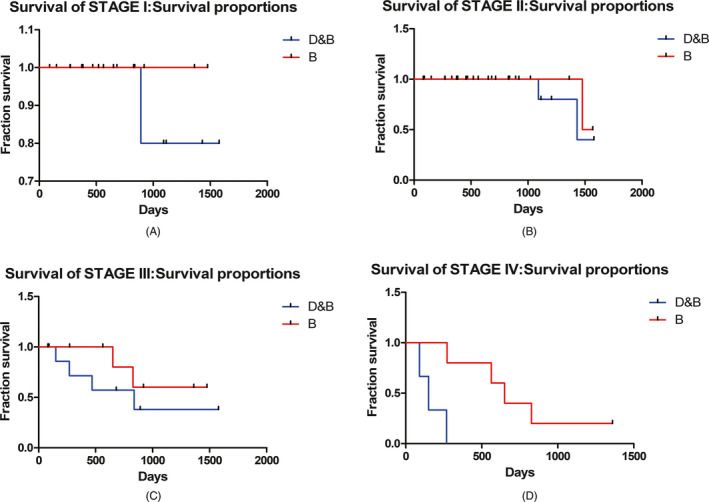
E33 is miR143/145 like long non‐coding RNA. According to past studies, expression of Myocdl, KLF4, ELK‐1, and P53 might be downstream pathways of E33 (Figure 6). So, we tested the expression of these four proteins. It is very clear with E33 transfection, only P53 was downregulated in these two cell lines (Figure 6D). To confirm these cells transfection, we take photos in inverted fluorescent microscope to ascertain its transfection efficiency (Figure 4C).
Figure 6.
E33 transfection decreases the expression of p53 in MDA‐MB‐231 and T47D cell lines (D). And E33 did not influence expression of Myocdl, KLF4, and ELK‐1(A,B and C)
The results of Western blot showed that the expression levels of P53 could be downregulated by E33. P53 pathway is the major cause of cell growth by E33.
4. DISCUSSION
With development of breast cancer research, new drugs and treatments increase overall survival (OS) of patients in past few decades. Yet, statistics showed very large amount of patients would have a lineal recurrence relation with survival period, even after 10 years, especially for those ER positive patients.26 New research finds that the diabetes drug metformin changes stem cancer cells in a way that makes them easier to target with a new form of treatment.27 Metformin showed evidenced efficacy for ER positive breast cancer after 10 years. Traditional explanation is metformin decrease BMI and estrogen from body adipose tissue, hence. But new findings render metformin could help treat triple‐negative breast cancer, which is particularly aggressive.28 Furthermore, fast mimic diet (FMD) is effective for stage IV patients of breast cancer and type 2 diabetes as well.29 All these recent findings showed how significant of crosslinks between diabetes and breast cancer.
Past researches showed that there is a crosslink between type 2 diabetes and breast cancer.18, 30, 31 But often, types of protein factors in serum were studied in past years. IGF‐1 was thought to be the most important crosslink between breast cancer and type 2 diabetes.32 But, other researches showed IGF‐1 cannot account for crosslink between breast cancer and type 2 diabetes overall. Are there other factors but not protein more crucial for cancer progression in serum for patients? Our research showed non‐coding RNA takes this role.
LncRNAE330013P06 could contribute to cell proliferation and tumorigenesis in diabetes.17 However, clinical relevance of E33 in breast cancer with type 2 diabetes remains unknown. In the present study, our results indicated that LncRNAE330013P06 expression was increased in breast patients with type 2 diabetes, plasma compared with corresponding normal plasma, plasma of breast cancer patients without diabetes, and plasma of patients with type 2 diabetes. These data combined with a previous study showed that E33 was overexpressed in breast patient plasma and promoted cell proliferation of breast cancer cells. We explored the clinical implication of E33 expression in breast patients, providing a novel perspective on preoperative predication of breast cancer. E33 expression was an independent factor of OS in breast cancer patients, and highly expressed LncRNA in diabetic patients without breast cancer may become a crucial factor in the development of breast cancer.
As we all know, breast cancer is a heterogeneous disease at the clinical characteristics and molecular level.12, 13 Long non‐coding RNA is only one of factors in cancer progression. Even long non‐coding RNA by itself is highly expressed in macrophage in blood. So, whether there is effect of long non‐coding RNA from macrophage would promote cell growth of breast cancer cell is not elucidated. But, long non‐coding RNA is very important for breast cancer patients with type 2 diabetes.
Body Mass Index is an independent factor for diabetes.3 And for Asians in United States, the risk of type 2 diabetes is very high when BMI is over 25, but for Whites, the same risk need BMI over 27. So, type 2 diabetes is extremely important factor for women with breast cancer in East Asia including Japan, Korea, Vietnam, and especially China.
E33 has been shown to upregulated in diabetes, and diabetes was a factor of induction of breast cancer. In this study, E33 expression was significantly correlated with TNM stage, lymph node metastasis, and family history, but not correlated with patient's age and tumor grade, as well as ER, PR, and Her2 status.
In conclusion, our data suggest that E33 could be serves as a biomarker and would be a crosslink in breast cancer patients and type 2 diabetes. And it needs to be researched more.
ACKNOWLEDGMENTS
This work was supported by The Applied Research Project on Nonprofit Technology of Shanxi Province (No. 2013003 Shanxi Health Bureau Funding).
Chen R, Shi P, Zhang Y, et al. Long non‐coding RNAE330013P06 promotes progression of breast cancer with type 2 diabetes. J Clin Lab Anal. 2020;34:e23172 10.1002/jcla.23172
REFERENCES
- 1. Jemal A, Bray F, Center MM, Ferlay J, Ward E, Forman D. Global cancer statistics. CA Cancer J Clin. 2011;61(2):69‐90. [DOI] [PubMed] [Google Scholar]
- 2. Polyak K. Heterogeneity in breast cancer. J Clin Invest. 2011;121:3786‐3788. [DOI] [PMC free article] [PubMed] [Google Scholar]
- 3. Wang F, Liu L, Cui S, et al. Distinct effects of body mass index and waist/hip ratio on risk of breast cancer by joint estrogen and progestogen receptor status: results from a case‐control study in northern and eastern china and implications for chemoprevention. Oncologist. 2017;22(12):1431‐1443. [DOI] [PMC free article] [PubMed] [Google Scholar]
- 4. Jiralerspong S, Palla SL, Giordano SH, et al. Metformin and pathologic complete responses to neoadjuvant chemotherapy in diabetic patients with breast cancer. J Clin Oncol. 2009;27(20):3297‐3302. [DOI] [PMC free article] [PubMed] [Google Scholar]
- 5. Hua F, Yu JJ, Hu ZW. Diabetes and cancer, common threads and missing links. Cancer Lett. 2016;374(1):54‐65. [DOI] [PubMed] [Google Scholar]
- 6. De Gonzalo‐Calvo D, Kenneweg F, Bang C, et al. Circulating long‐non coding RNAs as biomarkers of left ventricular diastolic function and remodelling in patients with well‐controlled type 2 diabetes. Sci Rep. 2016;6:37354. [DOI] [PMC free article] [PubMed] [Google Scholar]
- 7. Quinn JJ, Chang HY. Unique features of long non‐coding RNA biogenesis and function. Nat Rev Genet. 2016;17(1):47‐62. [DOI] [PubMed] [Google Scholar]
- 8. Yang Y, Jiang Y, Wan Y, et al. UCA1 functions as a competing endogenous RNA to suppress epithelial ovarian cancer metastasis. Tumour Biol. 2016;37(8):10633‐10641. [DOI] [PubMed] [Google Scholar]
- 9. Xu B, Shao Q, Xie K, et al. The long non‐coding RNAENST00000537266 and ENST00000426615 influence papillary thyroid cancer cell proliferation and motility. Cell Physiol Biochem. 2016;38(1):368‐378. [DOI] [PubMed] [Google Scholar]
- 10. Gupta RA, Shah N, Wang KC, et al. Long non‐coding RNA HOTAIR reprograms chromatin state to promote cancer metastasis. Nature. 2010;464(7291):1071‐1076. [DOI] [PMC free article] [PubMed] [Google Scholar]
- 11. Calin GA, Liu CG, Ferracin M, et al. Ultra‐conserved regions encoding ncRNAs are altered in human leukemias and carcinomas. Cancer Cell. 2007;12(3):215‐229. [DOI] [PubMed] [Google Scholar]
- 12. Singh R, Gupta SC, Peng WX, et al. Regulation of alternative splicing of Bcl‐x by BC200 contributes to breast cancer pathogenesis. Cell Death Dis. 2016;7:e2262. [DOI] [PMC free article] [PubMed] [Google Scholar]
- 13. Sorensen KP, Thomassen M, Tan Q, et al. Long non‐coding RNA expression profiles predict metastasis in lymph node‐negative breast cancer independently of traditional prognostic markers. Breast Cancer Res. 2015;17:55. [DOI] [PMC free article] [PubMed] [Google Scholar]
- 14. Zhang Z, Gao W, Long QQ, et al. Increased plasma levels of lncRNA H19 and LIPCAR are associated with increased risk of coronary artery disease in a Chinese population. Sci Rep. 2017;7(1):7491. [DOI] [PMC free article] [PubMed] [Google Scholar]
- 15. de Gonzalo‐Calvo D, Kenneweg F, Bang C, et al. Circulating long‐non coding RNAs as biomarkers of left ventricular diastolic function and remodelling in patients with well‐controlled type 2 diabetes. Sci Rep. 2016;6:37354. [DOI] [PMC free article] [PubMed] [Google Scholar]
- 16. Carter G, Miladinovic B, Patel AA, Deland L, Mastorides S, Patel NA. Circulating long noncoding RNA GAS5 levels are correlated to prevalence of type 2 diabetes mellitus. BBA Clin. 2015;4:102‐107. [DOI] [PMC free article] [PubMed] [Google Scholar]
- 17. Rajan V, Ganshan M, Jin H. Expression of circulating plasma long non‐coding RNA uc063iod. 1 and its relationship with coronary artery disease. Sci Res. 2018;8(2):131‐145. [Google Scholar]
- 18. Larsson SC, Mantzoros CS, Wolk A. Diabetes mellitus and risk of breast cancer: a meta‐analysis. Int J Cancer. 2007;121(4):856‐862. [DOI] [PubMed] [Google Scholar]
- 19. Liang WC, Fu WM, Wong CW, et al. The lncRNA H19 promotes epithelial to mesenchymal transition by functioning as miRNA sponges in colorectal cancer. Oncotarget. 2015;6(26):22513‐22525. [DOI] [PMC free article] [PubMed] [Google Scholar]
- 20. Cao S, Liu W, Li F, Zhao W, Qin C. Decreased expression of lncRNA GAS5 predicts a poor prognosis in cervical cancer. Int J Clin Exp Pathol. 2014;7(10):6776‐6783. [PMC free article] [PubMed] [Google Scholar]
- 21. Jiang H, Jiang Y, Zhang T, et al. The lncRNA TDRG1 promotes cell proliferation, migration and invasion by targeting miR‐326 to regulate MAPK1 expression in cervical cancer. Cancer Cell Int. 2019;19(1):152. [DOI] [PMC free article] [PubMed] [Google Scholar]
- 22. Cordes KR, Sheehy NT, White MP, et al. miR‐145 and miR‐143 regulate smooth muscle cell fate and plasticity. Nature. 2009;460(7256):705‐710. [DOI] [PMC free article] [PubMed] [Google Scholar]
- 23. Xu N, Papagiannakopoulos T, Pan G, Thomson JA, Kosik KS. MicroRNA‐145 regulates OCT4, SOX2, and KLF4 and represses pluripotency in human embryonic stem cells. Cell. 2009;137(4):647‐658. [DOI] [PubMed] [Google Scholar]
- 24. Sheng K, Lu J, Zhao H. ELK1‐induced upregulation of lncRNA HOXA10‐AS promotes lung adenocarcinoma progression by increasing Wnt/β‐catenin signaling. Biochem Biophys Res Commun. 2018;501(3):612‐618. [DOI] [PubMed] [Google Scholar]
- 25. Manikandan M, Deva Magendhra Rao AK, Arunkumar G, Rajkumar KS, Rajaraman R, Munirajan AK. Down regulation of miR‐34a and miR‐143 may indirectly inhibit p53 in oral squamous cell carcinoma: a pilot study. Asian Pac J Cancer Prev. 2015;16(17):7619‐7625. [DOI] [PubMed] [Google Scholar]
- 26. Dialani V, Gaur S, Mehta TS, et al. Prediction of low versus high recurrence scores in estrogen receptor–positive, lymph node–negative invasive breast cancer on the basis of radiologic‐pathologic features: comparison with oncotype DX test recurrence scores. Radiology. 2016;280(2):370‐378. [DOI] [PubMed] [Google Scholar]
- 27. Hirsch HA, Iliopoulos D, Tsichlis PN, Struhl K, et al. Metformin selectively targets cancer stem cells, and acts together with chemotherapy to block tumor growth and prolong remission. Can Res. 2009;69(19):7507‐7511. [DOI] [PMC free article] [PubMed] [Google Scholar]
- 28. Liu B, Fan Z, Edgerton SM, et al. Metformin induces unique biological and molecular responses in triple negative breast cancer cells. Cell Cycle. 2009;8(13):2031‐2040. [DOI] [PubMed] [Google Scholar]
- 29. Wei M, Brandhorst S, Shelehchi M, et al. Fasting‐mimicking diet and markers/risk factors for aging, diabetes, cancer, and cardiovascular disease. Sci Transl Med. 2017;9(377):eaai8700. [DOI] [PMC free article] [PubMed] [Google Scholar]
- 30. Liao S, Li J, Wei W, et al. Association between diabetes mellitus and breast cancer risk: a meta‐analysis of the literature. Asian Pac J Cancer Prev. 2011;12(4):1061‐1065. [PubMed] [Google Scholar]
- 31. Wolf I, Sadetzki S, Catane R, Karasik A, Kaufman B. Diabetes mellitus and breast cancer. Lancet Oncol. 2005;6(2):103‐111. [DOI] [PubMed] [Google Scholar]
- 32. Crujeiras AB, Díaz‐Lagares A, Carreira MC, Amil M, Casanueva FF. Oxidative stress associated to dysfunctional adipose tissue: a potential link between obesity, type 2 diabetes mellitus and breast cancer. Free Radical Res. 2013;47(4):243‐256. [DOI] [PubMed] [Google Scholar]


