Abstract
Background
Esophageal carcinoma (ESCA) is associated with a poor prognosis and high mortality rate. Autophagy plays important roles in promoting or suppressing tumor cell survival at different stages of cancer development. However, the roles of autophagy-related genes (ARGs) during ESCA progression and in patient prognosis remain unclear. Accordingly, in this study, we aimed to identify the relationships of ARGs with ESCA progression and patient prognosis.
Material/Methods
Clinicopathological information for patients with ESCA was downloaded from The Cancer Genome Atlas (TCGA) database. Transcriptome expression profiles were downloaded from TCGA and GTEx databases, and ARGs were downloaded from the Human Autophagy Database. We investigated the functions of ARGs by bioinformatics analysis. Moreover, statistical analysis of these genes was performed to identify independent prognostic markers.
Results
Differentially expressed genes between normal and tumor tissues were detected and identified. GO and KEGG analyses of differentially expressed ARGs were performed. Moreover, we derived a risk signature based on the identified independent prognostic markers. The identified genes also could predict the clinicopathological features of ESCA.
Conclusions
ARGs were key participants in the tumorigenesis and development of ESCA. Our findings may be useful for developing improved therapeutic approaches for ESCA.
MeSH Keywords: Autophagy, Biological Markers, Esophageal Neoplasms
Background
Autophagy is an essential cellular lysosomal degradation pathway involved in basal turnover of cell components that yields macromolecular precursors and energy [1]. Interestingly, autophagy plays opposing and context-dependent roles in some disease. For example, autophagy induced by starvation captures and degrades organelles and proteins in lysosomes, acting to protect organisms against multiple diseases, including heart disease, aging, infections, and neurodegeneration [2]. However, the prosurvival functions of autophagy may be deleterious in some experimental disease settings. Numerous studies have shown that autophagy has critical roles in cancer. In some models, autophagy inhibits tumorigenesis by limiting chronic tissue damage and oxidative stress [3]. Additionally, autophagy prevents the toxic accumulation of organelles and damaged proteins, suggesting roles in cancer prevention and inhibition of tumorigenesis. In contrast, White et al. indicated that some cancers, including melanoma and breast cancer, induce autophagy and are dependent on autophagy for survival [4]. Cancer cells maintain energy homeostasis and mitochondrial function for growth and proliferation via autophagy-mediated recycling. Moreover, autophagy inhibition may be beneficial for cancer therapy [5]. Thus, identification and analysis of autophagy-related genes (ARGs) is necessary to improve our understanding of this process.
Esophageal carcinoma (ESCA) is the sixth leading cause of cancer-related death and eighth most common cancer worldwide. Over 450,000 new cases of ESCA are diagnosed each year, and 400,000 deaths are attributed to ESCA annually [6]. The prognosis of patients with esophageal malignancies is particularly poor, and the 5-year survival is only approximately 15–25%. ESCA develops as the result of the progressive accumulation of genetic alterations and typically causes no symptoms during early stages; thus, ESCA is typically diagnosed at an advanced stage, leading to a low 5-year survival rate [7]. Patients with ESCA are generally treated with esophagectomy, immunotherapy, and chemoradiotherapy. Although these treatments have been improved in recent years, the prognosis of patients with ESCA with malignant proliferation and metastasis remains unsatisfactory [8]. Thus, the identification of disease-specific biomarkers and therapeutic targets is necessary to improve our understanding of ESCA and develop novel therapeutic approach to enhance treatment-related outcomes.
Accordingly, in this study, we examined the relationships between ARG expression and clinicopathological information in ESCA. We also identified independent prognostic genes and developed a risk signature, including microRNAs (miRNAs) and long noncoding RNAs (lncRNAs) based on this analysis. Finally, we screened for small-molecule drugs with potential therapeutic applications in the treatment of ESCA based on the identified independent prognostic genes.
Material and Methods
ESCA datasets
Transcriptome expression profiles and corresponding clinical information for patients with ESCA (including 160 tumor samples and 11 normal samples) were downloaded from The Cancer Genome Atlas (TCGA) database, a publically funded cancer genomics database containing over 2.5 petabytes of genomic, epigenomic, transcriptomic, and proteomic data for 33 cancer types and matched normal samples. Transcriptome data from 653 normal samples were downloaded from the Genotype-Tissue Expression (GTEx) database, which was established to explore the correlations between human genetic variation and tissue-specific gene expression in nondiseased individuals.
Selection of ARGs
Human Autophagy Database (HADb, http://www.autophagy.lu/) is a publically funded database containing structural and functional information for ARGs. In this study, we downloaded a list of 234 ARGs from the HADb database.
Detection of differentially expressed ARGs
All transcriptome expression profiles for ESCA were merged and normalized, and we obtained 824 samples (160 tumor samples and 664 normal samples) for analysis. Differentially expressed ARGs between tumor and normal samples were searched using the R package “limma” with the following cut-off criteria: P<0.05, |logFC| >1.
Construction of a protein-protein interaction (PPI) network
PPI networks play critical roles in many biological processes and functions and are viable tools for elucidating cell functions, disease machinery, and drug design/repositioning. We used the web-based database STRING (http://string-db.org) to construct a PPI network after importing differential expressed ARGs. Cytoscape software, a free open-source platform that enables biological network analysis and two-dimensional visualization for biologists, was used for PPI network analyses.
Enrichment analysis of differentially expressed ARGs
The Kyoto Encyclopedia of Genes and Genomes (KEGG; http://www.genome.jp) database is a knowledge base for systematic analysis of gene functions, linking genomic information with higher-order functional information. The Gene Ontology (GO) database is a freely available resource that describes how and where gene products function in biological systems. Gene set enrichment analysis (GSEA) is a computational method that assesses gene expression data and provides many biological pathways. Metascape (http://metascape.org/gp/index.html) is a web-based database that facilitates comprehensive gene list annotation and analysis. In this study, enrichment analysis of differentially expressed ARGs was performed using GSEA and Metascape with GO and KEGG databases.
Prognostic value of differentially expressed ARGs
Univariate Cox regression analyses were performed to identify differentially expressed ARGs that were significantly associated with overall survival (OS). Multivariate Cox regression analysis was employed to identify genes that could act as independent indicators of prognosis. Using these analyses, we obtained several central ARGs and calculated the risk score for the signature using the following formula:
where Coefi is the coefficient, and xi is the z-score-transformed relative expression value of each selected gene. Patients were separated into high- and low-risk groups according to the median risk score.
Statistical analysis
All statistical analyses were conducted using R software (version 3.5.0), GraphPad Prism 7 (San Diego, CA, USA), and SPSS 20.0 (Chicago, IL, USA). The distribution of clinicopathological parameters between the high- and low-risk groups was compared using Chi-square tests. T-tests and one-way analysis of variance were performed to compare the risk scores in patients grouped according to clinicopathological characteristics and molecular pathological characteristics. Univariate and multivariate Cox regression analyses were performed to determine the prognostic value of the risk score. The R package “survivalROC” was employed to analyze prediction efficiency. The OS of the patients was compared using the Kaplan-Meier method with two-sided log-rank tests.
Identification of independent prognostic ARGs
The Comparative Toxicogenomics Database (CTD; http://ctdbase.org/) is a web-based database that provides information regarding the interactions between chemicals and gene products and describes their relationships to diseases. In this study, we validated the independent prognostic ARGs using the CTD database.
Detection of miRNAs and lncRNAs that regulate independent prognostic genes
TargetScan (www.targetscan.org) is a widely used database that can predict biological targets of miRNAs. StarBase v2.0 (http://starbase.sysu.edu.cn/) can predict the biological targets of lncRNAs. In this study, miRNAs and lncRNAs that may regulate the identified independent prognostic genes were screened out using TargetScan and StarBase.
Enrichment analysis of miRNAs
DIANA TOOLS (http://diana.imis.athena-innovation.gr/DianaTools/index.php) is a miRNA pathway analysis web server that provides accurate statistics and can accommodate advanced pipelines. In this study, GO and KEGG enrichment analyses of miRNAs that regulated prognostic genes were performed using DIANA TOOLS.
Identification of candidate small-molecule drugs
Connectivity map (CMap) is a web-based database that connects human diseases with underlying genes and targeted drugs. In this study, CMap was employed to identify small-molecule drugs that regulated genes associated with prognosis in ESCA.
Evaluation of the prognostic value of independent prognostic genes
OSecc database (bioinfo.henu.edu.cn/DBList.jsp) is a web-based interactive survival analysis tool that can be used to assess OS in patients with cancer [9]. In this study, the OSecc database was employed to evaluate the prognostic value of independent prognostic genes in ESCA.
Results
Detection of differentially expressed ARGs
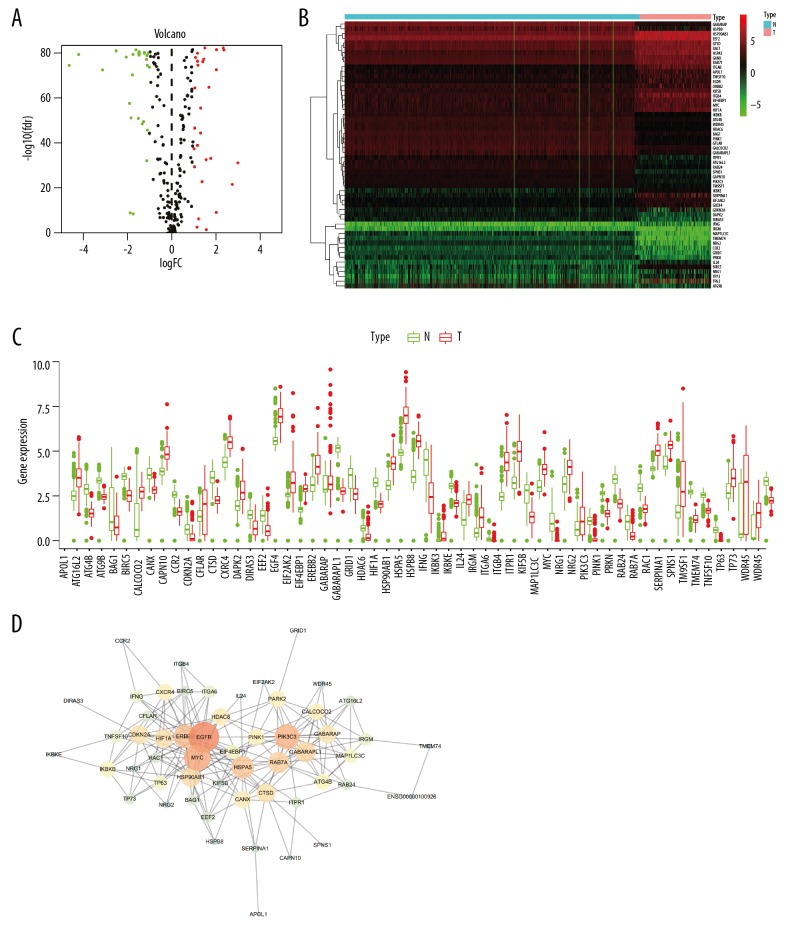
First, we downloaded and re-analyzed transcriptional profiles of 160 tumor samples and 664 normal samples from TCGA and GTEx databases. The expression levels of 234 ARGs were detected. In total, 56 differentially expressed genes (including 28 upregulated genes and 28 downregulated genes) were obtained (Figure 1A, 1C). The genes are listed in Table 1, and a heatmap of these genes is shown in Figure 1B.
Figure 1.
Autophagy-related genes (ARGs) were differentially expressed between ESCA tissues and normal tissues. (A) Volcano plots of ARGs in esophageal cancer. Red: upregulated, green: downregulated. (B) Heat maps of ARGs in esophageal cancer. (C) Boxplot of ARGs in esophageal cancer. (D) Protein-protein interaction (PPI) network of differentially expressed ARGs. The number of connections indicates the importance of the protein in the PPI network.
Table 1.
A summary of differently expressed ARGs in esophageal cancer.
| Gene symbol | |||||
|---|---|---|---|---|---|
| Up-regular | SERPINA1 | IFNG | ITGA6 | HSP90AB1 | HSPA5 |
| ITGB4 | TP63 | IL24 | BIRC5 | ERBB2 | |
| EGFR | EIF2AK2 | EEF2 | HIF1A | TP73 | |
| EIF4EBP1 | APOL1 | NRG1 | CTSD | CANX | |
| CXCR4 | RAB7A | CDKN2A | RAC1 | KIF5B | |
| MYC | TNFSF10 | IKBKE | |||
| Down-regular | CALCOCO2 | ATG4B | IKBKB | GABARAPL1 | |
| TM9SF1 | CCR2 | BAG1 | CAPN10 | ||
| WDR45 | DAPK2 | DIRAS3 | HDAC6 | ||
| PIK3C3 | RAB24 | CFLAR | GRID1 | ||
| PINK1 | IRGM | ATG16L2 | ITPR1 | ||
| PRKN | ATG9B | HSPB8 | SPNS1 | ||
| GABARAP | NRG2 | TMEM74 | MAP1LC3C | ||
Construction of a PPI network
A PPI network of differentially expressed ARGs was constructed using the STRING online database and Cytoscape software (Figure 1D). The identified PPI network of differentially expressed ARGs consisted of 56 nodes and 337 edges. The top 3 connections for proteins were for epidermal growth factor receptor, MYC, and phosphatidylinositol 3-kinase Catalytic subunit type 3, suggesting that these proteins may have pivotal roles in the occurrence or progression of ESCA.
Enrichment analysis of differentially expressed ARGs
GO and KEGG analyses of the 56 differentially expressed ARGs was performed by Metascape and GSEA in order to improve our understanding of the biological functions of these genes in ESCA.
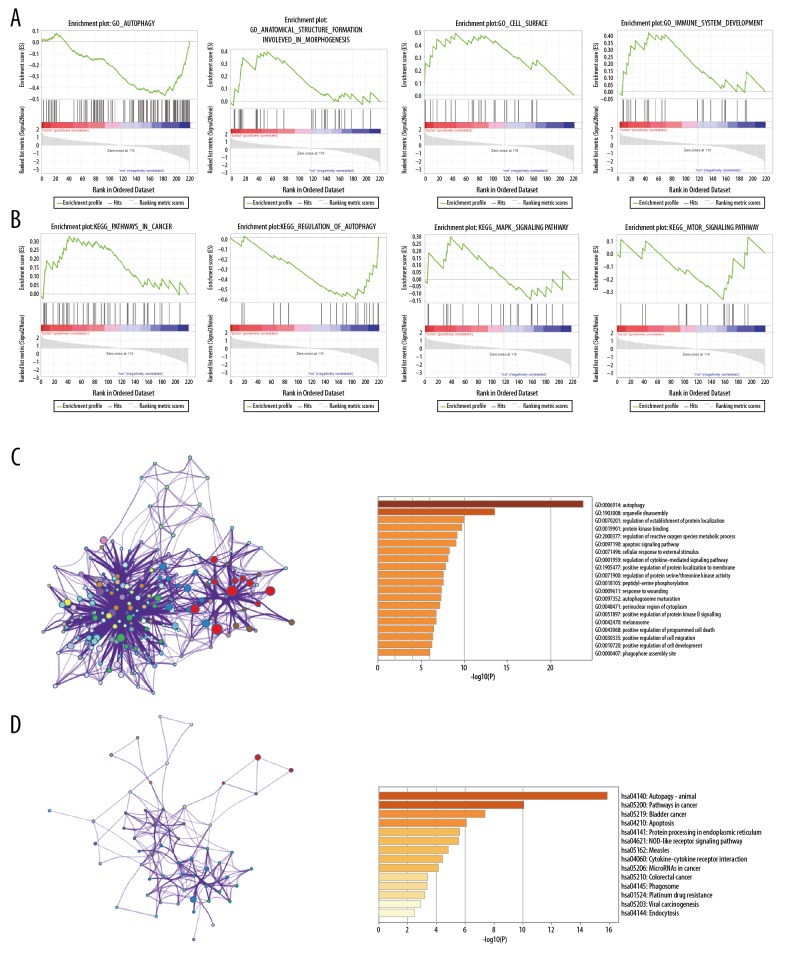
Using GSEA, GO enrichment analysis of differentially expressed ARGs identified genes involved in autophagy, anatomical structure formation involved in morphogenesis, cell surface, and immune system development (Figure 2A). The enrichment results of KEGG analysis included genes involved in pathways in cancer, regulation of autophagy, the mitogen-activated protein kinase (MAPK) signaling pathway and mammalian target of rapamycin signaling pathway (Figure 2B). Moreover, using Metascape, GO enrichment analysis of differentially expressed ARGs identified genes involved in autophagy, organelle disassembly, and regulation of protein localization (Figure 2C).
Figure 2.
Gene functional enrichment analysis of ARGs. (A) Gene ontology (GO) analyses of ARGs by GSEA. (B) Kyoto Encyclopedia of Genes and Genomes (KEGG) analyses of ARGs by GSEA. (C) GO analyses of ARGs by Metascape. (D) KEGG analyses of ARGs by Metascape.
Using Metascape, the enrichment results of KEGG analysis of differentially expressed ARGs included genes involved in autophagy-animal, pathways in cancer, bladder cancer, apoptosis, protein processing in endoplasmic reticulum, NOD-like receptor signaling pathway, and measles (Figure 2D). Both GSEA and Metascape identified genes enriched in “pathways in cancer” for KEGG analysis, suggesting the important roles of these ARGs in tumorigenesis.
Identification of prognostic genes
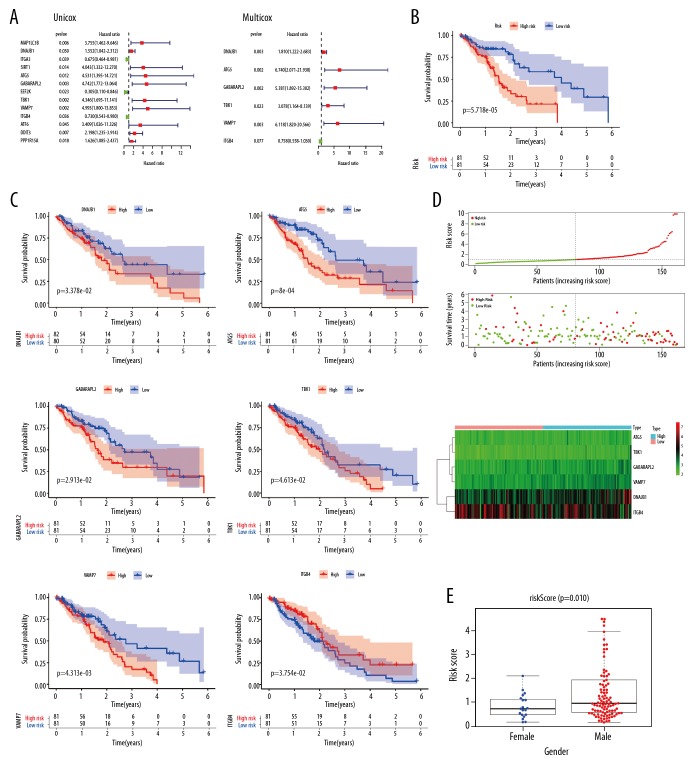
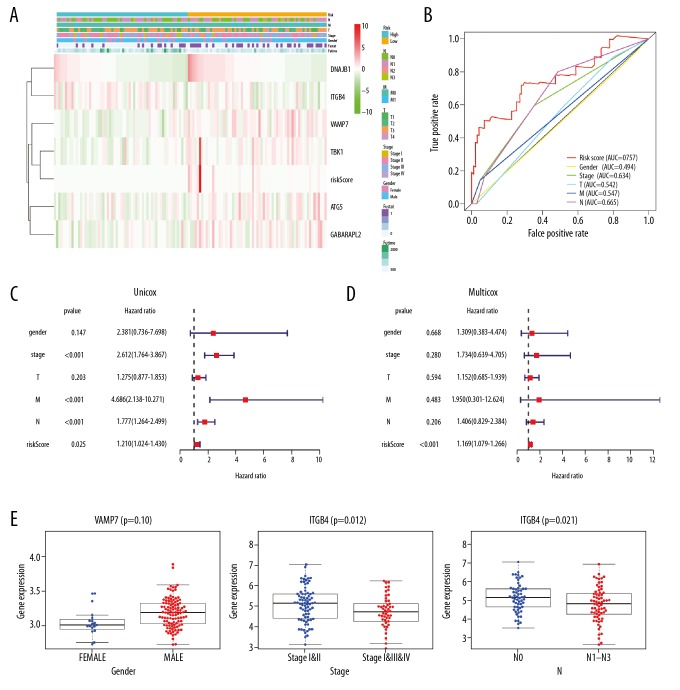
In this study, univariate Cox regression analyses were performed to explore the expression profiles of 56 differentially expressed ARGs, identifying 13 prognosis-related ARGs (Figure 3A). To confirm these findings, prognosis-related ARGs were selected using SPSS software for additional multivariate Cox regression models (Figure 3A). We found that DNAJB1, ATG5, GABARAPL2, TBK1, VAMP7, and ITGB4 had significant prognostic value (Table 2). Based on the median expression values of these genes, Kaplan-Meier analyses were performed to explore the relationships between these genes and OS in patients with ESCA. The results showed that upregulation of DNAJB1, ATG5, GABARAPL2, TBK1, and VAMP7 and downregulation of ITGB4 was closely related to the poor OS of patients with ESCA (Figure 3C). Next, a risk score was constructed based on these genes. According to the median risk score, patients with ESCA were divided into high- and low-risk groups, and Kaplan-Meier plots indicated that the survival rates of patients in the high-risk group were significantly worse than those in the low-risk group (Figure 3B). After adjustment of clinicopathological features in univariate and multivariate analysis, the risk score could still be used as an independent prognostic indicator (Figure 4C, 4D). The risk score distributions in patients with ESCA, numbers of patients in different risk groups, and heat maps of 6 genes and OS in patients are shown in Figure 3D. Assessment of the predictive value of the risk score for the prognosis of patients with ESCA via receiver operating characteristic curve analysis showed that the area under the curve of the risk score was 0.757 (Figure 4B).
Figure 3.
Establishment of a prognostic index model for ARGs. (A) Univariate and multivariate Cox regression analyses of ARGs. (B) Kaplan-Meier curves of risk scores. (C) Kaplan-Meier curves of prognostic genes. (D) Risk plot of ARGs. (E) Boxplots of risk scores related to clinical trials.
Table 2.
A summary of prognostic genes.
| Gene symbol | Description | Gene summary |
|---|---|---|
| DNAJB1 | DnaJ heat shock protein family (Hsp40) member B1 | GO: 0097201 negative regulation of transcription from RNA polymerase II promoter in response to stress; GO: 0090084 negative regulation of inclusion body assembly; GO: 0090083 regulation of inclusion body assembly |
| ATG5 | autophagy related 5 | GO: 2000619 negative regulation of histone H4-K16 acetylation; GO: 0090241 negative regulation of histone H4 acetylation; GO: 2000618 regulation of histone H4-K16 acetylation |
| GABARAPL2 | GABA type A receptor associated protein like 2 | GO: 1901799 negative regulation of proteasomal protein catabolic process; GO: 0006995 cellular response to nitrogen starvation; GO: 1903051 negative regulation of proteolysis involved in cellular protein catabolic process |
| TBK1 | TANK binding kinase 1 | GO: 0035666 TRIF-dependent toll-like receptor signaling pathway; GO: 0045359 positive regulation of interferon-beta biosynthetic process; GO: 1904417 positive regulation of xenophagy |
| VAMP7 | vesicle associated membrane protein 7 | GO: 1903595 positive regulation of histamine secretion by mast cell; GO: 1900483 regulation of protein targeting to vacuolar membrane; GO: 1903593 regulation of histamine secretion by mast cell |
| ITGB4 | integrin subunit beta 4 | GO: 0031581 hemidesmosome assembly; GO: 0035878 nail development; GO: 0097186 amelogenesis |
Figure 4.
Verification of the accuracy of the prognostic index model for ARGs. (A) Risk-clinical heatmap of esophageal cancer datasets. (B) Multi-ROC curve of clinical trials. (C) Univariate independent prognostic analysis. (D) Multivariate independent prognostic analysis. (E) Analysis of the clinical relevance of VAMP7 and ITGB4.
The associations between risk score and clinicopathological parameters were explored by independent sample t-tests, and the results showed that the risk score was higher in men than women (Figure 3E).
Heatmap analysis of the expression levels of 6 genes with significant prognostic value in the high- and low-risk groups in TCGA dataset is shown in Figure 4A. The results of independent sample t-tests indicated that high expression of VAMP7 was significantly correlated with male sex (P=0.01) and that low expression of ITGB4 was significantly correlated with advanced pathological stage (P=0.012) and advanced pathological N stage (P=0.021; Figure 4E).
Identification of independent prognostic ARGs
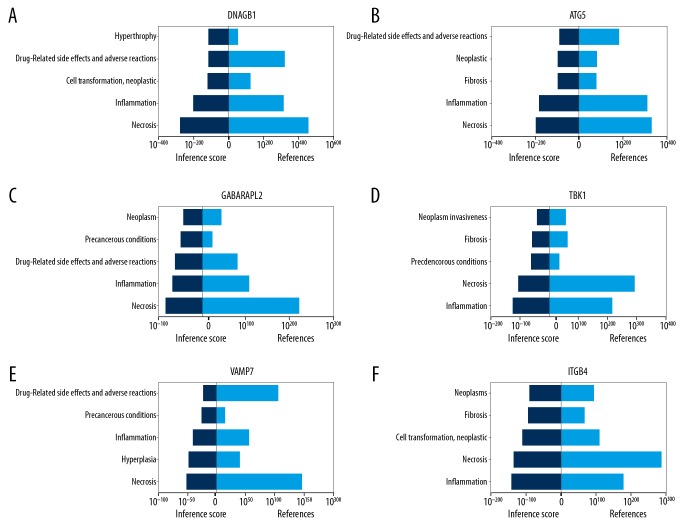
The CTD database showed that hub genes targeted the tumor system (Figure 5). The results of the analysis identified 13 distinct diseases with statistical significance (P<0.05), including neoplasms, cell transformation, neoplastic transformation, and neoplasm invasiveness. Interestingly, we also found that these genes were closely related to inflammation, fibrosis, and hyperplasia.
Figure 5.
Verification of the identified genes using the CTD database. (A) DNAJB1. (B) ATG5. (C) GABARAPL2. (D) TBK1. (E) VAMP7. (F) ITGB4.
Detection of miRNAs and lncRNAs regulating independent prognostic genes
Because miRNAs and lncRNAs regulate gene expression, we evaluated the effects of miRNAs and lncRNAs on the independent prognostic genes identified in this study. MiRNAs that regulate these genes are shown in Table 3, and lncRNAs that regulate these genes are shown in Table 4. Our results identified the miRNAs and lncRNAs with the lowest P values as potential mediators of ESCA.
Table 3.
A summary of miRNAs that regulate hub genes.
| Gene | Predicted MiR | Gene | Predicted MiR | ||
|---|---|---|---|---|---|
| 1 | DNAJB1 | hsa-miR-455-3p.1 | 4 | TBK1 | hsa-miR-19b-3p |
| hsa-miR-500b-5p | hsa-miR-19a-3p | ||||
| hsa-miR-362-5p | hsa-miR-365b-3p | ||||
|
| |||||
| 2 | ATG5 | hsa-miR-30a-5p | 5 | VAMP7 | hsa-miR-411-5p.2 |
| hsa-miR-30d-5p | hsa-miR-29b-3p | ||||
| hsa-miR-30e-5p | hsa-miR-29c-3p | ||||
|
| |||||
| 3 | GABARAPL2 | hsa-miR-145-5p | 6 | ITGB4 | hsa-miR-409-5p |
| hsa-miR-5195-3p | hsa-miR-9-5p | ||||
| hsa-miR-455-3p.1 | hsa-miR-372-3p | ||||
Table 4.
A summary of lncRNAs that regulate prognostic genes.
| Gene | Predicted lncRNA | Gene | Predicted lncRNA | ||
|---|---|---|---|---|---|
| 1 | DNAJB1 | linc1457 | 4 | TBK1 | linc1457 |
| linc1558 | linc1589 | ||||
| SLC25A25-AS1 | linc1614 | ||||
|
| |||||
| 2 | ATG5 | NORAD | 5 | VAMP7 | linc1470 |
| NRCP | linc1589 | ||||
| linc1400 | Blnc1 | ||||
|
| |||||
| 3 | GABARAPL2 | Linc-RAM | 6 | ITGB4 | linc1631 |
| Lhx1os | SLC25A25-AS1 | ||||
| lincMTX2 | lnc-OPC | ||||
GO and KEGG analyses of miRNAs regulating the independent prognostic genes identified in this study
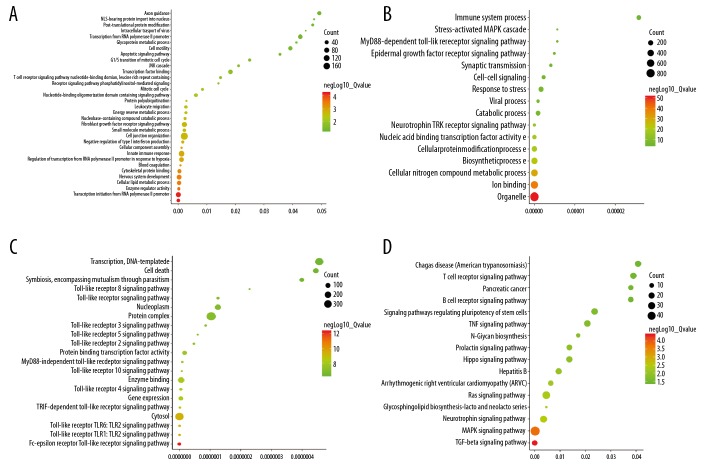
Function and pathway enrichment analyses of miRNAs are shown in Figure 6. GO annotations of biological processes (BPs), cellular components (CCs), and molecular functions (MFs) revealed that miRNAs were enriched in 33 BPs, including transcription initiation from RNA polymerase, enzyme regulator activity, and cellular lipid metabolic processes (Figure 6A); various CCs, including organelles, ion binding, and cellular nitrogen compound metabolic processes (Figure 6B); and several MFs, including the Fc-epsilon receptor signaling pathway, Toll-like receptor 2 signaling pathway, and cytosol (Figure 6C). KEGG pathway analysis identified 16 highly enriched pathways, including the transforming growth factor-β signaling, MAPK, and neurotrophin signaling pathways (Figure 6D).
Figure 6.
Function and pathway enrichment analyses of miRNAs that regulate prognostic genes. (A) BP analyses (B) CC analyses. (C) MF analyses. (D) KEGG analyses of the miRNAs.
Identification of candidate small-molecule drugs for treating ESCA
CMap database analysis was used to screen out small-molecule drugs for ESCA. The identified molecules, which met the cut-off criteria (number of instances >2 and P value <0.05) are listed in Table 5.
Table 5.
A summary of connectivity map that regulate prognostic genes in esophageal cancer.
| cmap name | Mean | n | Enrichment | p |
|---|---|---|---|---|
| 1 eucatropine | −0.581 | 6 | −0.909 | 0 |
| 2 thioperamide | 0.673 | 5 | 0.886 | 0.00006 |
| 3 pyrantel | −0.529 | 5 | −0.847 | 0.00024 |
| 4 nadide | 0.53 | 4 | 0.83 | 0.00127 |
| 5 bacitracin | 0.653 | 3 | 0.861 | 0.00495 |
| 6 betamethasone | 0.582 | 3 | 0.859 | 0.00531 |
Prognostic value of the identified independent prognostic genes
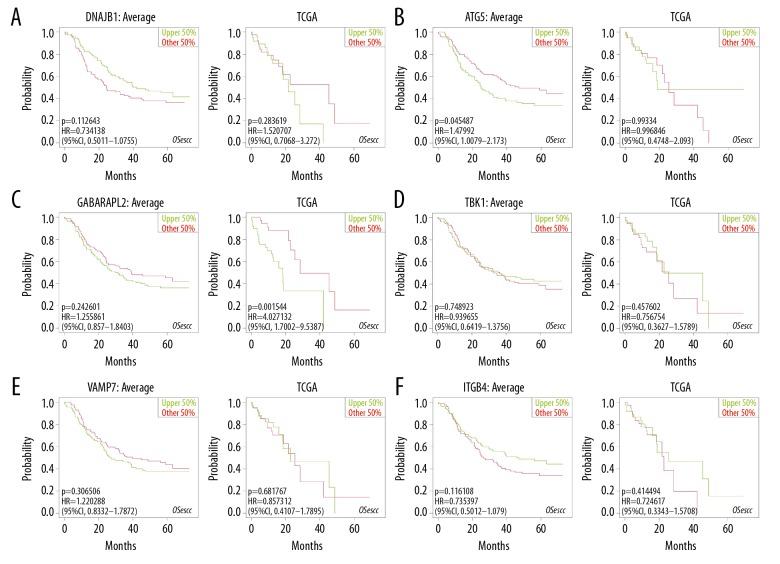
The relationships between the expression profiles of 6 independent prognostic genes and OS were assessed based on the OSecc database. For data from GEO database, downregulation of DNAJB1 was strongly correlated with poor OS in patients with ESCA (Figure 7A), and ATG5 overexpression reduced OS (Figure 7B). For data from TCGA database, upregulation of GABARAPL2 was associated with shorter patient survival (Figure 7C). Other genes that P value <0.05 were shown in Figure 7D–7F.
Figure 7.
Prognostic value of independent prognostic genes assessed using the OSecc database. (A) DNAJB1. (B) ATG5. (C) GABARAPL2. (D) TBK1. (E) VAMP7. (F) ITGB4.
Discussion
ESCA is an aggressive cancer associated with poor survival [6,10] and a relatively high incidence worldwide [11]. Although the specific causes of ESCA are unclear, various risk factors, including smoking, alcohol consumption, and gastroesophageal reflux disease, are known to influence the development of the disease [8]. Despite advances in the treatment of ESCA, the prognosis of this disease has not improved, and few prognostic markers for ESCA are available in clinical practice. Thus, it is necessary to explore novel prognostic markers and additional new targets for the diagnosis and treatment of ESCA.
Autophagy is a cellular “self-eating” process that plays dual roles in cancer. Indeed, autophagy has suppressive roles in the early stage of tumorigenesis; however, the roles of autophagy in the early stages of hepatocellular carcinoma are controversial and complex [12]. Moreover, autophagy is required to modulate the expression of TP53, which plays key roles in the maintenance of cancer stem cells [13]. Furthermore, autophagy can promote tumor metastasis and provides energy to cancer cells, thereby improving their survival ability and promoting outward migration [14]. Thus, exploration of autophagy may improve responses of cancer cells to treatments and provide novel targeted therapies for ESCA. Accordingly, in this study, we identified key prognostic ARGs in patients with ESCA; this information could be beneficial for treatment in these patients.
Owing to the high throughput capability and low cost of next-generation sequencing, bioinformatics analysis has been employed to explore and identify clinically significant biomarkers and potential targets of some disease [15], resulting in the development of many public databases, such as TCGA and GEO databases. In this study, the transcriptome expression profiles and corresponding clinical information for patients with ESCA were downloaded from TCGA and GTEx databases, yielding 56 differentially expressed ARGs between tumor and normal samples. GO and KEGG analyses identified the potential molecular mechanisms and connection between genes. Notably, the KEGG analysis by Metascape showed enrichment in platinum drug resistance. Thus, we hypothesized that differentially expressed ARGs may play key roles in drug resistance in ESCA. Indeed, studies have shown that autophagy promotes cancer cell survival during chemotherapy by providing nutrients and energy to cancer cells [16]. Zhang et al. found that the autophagic flux of cancer cells increased under treatment with chemotherapeutic drugs [17]. Thus, the combination of autophagy modulation and other therapies may be a promising therapeutic strategy for ESCA. Moreover, KEGG analysis by Metascape and GSEA showed enrichment in pathways in cancer, emphasizing the important involvement of ARGs in tumorigenesis.
In this study, 6 independent prognostic ARGs (DNAJB1, ATG5, GABARAPL2, TBK1, VAMP7, and ITGB4) were identified. DNAJB1 (encoding DnaJ heat shock protein family member B1) can promote protein folding and prevent misfolded protein aggregation. Interestingly, DNAJB1 inhibits the degradation and ubiquitination of p53, thereby modulating cancer cell growth in vitro and vivo [18]. Moreover, Yoon et al. showed that DNAJB1 knockdown is associated with apoptosis in lung cancer [19]. However, the roles of this protein in ESCA are unknown.
ATG5 (encoding autophagy-related 5) is involved in several cellular processes, including innate antiviral immune responses, lymphocyte development and proliferation, adipocyte differentiation, and apoptosis. ATG5 is presumably associated with recurrence of triple-negative breast cancer (TNBC) and may be a potential marker for predicting recurrence in patients with early stage TNBC receiving an anthracycline and/or taxane adjuvant chemotherapy regimen [20]. Moreover, ATG5 promotes the migration and metastasis of breast cancer cells in vitro [21]. Thus, ATG5 may be a potential marker for predicting recurrence in ESCA.
GABARAPL2 (encoding GABA type A receptor associated protein like 2) is an ATG8 protein that is intimately associated with the autophagosome membrane, which is involved in cancer progression [22].
TBK1 (encoding TANK binding kinase 1) encodes a protein that is similar to IκB kinases and can mediate nuclear factor-κB activation in response to certain growth factors. TBK1 is upregulated in bladder cancer tissue and cell lines, and knockdown of TBK1 inhibits cell migration [23]. Additionally, treatment with TBK1 limits KRAS-driven pancreatic dysplasia [24]. Thus, TBK1 may be potential biomarker for ESCA.
VAMP7 (encoding vesicle associated membrane protein 7) encodes a transmembrane protein involved in the fusion of transport vesicles to their target membranes. Blocking the function of VAMP7 disrupts extracellular matrix degradation and limits cancer cell invasion [25]. Coppolino et al. also showed that inhibiting VAMP7 function reduces cell migration and invasion [26]. Thus, VAMP7 may be a potential therapeutic target for ESCA.
ITGB4 (encoding integrin subunit beta 4) encodes a protein that mediates cell-matrix or cell-cell adhesion and transduces signals to regulate gene expression and cell growth. Importantly, overexpression of ITGB4 promotes the epithelial-to-mesenchymal transition and enhances proliferation in cancer cells in vitro [27].
With the development of large-scale public databases, some prognostic features of cancer based on expression profiling have been proposed. For example, Gao et al. detect differentially expressed lncRNAs in lung cancer based on the GEO database [28]. Additionally, Zhao et al. explored potential target genes involved in the pathogenesis of esophageal squamous cell carcinoma [29]. However, these studies focused only on molecular biomarkers, ignoring traditional clinical parameters. In our study, we focused on clinical parameters and molecular mechanisms in order to connect prognostic features with clinical applications.
This study had some limitations. First, ESCA is comprised of 2 main histopathological types, i.e., esophageal squamous cell carcinoma and esophageal adenocarcinoma. The samples evaluated in this study included both esophageal squamous cell carcinoma and esophageal adenocarcinoma. Additionally, our survival analysis included data for all types of ESCA. Therefore, in future studies, it will be necessary to perform similar analyses based on subgroup classification of ESCA into squamous cell carcinoma and adenocarcinoma.
Conclusions
In this study, we evaluated transcriptome expression profiles and corresponding clinical information for patients with ESCA and obtained a list of ARGs from online databases. We found that 6 key prognostic ARGs (DNAJB1, ATG5, GABARAPL2, TBK1, VAMP7, and ITGB4) may be potential therapeutic targets in ESCA. Moreover, we constructed a novel risk score model based on the expression levels of these genes to predict survival in patients with ESCA. Finally, we explored small-molecule drugs targeting these ARGs using the CMap database. These findings provide insights into the development of novel therapeutic strategies for this aggressive disease.
Footnotes
Source of support: This work was financed by the Scientific and Technological Projects of Hebei Provincial Health Committee (grant no. 20180573)
References
- 1.Gomes LR, Menck C, Leandro GS. Autophagy roles in the modulation of DNA repair pathways. Int J Mol Sci. 2017;18(11) doi: 10.3390/ijms18112351. pii: E2351. [DOI] [PMC free article] [PubMed] [Google Scholar]
- 2.Ravanan P, Srikumar IF, Talwar P. Autophagy: The spotlight for cellular stress responses. Life Sci. 2017;188:53–67. doi: 10.1016/j.lfs.2017.08.029. [DOI] [PubMed] [Google Scholar]
- 3.Li YJ, Lei YH, Yao N, et al. Autophagy and multidrug resistance in cancer. Chin J Cancer. 2017;36(1):52. doi: 10.1186/s40880-017-0219-2. [DOI] [PMC free article] [PubMed] [Google Scholar]
- 4.Amaravadi R, Kimmelman AC, White E. Recent insights into the function of autophagy in cancer. Genes Dev. 2016;30(17):1913–30. doi: 10.1101/gad.287524.116. [DOI] [PMC free article] [PubMed] [Google Scholar]
- 5.Parzych KR, Klionsky DJ. An overview of autophagy: Morphology, mechanism, and regulation. Antioxid Redox Signal. 2014;20(3):460–73. doi: 10.1089/ars.2013.5371. [DOI] [PMC free article] [PubMed] [Google Scholar]
- 6.Esophageal Cancer: What You Should Know. Am Fam Physician. 2017;95(1) Online. [PubMed] [Google Scholar]
- 7.Huang FL, Yu SJ. Esophageal cancer: Risk factors, genetic association, and treatment. Asian J Surg. 2018;41(3):210–15. doi: 10.1016/j.asjsur.2016.10.005. [DOI] [PubMed] [Google Scholar]
- 8.Kato H, Nakajima M. Treatments for esophageal cancer: A review. Gen Thorac Cardiovasc Surg. 2013;61(6):330–35. doi: 10.1007/s11748-013-0246-0. [DOI] [PubMed] [Google Scholar]
- 9.Wang Q, Wang F, Lv J, et al. Interactive online consensus survival tool for esophageal squamous cell carcinoma prognosis analysis. Oncol Lett. 2019;18(2):1199–206. doi: 10.3892/ol.2019.10440. [DOI] [PMC free article] [PubMed] [Google Scholar]
- 10.Short MW, Burgers KG, Fry VT. Esophageal cancer. Am Fam Physician. 2017;95(1):22–28. [PubMed] [Google Scholar]
- 11.Domper Arnal MJ, Ferrandez Arenas A, Lanas Arbeloa A. Esophageal cancer: Risk factors, screening and endoscopic treatment in Western and Eastern countries. World J Gastroenterol. 2015;21(26):7933–43. doi: 10.3748/wjg.v21.i26.7933. [DOI] [PMC free article] [PubMed] [Google Scholar]
- 12.Huang F, Wang BR, Wang YG. Role of autophagy in tumorigenesis, metastasis, targeted therapy and drug resistance of hepatocellular carcinoma. World J Gastroenterol. 2018;24(41):4643–51. doi: 10.3748/wjg.v24.i41.4643. [DOI] [PMC free article] [PubMed] [Google Scholar]
- 13.Liu K, Lee J, Ou JJ. Autophagy and mitophagy in hepatocarcinogenesis. Mol Cell Oncol. 2018;5(2):e1405142. doi: 10.1080/23723556.2017.1405142. [DOI] [PMC free article] [PubMed] [Google Scholar]
- 14.Degenhardt K, Mathew R, Beaudoin B, et al. Autophagy promotes tumor cell survival and restricts necrosis, inflammation, and tumorigenesis. Cancer Cell. 2006;10(1):51–64. doi: 10.1016/j.ccr.2006.06.001. [DOI] [PMC free article] [PubMed] [Google Scholar]
- 15.Chan LL, Jiang P. Bioinformatics analysis of circulating cell-free DNA sequencing data. Clin Biochem. 2015;48(15):962–75. doi: 10.1016/j.clinbiochem.2015.04.022. [DOI] [PubMed] [Google Scholar]
- 16.Das CK, Mandal M, Kögel D. Pro-survival autophagy and cancer cell resistance to therapy. Cancer Metastasis Rev. 2018;37(4):749–66. doi: 10.1007/s10555-018-9727-z. [DOI] [PubMed] [Google Scholar]
- 17.Sheng J, Qin H, Zhang K, et al. Targeting autophagy in chemotherapy-resistant of hepatocellular carcinoma. Am J Cancer Res. 2018;8(3):354–65. [PMC free article] [PubMed] [Google Scholar]
- 18.Qi M, Zhang J, Zeng W, Chen X. DNAJB1 stabilizes MDM2 and contributes to cancer cell proliferation in a p53-dependent manner. Biochim Biophys Acta. 2014;1839(1):62–69. doi: 10.1016/j.bbagrm.2013.12.003. [DOI] [PubMed] [Google Scholar]
- 19.Cui X, Choi HK, Choi YS, et al. DNAJB1 destabilizes PDCD5 to suppress p53-mediated apoptosis. Cancer Lett. 2015;357(1):307–15. doi: 10.1016/j.canlet.2014.11.041. [DOI] [PubMed] [Google Scholar]
- 20.Li M, Ma F, Wang J, et al. Genetic polymorphisms of autophagy-related gene 5 (ATG5) rs473543 predict different disease-free survivals of triple-negative breast cancer patients receiving anthracycline- and/or taxane-based adjuvant chemotherapy. Chin J Cancer. 2018;37(1):4. doi: 10.1186/s40880-018-0268-1. [DOI] [PMC free article] [PubMed] [Google Scholar]
- 21.Guo H, Chitiprolu M, Roncevic L, et al. Atg5 Disassociates the V1V0-ATPase to promote exosome production and tumor metastasis independent of canonical macroautophagy. Dev Cell. 2017;43(6):716–30. doi: 10.1016/j.devcel.2017.11.018. e7. [DOI] [PubMed] [Google Scholar]
- 22.Mancias JD, Kimmelman AC. Mechanisms of selective autophagy in normal physiology and cancer. J Mol Biol. 2016;428(9 Pt A):1659–80. doi: 10.1016/j.jmb.2016.02.027. [DOI] [PMC free article] [PubMed] [Google Scholar]
- 23.Chen W, Luo K, Ke Z, et al. TBK1 promote bladder cancer cell proliferation and migration via Akt signaling. J Cancer. 2017;8(10):1892–99. doi: 10.7150/jca.17638. [DOI] [PMC free article] [PubMed] [Google Scholar]
- 24.Yang S, Imamura Y, Jenkins RW, et al. Autophagy inhibition dysregulates TBK1 signaling and promotes pancreatic inflammation. Cancer Immunol Res. 2016;4(6):520–30. doi: 10.1158/2326-6066.CIR-15-0235. [DOI] [PMC free article] [PubMed] [Google Scholar]
- 25.Williams KC, McNeilly RE, Coppolino MG. SNAP23, Syntaxin4, and vesicle-associated membrane protein 7 (VAMP7) mediate trafficking of membrane type 1-matrix metalloproteinase (MT1-MMP) during invadopodium formation and tumor cell invasion. Mol Biol Cell. 2014;25(13):2061–70. doi: 10.1091/mbc.E13-10-0582. [DOI] [PMC free article] [PubMed] [Google Scholar]
- 26.Williams KC, Coppolino MG. Phosphorylation of membrane type 1-matrix metalloproteinase (MT1-MMP) and its vesicle-associated membrane protein 7 (VAMP7)-dependent trafficking facilitate cell invasion and migration. J Biol Chem. 2011;286(50):43405–16. doi: 10.1074/jbc.M111.297069. [DOI] [PMC free article] [PubMed] [Google Scholar]
- 27.Sung JS, Kang CW, Kang S, et al. ITGB4-mediated metabolic reprogramming of cancer-associated fibroblasts. Oncogene. 2020;39(3):664–76. doi: 10.1038/s41388-019-1014-0. [DOI] [PubMed] [Google Scholar]
- 28.Chen R, Li WX, Sun Y, et al. Comprehensive asnalysis of lncRNA and mRNA expression profiles in lung cancer. Clin Lab. 2017;63(2):313–20. doi: 10.7754/Clin.Lab.2016.160812. [DOI] [PubMed] [Google Scholar]
- 29.He Y, Liu J, Zhao Z, Zhao H. Bioinformatics analysis of gene expression profiles of esophageal squamous cell carcinoma. Dis Esophagus. 2017;30(5):1–8. doi: 10.1093/dote/dow018. [DOI] [PubMed] [Google Scholar]


