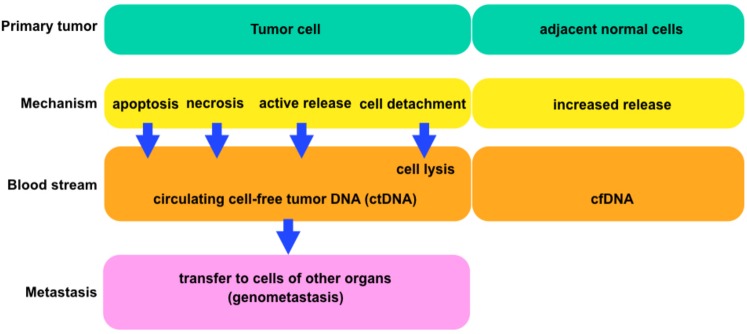
Figure 4. The general scheme comparing tumor and normal cells.
Each block is showing the connections between cells and circulating tumor deoxyribonucleic acids (ctDNA) or cell-free deoxyribonucleic acids (cfDNA) (according to Jung, Fleischhacker & Rabien (2010)).

