Abstract
As a non-invasive brain stimulation technique, transcranial electrical stimulation (TES) and specifically the transcranial direct current stimulation (tDCS) has gained popularity in recent years for treatment of a wide variety of cognitive and neurological disorders. Recent studies have shown that TES can alter the motor cortex excitability. Animal studies to demonstrate the underlying mechanisms of TES are clearly lacking in literature. Clinical studies have agreed on the critical role of the current intensity and the montage of the electrodes for the treatment to be effective. In this study, we used a rat model for in vivo investigation of the vertical electrical (E) Held distribution due to electrodes placed over the skin and through a craniotomy hole. A mono-phasic current pulse was used as a substitute for DC currents by taking advantage of primarily resistive properties of the brain tissue at low frequencies. The electrical potentials induced by the current pulses were recorded with penetrations at Omm, 2mm, and 4mm away from the stimulation electrode. The results showed that the E-field was maximum immediately under the anodic electrode and decreased both in the vertical and horizontal directions rapidly by distance. The magnitude of the electric field varied from tens of mV/mm to a fraction of mV/mm by distance for a 100 μA stimulus amplitude. The results also show that the E-field amplitudes and distribution strongly depend on whether the stimulus electrode is placed over the skin or into a craniotomy hole.
I. Introduction
Neuromodulation utilizes electrical signals to reversibly modulate the neural function. This technology can have instantaneous and focal effects on the neuronal activity, which makes it an appealing treatment method in comparison with pharmacological interventions. Among other brain stimulation techniques, transcranial direct current stimulation (tDCS) comes into prominence due to its cheap price tag and accessibility as well as its ability to modulate neuronal function without causing any significant discomfort to the patients [1]. In a seminal work published in 1963, Bindman el al. showed that intra-cortical direct current (DC) stimulation of the brain changed the spontaneous firings of sensorimotor cortex neurons in anesthetized rats [2]. The cortex activity was diminished during the cathodal stimulation but increased during the anodal stimulation. More recent studies on rats [3], cats [4], and humans [5] reported similar effects when the current was applied transcranially.
Transcranial direct current stimulation utilizes low intensity electrical currents to modulate the neural activity both via excitation and inhibition. However, the exact cellular and molecular mechanisms underlying the tDCS remain unknown. According to one plausible theory supported by the studies of Nische et al. [6] and Purpura and McMurtry [7], tDCS alters the resting potential of the neuronal cell membrane and the synaptic microenvironment causing excitability changes in the cortical neurons. As for the after-effects of tDCS [8], it has been suggested that GABA concentration decreases after anodal stimulation with no change in the glutamate levels, whereas both decline after cathodic stimulation [9]. Based on this theory, tDCS induced plasticity can be explained by the changes in the availability of these two most common neurotransmitters in the CNS.
Recent studies demonstrated that neuronal excitation and inhibition are not determined by the stimulating current direction per se (anodal vs. cathodal), but also by the position and orientation of the neuronal structures relative to the electric field. Based on rat hippocampal slice experiments, Kabakov et al. showed that axonal orientation determined the net effect of the DC field and dendritic orientation had an impact on the magnitude [10]. Bikson et al. applied uniform DC electric fields on CA1 neurons and concluded that the polarization varied along the somato-dendritic axis and dendritic depolarization was sufficient to induce firing even when the soma was in a hyperpolarizing zone [11]. In another study [12], authors predicted that if optimally oriented, the soma of a layer V pyramidal cell is the most sensitive cellular compartment to polarization under weak electric fields. The results of these highly controlled in vitro studies are supported by computational studies [13], [14], which caution the tDCS researchers to pay closer attention to electric field distributions inside the brain. However, there is a lack of in vivo animal studies with direct measurements of the electric (E) fields induced by DC stimulation of the brain tissue. In this study, we used an in vivo rat model to probe the electrical field at varying depths and horizontal distances from a surface stimulating electrode. The rat brain was selected for this study due to its lissencephalic cortex that presumably would give rise to smoother spatial distribution of the E-field as opposed to gyrencephalic brains. The results provide important animal data that can help us better interpret the effects of DC brain stimulation.
II. Methods
A. Surgery
Three Sprague Dawley (SD) rats (320-350 g) were used for acute experiments in this study. All procedures were approved and performed in accordance to the guidelines of the Institutional Animal Care and Use Committee (IACUC), Rutgers University, Newark, NJ. Rats were anesthetized with 5% isoflurane gas inhalation and placed on a stereotaxic frame to fix the top of the skull in horizontal position. The anesthesia was maintained by administering 1-3% isoflurane over the course of surgery. Blood oxygenation levels and body temperature were monitored. The hair on top of animal’s head was removed using a trimmer followed by depilatory cream and the exposed skin was cleaned with antiseptic solution.
B. Stimulation and Recording
The E-Field distributions were studied by transcutaneous current injections in Rat1 and intracranial current injections in Rat2 and Rat3. The electrode for injection of current was a 50μm diameter silver wire with Ag/AgCl surface coating. The wire was fonned into a helix by wrapping it around a 1.2mm diameter rod for 3-4 times to increase the contact area, which reduced its impedance below 10kΩ as measured in PBS.
Transcutaneous Current Injection:
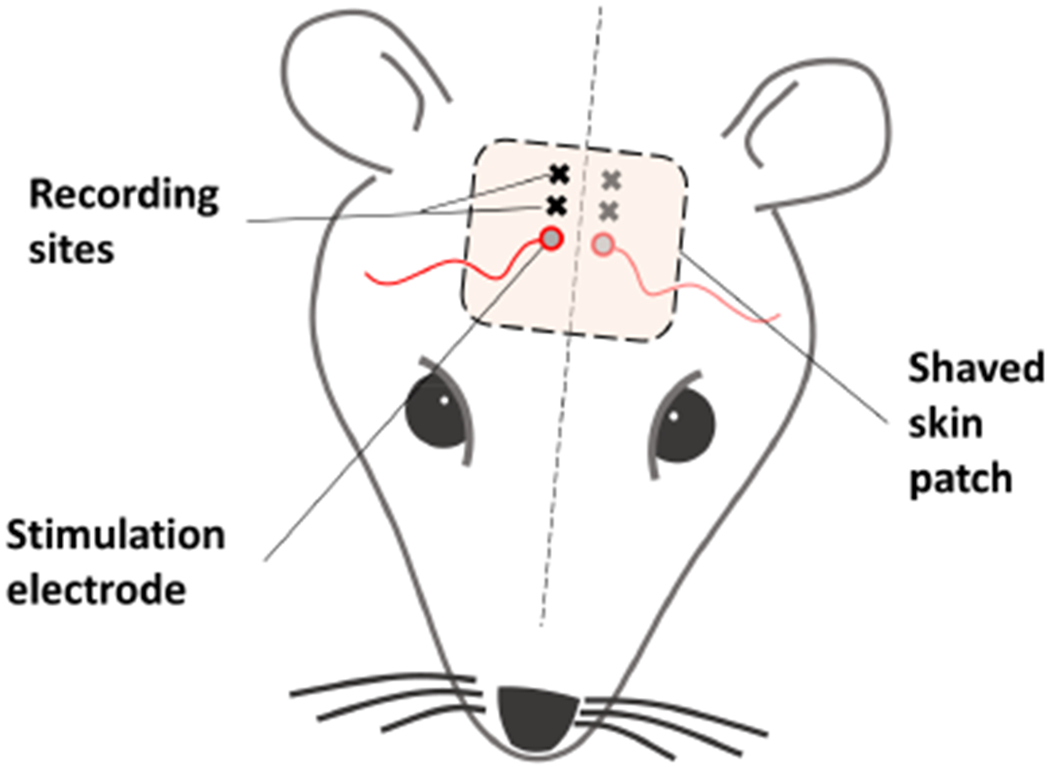
The shaved part of the head was cleaned, and a thin layer of conductive gel was applied on the electrode before placing it on the skin surface to reduce the contact impedance. The stimulation electrode was placed over the right or left side of the brain juxtaposed to the midline and immediately rostral to the coronal suture as shown in Fig. 1. The stimulation reference, a long Ag/AgCl wire, was inserted into the right shoulder muscles. Anodic stimulation was applied by injecting a monophasic 100μA pulse with a pulse width of 100ms at a repetition rate of 1Hz for 10s. The amplitude transitions at the rising and falling edges of the pulse wavefonn in the recorded signals were quantified as a measure of voltage induced in the brain as a result of the current applied. A pulsed stimulus was necessary in order to bypass the poor DC response of the recording metal electrodes. The results would be identical with DC currents since the brain tissue is considered to be a resistive medium for the frequencies of interest in this paper.
Figure 1.

The stimulation and recording electrode placements in Rat1 where the stimulation electrode was placed on the skin, immediately next to the midline and rostral to underlying coronal suture. The E-fields were measured at locations 2mm and 4mm caudal to stimulation electrode edge and 2.5mm lateral to the midline.
Then, the skin flap and periosteum starting from the edge of the stimulation electrode was removed to expose the skull caudally without disturbing the intactness of the skin under the electrode. A micro-drill with a burr diameter of 1mm was used to make two holes at 2mm and 4mm from the electrode edge into the skull to insert a 0.5 MΩ tungsten micro electrode (TM33B05H, World Precision Inst., FL) for recording the induced electrical potentials.
Intracranial Current Injection:
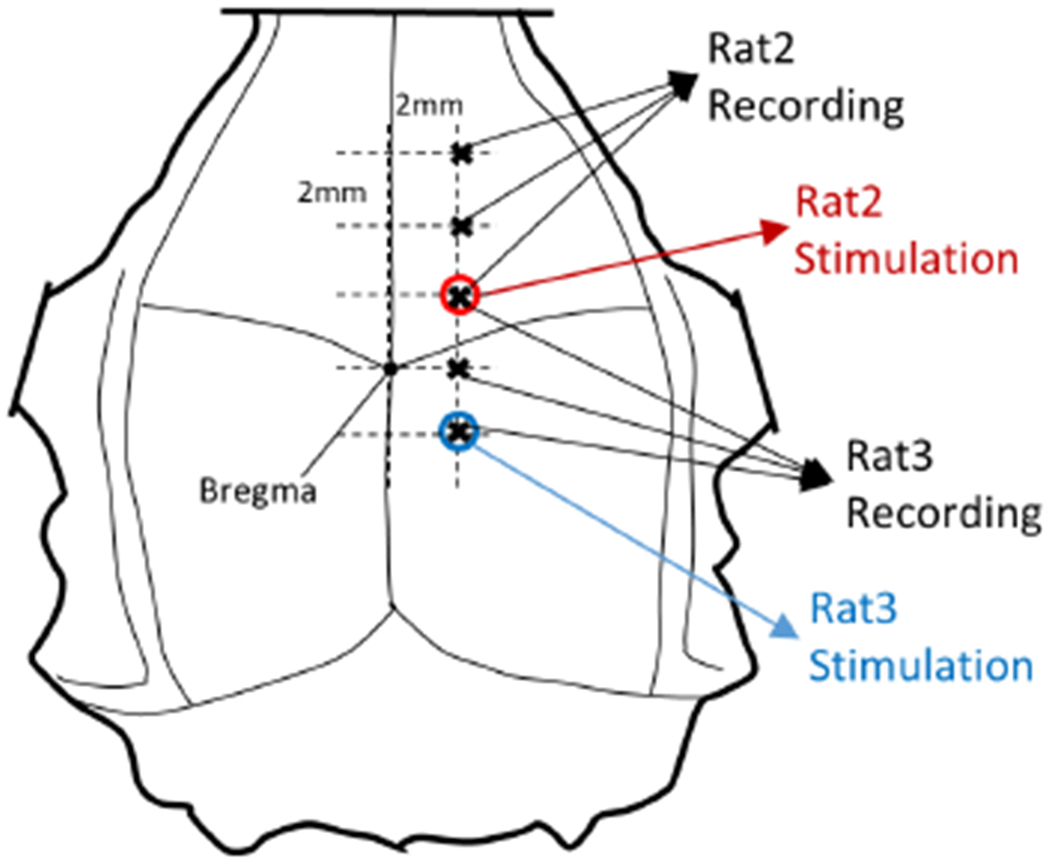
The skin was unattached from the skull and reflected over to expose most of the skull on top of the head. The periosteum was removed and bleeding points from the surrounding tissues were sealed with bone wax. A 2mm craniotomy hole was made at the stimulation point and the helical stimulation electrode was inserted into the hole just above the dura and fixed in place with small amounts of cyano acrylate glue applied to the edges on the skull. Fig. 2 shows the stimulation locations in both rats. For Rat2, the stimulation electrode was placed 2mm rostral and 2mm lateral to the bregma, whereas the stimulation position for Rat3 was 2mm caudal and 2mm lateral to the bregma.
Figure 2.

Stimulation and recording sites for Rat2 and Rat3. Recording was made in multiple locations with 2mm increments starting from below the stimulation point.
The recording experiments included voltage measurements at three different positions through <1mm craniotomy holes shown in Fig. 2. First recording was made directly under the stimulation site by inserting the tungsten electrode through the center of the helical stimulation electrode. The second and third penetrations were at 2mm and 4mm rostral to the stimulation electrode in both rats. The recording electrode was positioned at the center of the craniotomy hole, inserted into the brain with the dura mater in place with the help of a micromanipulator to sample the electrical potentials as a function of depth with respect to another Ag/AgCl reference electrode attached on the skull. Penetration step size was 0.2mm for the first several steps in the cortex and increased to 0.5mm for deeper locations. The initial current intensity was set to 100μA but adjusted up to 200μA as needed to keep the signal-to-noise ratio high for smaller signal amplitudes observed at deeper regions. This procedure was repeated for each recording site.
C. Data Collection
The experiments were perfonned in a large Faraday cage to reduce the enviromnental noise. A data acquisition device (National Instr., Inc) was controlled by a custom-written MATLAB (Mathworks, Inc.) code for simultaneous current injection and recording. Electrical potentials were amplified using a differential amplifier with a gain of 100 (Model 1700, A-M Systems, WA), filtered between 10Hz-10kHz, sampled at 25kHz, and stored for offline analysis.
D. Data Analysis
Raw data were further band-pass filtered between 10Hz-1kHz in MATLAB. Stimulus-triggered averaging (STA) was employed over 10 repetitions of the stimulus pulse to reduce the background activity. Rising edge of the averaged signal was identified, and the voltage jump within 2ms window around the rising edge was measured. This analysis was repeated at each depth. After obtaining all the voltage values, a single-term exponential curve was fitted to the data to minimize the variations due to measurement errors. The E-field was calculated by differentiating the voltage plots with respect to distance (depth).
III. Results
A. Electric Field with Transcutaneous Current Injection
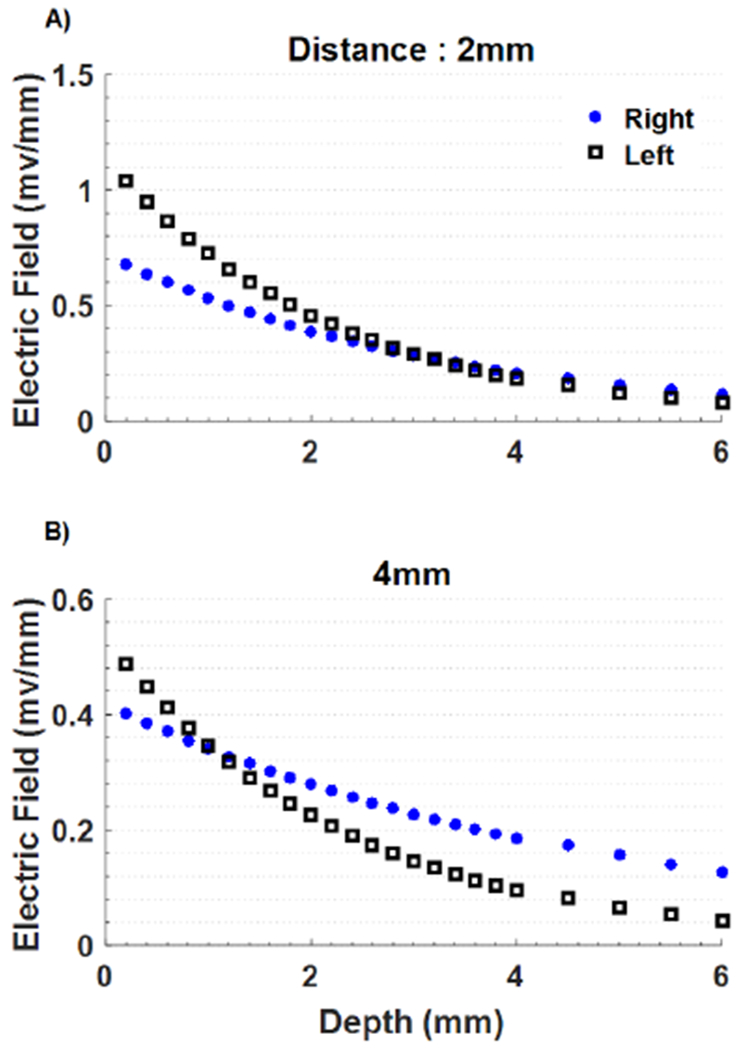
The vertical electric field inside the cortex decayed exponentially by depth and was halved within a couple of millimeters (Fig. 3). The field strengths at 4mm horizontal distance were smaller by a factor of two than those measured at 2mm away from the stimulation electrode. Measurements at 0mm were avoided in order not to disturb the intactness of the skin and the skull under the stimulation electrode.
Figure 3.

The vertical electric field induced by transcutaneous injection of current as a function of depth, at 2mm and 4mm away from the stimulating electrode in horizontal direction. Zero depth is the cortex level.
B. Electric Field with Intracranial Current Injection
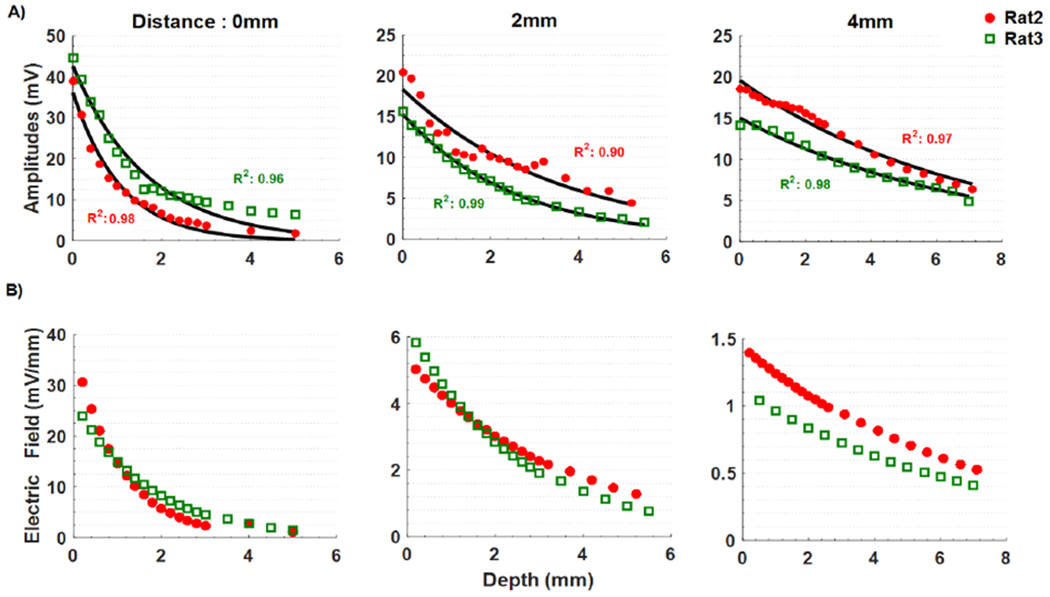
The largest (vertical) E-fields were measured under the stimulation electrode near the cortex. The E-fields were the highest at the center of the stimulating electrode (0 mm) with intracranial injection. In general, the vertical E-field intensities were much smaller at 2mm and 4mm away from stimulating electrode, and the E-field decreased at a slower pace by depth at those locations than the measurements made at the center of the stimulation electrode (0 mm). The decrease in the vertical E-field by horizontal distance (from 2mm to 4mm) was also stronger with intracranial placement of the stimulation electrode than that of the transcutanous electrode.
IV. DISCUSSION
Current shunting through the skin and skull has been discussed by other groups. Miranda et al. concluded that approximately half of the current injected during tDCS was shunted through the scalp [15]. The authors also argued that the remaining current was not distributed uniformly but concentrated near the electrode edges. They suggested using different electrode montages to focus the field to the desired parts of the cortex. Opitz et al. showed in a human finite element modeling study that a thinner skull provides better electrical penetration [14]. Our findings corroborate with these studies when the intracranial and transcutaneous stimulation results are compared.
The E-field amplitudes were slightly different in each animal tested. The potential sources of discrepancy are the difference in the skin and skull thicknesses. The distance from the skull surface to the cortex may also change depending on the anesthesia regime and how it affects the brain edema in a given animal. Although we made sure that our recordings started at the cortical surface, the distance from the scalp surface and/or the stimulation electrode might have been slightly different in each animal.
Previous studies have mentioned that different brain structures, such as sulci, gyri, blood vessels, and ventricles can affect the distribution of the E-field since they have different conductive properties. In this study, the deviations of voltage measurements from the fitted curves can be due to the recording electrode encountering electrically more conductive or resistive areas during penetration.
These in vivo measurements of the E-field reiterates the importance of the electrode placement to achieve reproducible effects with DC stimulation. In particular, transcutaneous and intracranial placements of the stimulation electrode produce E-fields of much different amplitudes and gradients by depth and by horizontal distance. Further research in animal models is warranted for more accurate estimates of the E-field in the brain for TES and tDCS applications.
Figure 4.

The voltage (A) and the vertical electric field (B) as a function of depth in each column for increasing horizontal distances from the center of the stimulating electrode (0, 2, and 4mm). Single-term exponential curves are fitted to the voltage measurements. The electric fields are calculated by differentiating the curve-fitted voltage plots. Horizontal axis starts from the cortex level (depth = 0).
Acknowledgments
* Research supported by National Institute of Health.
References
- [1].Bikson M et al. , “Safety of Transcranial Direct Current Stimulation: Evidence Based Update 2016,” Brain Stimulation, vol. 9, no. 5 Elsevier, pp. 641–661, 01-September-2016. [DOI] [PMC free article] [PubMed] [Google Scholar]
- [2].Bindman LJ, Lippold OCJ, and Redfearn JWT, “The action of brief polarizing currents on the cerebral cortex of the rat (1) during current flow and (2) in the production of long-lasting after-effects,” J. Physiol, vol. 172, no. 3, pp. 369–382, August 1964. [DOI] [PMC free article] [PubMed] [Google Scholar]
- [3].Liebetanz D, Koch R, Mayenfels S, König F, Paulus W, and Nitsche MA, “Safety limits of cathodal transcranial direct current stimulation in rats.,” Clin. Neurophysiol, vol. 120, no. 6, pp. 1161–7, June 2009. [DOI] [PubMed] [Google Scholar]
- [4].Schweid L, Rushmore RJ, and Valero-Cabré A, “Cathodal transcranial direct current stimulation on posterior parietal cortex disrupts visuo-spatial processing in the contralateral visual field.,” Exp. brain Res, vol. 186, no. 3, pp. 409–17, April 2008. [DOI] [PubMed] [Google Scholar]
- [5].Nitsche MA and Paulus W, “Excitability changes induced in the human motor cortex by weak transcranial direct current stimulation.,” J. Physiol, vol. 527 Pt 3, pp. 633–9, September 2000. [DOI] [PMC free article] [PubMed] [Google Scholar]
- [6].Nitsche MA, Nitsche MS, Klein CC, Tergau F, Rothwell JC, and Paulus W, “Level of action of cathodal DC polarisation induced inhibition of the human motor cortex.,” Clin. Neurophysiol, vol. 114, no. 4, pp. 600–4, April 2003. [DOI] [PubMed] [Google Scholar]
- [7].Purpura DP and McMurtry JG, “Intracellular activities and evoked potential changes during polarization of motor cortex,” J. Neurophysiol, vol. 28, no. 1, pp. 166–185, January 1965. [DOI] [PubMed] [Google Scholar]
- [8].Roche N, Geiger M, and Bussel B, “Mechanisms underlying transcranial direct current stimulation in rehabilitation,” Ann. Phys. Rehabil. Med, vol. 58, no. 4, pp. 214–219, September 2015. [DOI] [PubMed] [Google Scholar]
- [9].Stagg CJ et al. , “Polarity-sensitive modulation of cortical neurotransmitters by transcranial stimulation.,” J. Neurosci, vol. 29, no. 16, pp. 5202–6, April 2009. [DOI] [PMC free article] [PubMed] [Google Scholar]
- [10].Kabakov AY, Muller PA, Pascual-Leone A, Jensen FE, and Rotenberg A, “Contribution of axonal orientation to pathway-dependent modulation of excitatory transmission by direct current stimulation in isolated rat hippocampus,” J. Neurophysiol, vol. 107, no. 7, pp. 1881–1889, April 2012. [DOI] [PMC free article] [PubMed] [Google Scholar]
- [11].Bikson M et al. , “Effect of uniform extracellular DC electric fields on excitability in rat hippocampal slices in vitro,” J. Physiol, vol. 557, no. 1, pp. 175–190, May 2004. [DOI] [PMC free article] [PubMed] [Google Scholar]
- [12].Radman T, Ramos RL, Brumberg JC, and Bikson M, “Role of cortical cell type and morphology in subthreshold and suprathreshold uniform electric field stimulation in vitro,” Brain Stimul., vol. 2, no. 4, p. 215–228. e3, October 2009. [DOI] [PMC free article] [PubMed] [Google Scholar]
- [13].Datta A, Bikson M, and Fregni F, “Transcranial direct current stimulation in patients with skull defects and skull plates: high-resolution computational FEM study of factors altering cortical current flow.,” Neuroimage, vol. 52, no. 4, pp. 1268–78, October 2010. [DOI] [PMC free article] [PubMed] [Google Scholar]
- [14].Opitz A, Paulus W, Will S, Antunes A, and Thielscher A, “Determinants of the electric field during transcranial direct current stimulation.,” Neuroimage, vol. 109, pp. 140–50, April 2015. [DOI] [PubMed] [Google Scholar]
- [15].Miranda PC, Lomarev M, and Hallett M, “Modeling the current distribution during transcranial direct current stimulation,” Clin. Neurophysiol, vol. 117, no. 7, pp. 1623–1629, July 2006. [DOI] [PubMed] [Google Scholar]


