

Abstract
High aldehyde dehydrogenase 1A1 (ALDH1A1) activity has emerged as a reliable marker for the identification of both normal and cancer stem cells. To facilitate the detection, molecular imaging, and sorting of stem cells, a green fluorescent probe based on the xanthene dye scaffold was recently developed. However, green dyes are less amenable to multicolor imaging because most commercial reagents are also green. Overcoming this limitation will enable the simultaneous tracking of multiple stem cell markers. Herein, we report the development of a red congener, red-AlDeSense. Through chemical tuning we were able to achieve excellent isoform selectivity and chemostability, a good turn on response, and enhanced cellular uptake and reactivity. Importantly, red-AlDeSense represents one of only a few turn-on sensors in the red region that use the d-PeT quenching mechanism. By employing red-AlDeSense and a green anti-CD44 antibody, we were able to demonstrate staining of these two stem cell markers is independent of one another in A549 lung adenocarcinoma cells.
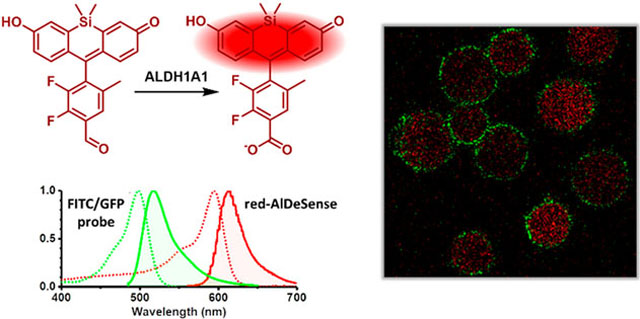
Graphical Abstract
Along with other members of the aldehyde dehydrogenase (ALDH) family (19 in total), ALDH1A1 is an important cytosolic enzyme that serves to detoxify endogenous and xenobiotic aldehydes through oxidation to their corresponding carboxylic acid products.1 Although the precise reasons are not well understood, ALDH1A1 is overexpressed in many normal and cancer stem cell types, where it is used as a well-established stem cell marker.2 Patient sample analyses using immunohistochemistry and PCR-based methods have revealed that ALDH1A1 levels are commonly elevated in breast,3 lung,4,5 ovarian,6 and prostate cancer,7 as well as in leukemia8 and lymphoma.9 These results often correlate with poor prognosis and patient survival.
Noninvasive detection of ALDH1A1 in live samples, as opposed to the destructive approaches mentioned above, can enable real-time monitoring and longitudinal tracking of stem cell properties. We recently reported the development of AlDeSense, an activity-based sensor that permitted the first studies of stem cell plasticity (via ALDH1A1 activity) in tumorsphere and animal models (Figure 1).10 Owing to donor-photoinduced electron transfer (d-PeT) quenching from the benzaldehyde substrate, this sensor is weakly fluorescent prior to activation. ALDH1A1-catalyzed oxidation to the carboxylic acid product is accompanied by a robust fluorescence turn-on response. Despite the major advance this approach represents, we now seek to improve two properties to broaden its general utility. First, AlDeSense is not cell permeable unless it is chemically modified with capping groups (i.e., acetoxymethyl ether) to mask the intrinsic negative charge character on the phenolic alcohol (pKa = 4.81). Consequently, intracellular esterases are required for full activation (Figure 1). This process generates byproducts, namely acetate and formaldehyde, which are released upon uncapping. Second, the absorbance and emission profiles of AlDeSense overlaps with that of FITC and GFP, small-molecule and protein handles, respectively, that are commonly used to visualize biological processes via molecular imaging.
Figure 1.
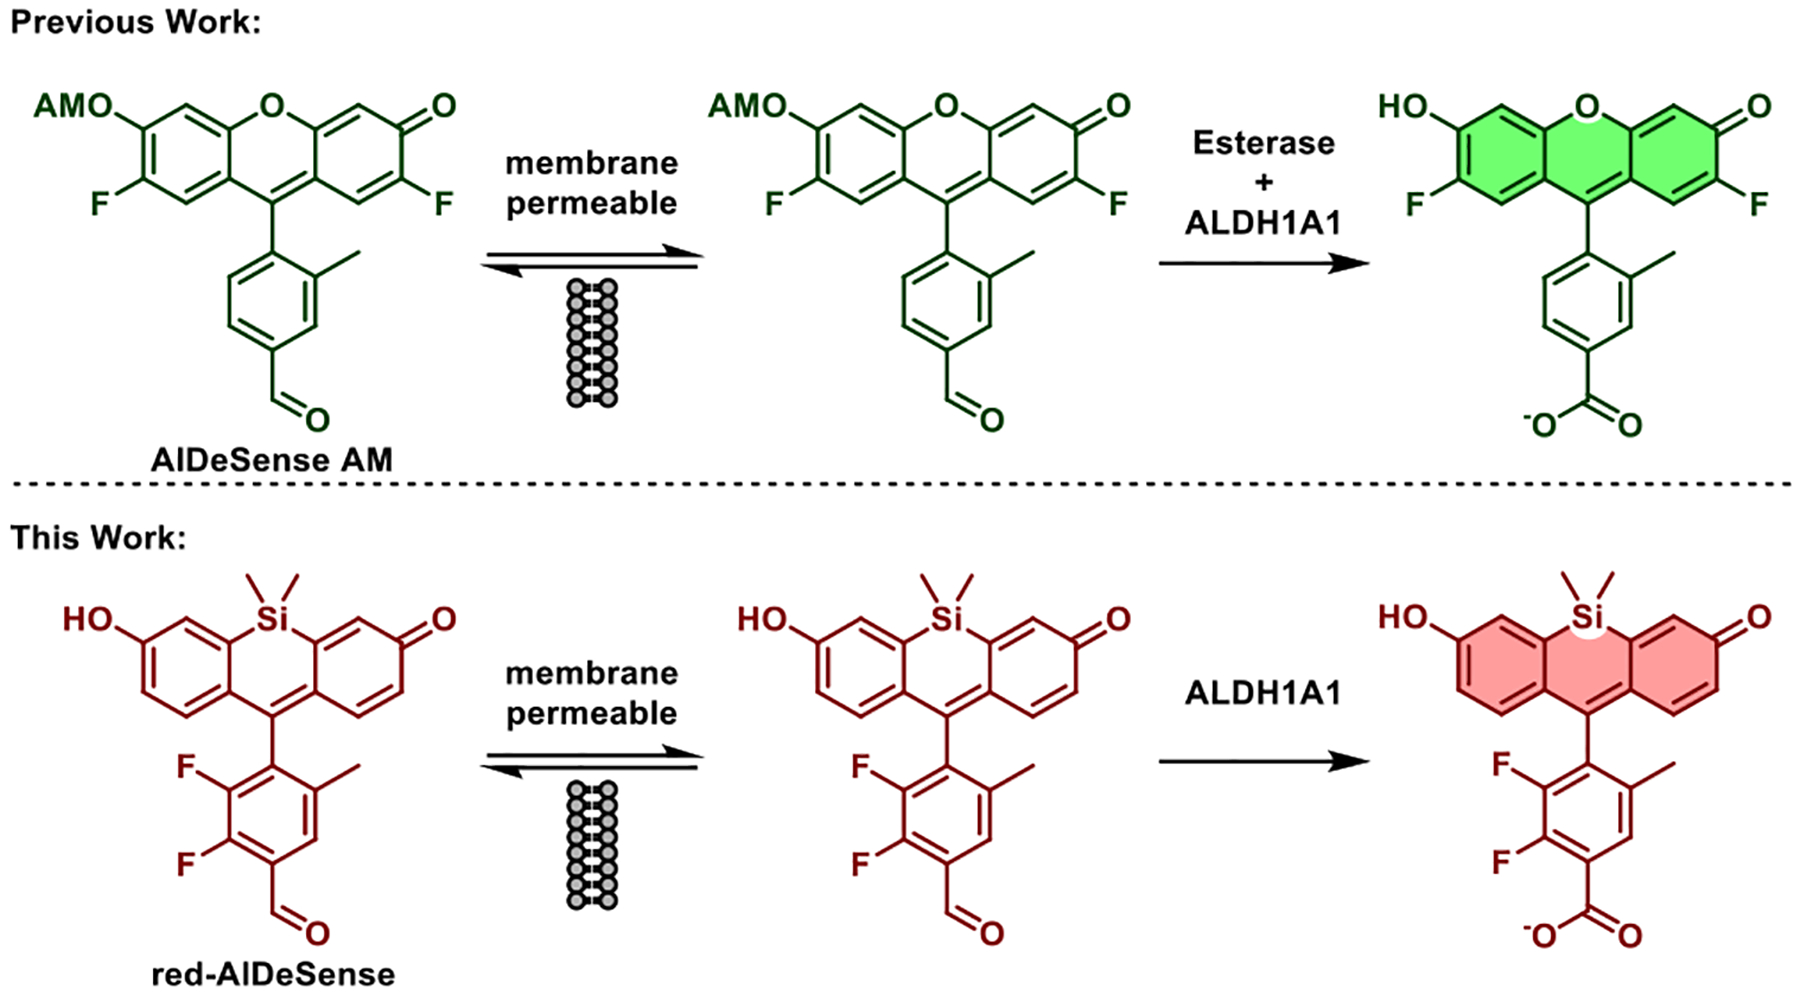
Comparison of the enzymatic requirements for accumulation and fluorescent turn on of AlDeSense AM and red-AlDeSense.
In this work, we developed red-AlDeSense, a cell-permeable, red-shifted activity-based sensor for ALDH1A1 based on the TokyoMagenta dye platform (Figure 1).11 Chemical tuning of the substituents on the pendent aryl ring was crucial to maintain excellent isoform selectivity while achieving a good turn-on response upon enzyme-mediated oxidation. To account for nonspecific staining, we designed a nonresponsive control reagent (Ctrl-red-AlDeSense). This tool was used in tandem with red-AlDeSense to identify A549 lung adenocarcinoma cells exhibiting the highest ALDH1A1 activity via flow cytometry and confocal microscopy. Multicolor imaging of red-AlDeSense with a FITC-labeled anti-CD44 antibody revealed independent staining for ALDH1A1 activity and the non-small cell lung cancer stem cell marker.12–14
We initially proposed to develop a sensor with the requisite properties by simply substituting the endocyclic oxygen with a dimethylsilicon group. Past reports indicated that this modification results in shifts of up to ~100 nm for both excitation and emission maxima.11,15–17 However, we found that the resultant sensor (Probe 1) was no longer selective for ALDH1A1 and that it exhibited an insufficiently small 1.7-fold turn-on response (Figure 2). Its relatively large quantum yield (0.32) indicates d-PeT quenching from the benzaldehyde substrate was no longer sufficient. This hypothesis is further supported by the analysis with the Rehm–Weller eq (eq 1).18
| (1) |
Figure 2.
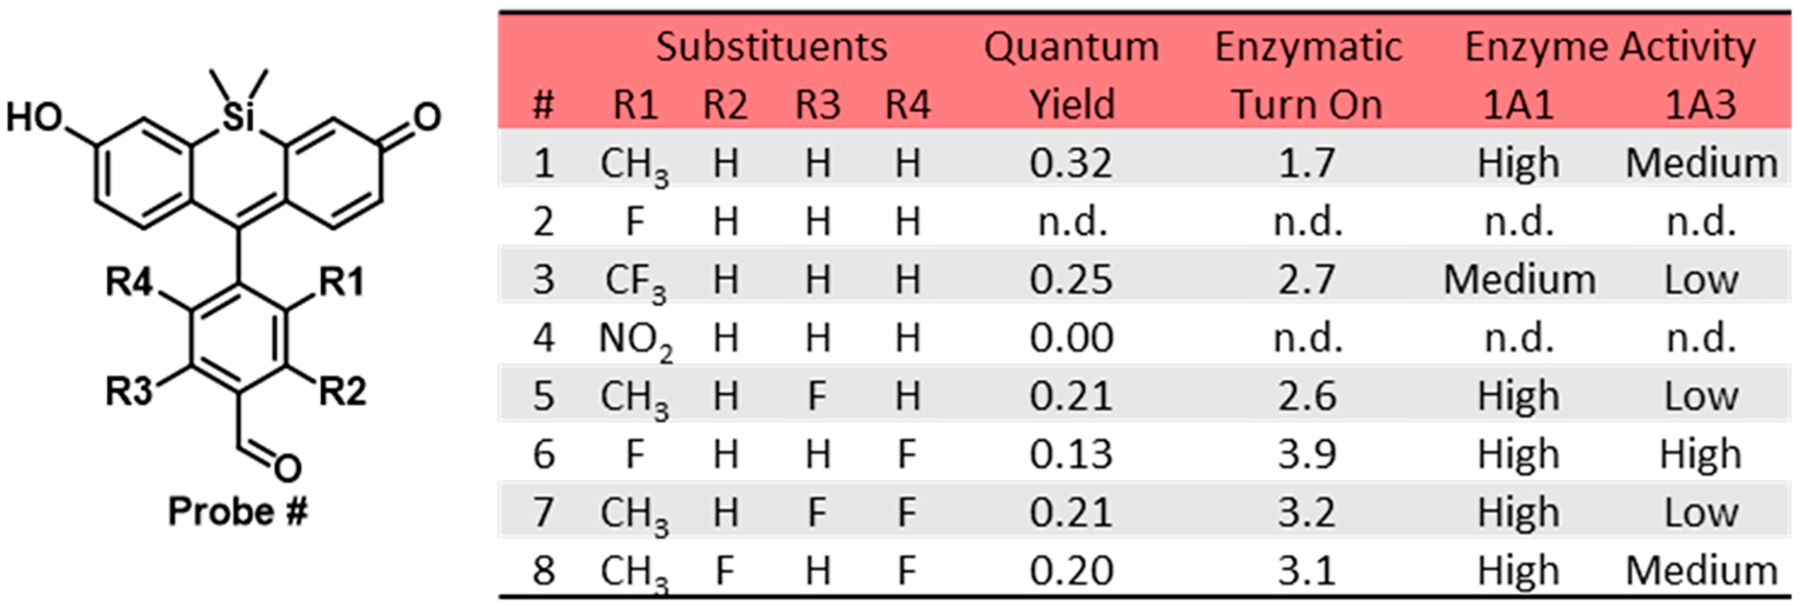
Structure and selected properties of Probes 1–8. n.d. = not determined.
The term ΔE00 describes the energy difference between the lowest vibrational energy levels of the ground and first electronic energy states. ΔE00 can be estimated by the intersecting wavelength of the normalized absorbance and emission profiles. Specifically, AlDeSense has ΔE00 = 2.46 eV at 503 nm, while TokyoMagenta dyes have ΔE00 ~ 2.07 eV at 600 nm. Given the ~0.4 eV difference, we hypothesized we could achieve a greater dynamic range by reducing the electron density of the pendant aryl ring. We first explored the effects of introducing a single electron deficient substituent (fluoro, trifluoromethyl, and nitro) by replacing the methyl group at the R1 position. While none of these modifications led to the desired properties, each congener provided useful insights for further chemical tuning. For instance, we found that the fluoro substituent (Probe 2) did not provide sufficient steric bulk to prevent nucleophilic attack (e.g., by water) on the xanthene core which resulted in rapid decomposition of the fluorophore.19 In contrast, modification with a trifluoromethyl group (Probe 3) displayed slow enzyme kinetics, suggesting that it was too large and therefore not able to effectively bind to the ALDH1A1 active site. Lastly, the nitro moiety was too strong of a d-PeT quencher, as we could not determine by fluorescence kinetics assays whether Probe 4 was not turning over or if its carboxylate product was equally quenched. We then turned our attention to tuning the LUMO energy levels of Probes 1 and 2 by installing fluorines at the R3 and R4 positions, respectively. Relative to the 1.7-fold turn on that was observed for Probe 1, activation of Probe 5 with ALDH1A1 resulted in a 2.6-fold fluorescent enhancement. In contrast to the instability of Probe 2, the second fluoro group was sufficient to prevent water-mediated decomposition of Probe 6. Although this sensor displayed the largest response to ALDH1A1 in the series (3.9-fold), it exhibited cross-reactivity with ALDH1A3. Drawing from our findings, we reasoned we would be able to maintain isoform selectivity and achieve a sufficient turn-on response if we installed an additional fluoro group to Probe 5 at the position R4. The resultant sensor, Probe 7 (named red-AlDeSense), was selective for ALDH1A1 over ALDH1A3 and displayed a 3.2-fold turn-on response when treated with ALDH1A1. Finally, we prepared the constitutional isomer of red-AlDeSense (Probe 8) to probe the impact of different fluoro substitution patterns. We found the ALDH1A1-to-ALDH1A3 selectivity was eroded when the fluoro group at R3 was moved to the R2 position.
Synthesis of red-AlDeSense began with Fisher esterification of 4-bromo-2,3-difluorobenzoic acid followed by iodination with N-iodosuccinimide to afford methyl 4-bromo-2,3-difluoro-5-iodobenzoate 2 in 71.7% yield. Suzuki coupling with methylboronic acid chemoselectively substituted the iodine with a methyl group to yield compound 3 in 61.0% yield. DIBAL-H reduction of the ester and subsequent TBS protection of the resultant benzyl alcohol afforded the desired aryl bromide 5 in 83.3% yield. One pot lithium-halogen exchange with t-BuLi, coupling with the TBS-protected Si-xanthone 6, and global deprotection afforded the penultimate precursor 7 in 64.8% yield. Finally, red-AlDeSense was synthesized by oxidation of the benzyl alcohol with IBX in 45.1% yield (Figure 3a).
Figure 3.
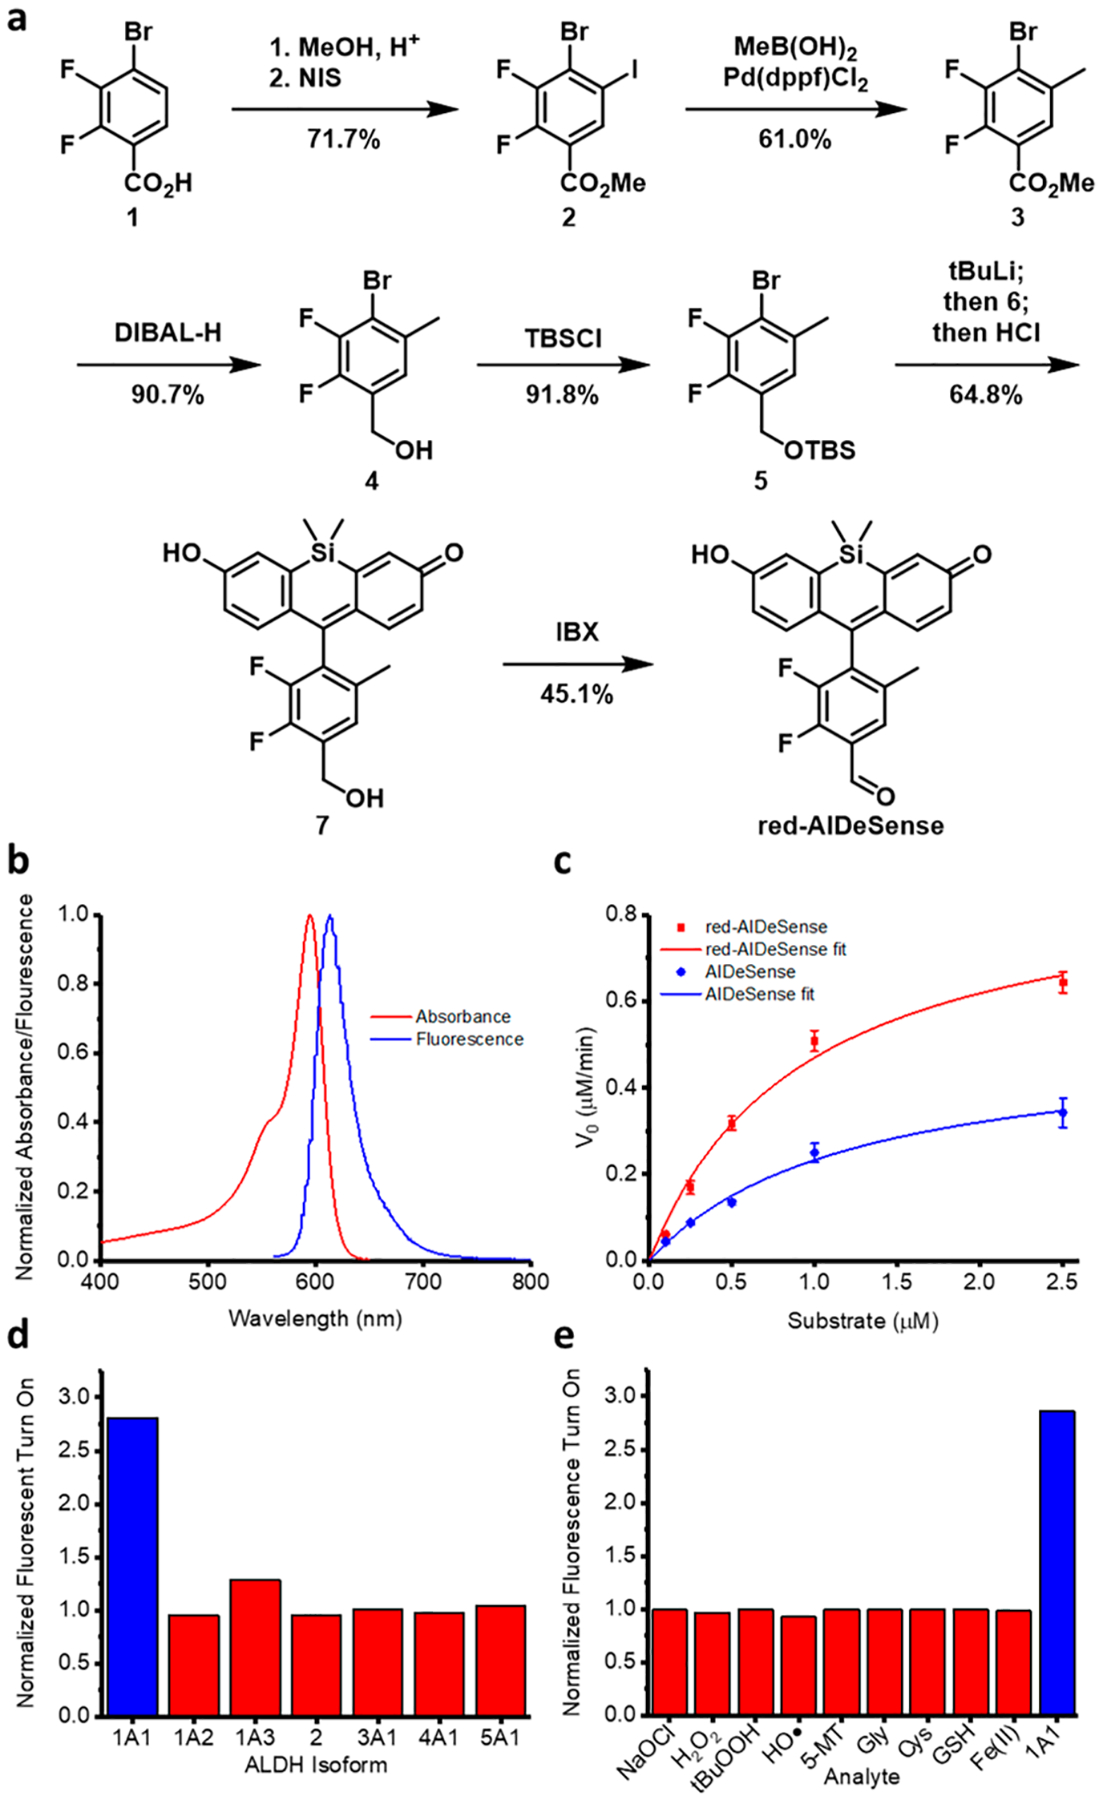
(a) Synthetic scheme for red-AlDeSense. (b) Normalized absorption and emission spectra (upon excitation at 594 nm) of red-AlDeSense. Normalized fluorescence turn on of red-AlDeSense by (c) ALDH1A1, (d) multiple ALDH isoforms, and (e) multiple biologically relevant, reactive species. All assays were performed in 50 mM triethanolamine buffer red-AlDeSense at 2 μM. Enzyme concentrations affording 1 nmol substrate/min were used. Reactive species were tested at 100 μM, except glutathione which was at 1 mM. 5-MT = 5-methoxytryptamine.
The maximum absorbance (λabs) and emission (λem) wavelengths of red-AlDeSense were centered at 594 and 614 nm, respectively (Figure 3b). Of note, λabs aligns perfectly with the HeNe-594 nm laser line, which is common in many instruments. Compared to AlDeSense (kcat/Km = 3.46 μM−1 min−1), our new sensor responded significantly faster under identical conditions with a measured kcat/Km of 7.91 μM−1 min−1 (Figure 3c). In addition to determining the ALDH1A1-to-ALDH1A3 selectivity ratio, we also tested against ALDH1A2, ALDH2, ALDH3A1, ALDH4A1, and ALDH5A1. In each instance, we found no cross-reactivity (Figure 3d). We also examined the chemostability of red-AlDeSense across a panel of reactive oxygen, nitrogen, and sulfur species and found only ALDH1A1 elicited turnover of the sensor (Figure 3e).
Before proceeding to live cell imaging, we synthesized a control dye (Ctrl-red-AlDeSense). The difference between the two dyes is the replacement of the aldehyde group with a methyl ketone moiety. Since ALDH1A1 relies on hydride transfer to an NAD+ cofactor for substrate oxidation, this modification renders Ctrl-red-AlDeSense chemically inert to ALDH1A1. On the other hand, this small change leaves the physical properties nearly identical such that the cell permeability should be the same. Therefore, staining with Ctrl-red-AlDeSense can be used to account for background fluorescence from nonspecific staining. Finally, we established that both red-AlDeSense and Ctrl-red-AlDeSense are nontoxic to K562 cells using the trypan blue assay (Figure S1).
We then turned our attention to determining whether red-AlDeSense could be used to identify A549 lung adenocarcinoma cells with high ALDH1A1 activity via flow cytometry. Cells were first stained with the nonresponsive control compound (Ctrl-red-AlDeSense) to establish gating conditions for background fluorescence (Figure 4a). Using red-AlDe-Sense, we determined that 78.1 ± 0.3% of A549 cells displayed high ALDH1A1 activity (Figure 4b). We were able to decrease the extent of red-AlDeSense activation to 67.8 ± 3.4% by applying 4-diethylaminobenzaldehyde (DEAB), a reversible competitive inhibitor of ALDHs (Figure 4c). Compared to A549 cells, K562 chronic myeloid leukemia cells have lower transcriptional levels of ALDH1A1.20 As such, we evaluated whether this would translate into differences in ALDH1A1 activity. Indeed, only 39.0 ± 8.3% of K562 cells had high ALDH1A1 activity which correlates with transcriptome data. Moreover, DEAB treatment was also able to decrease sensor activation (Figure 4d). Consistent with flow cytometry analysis, 77.6% of red-AlDeSense stained A549 cells were determined to have high ALDH1A1 activity using confocal microscopy (Figure 4e).
Figure 4.
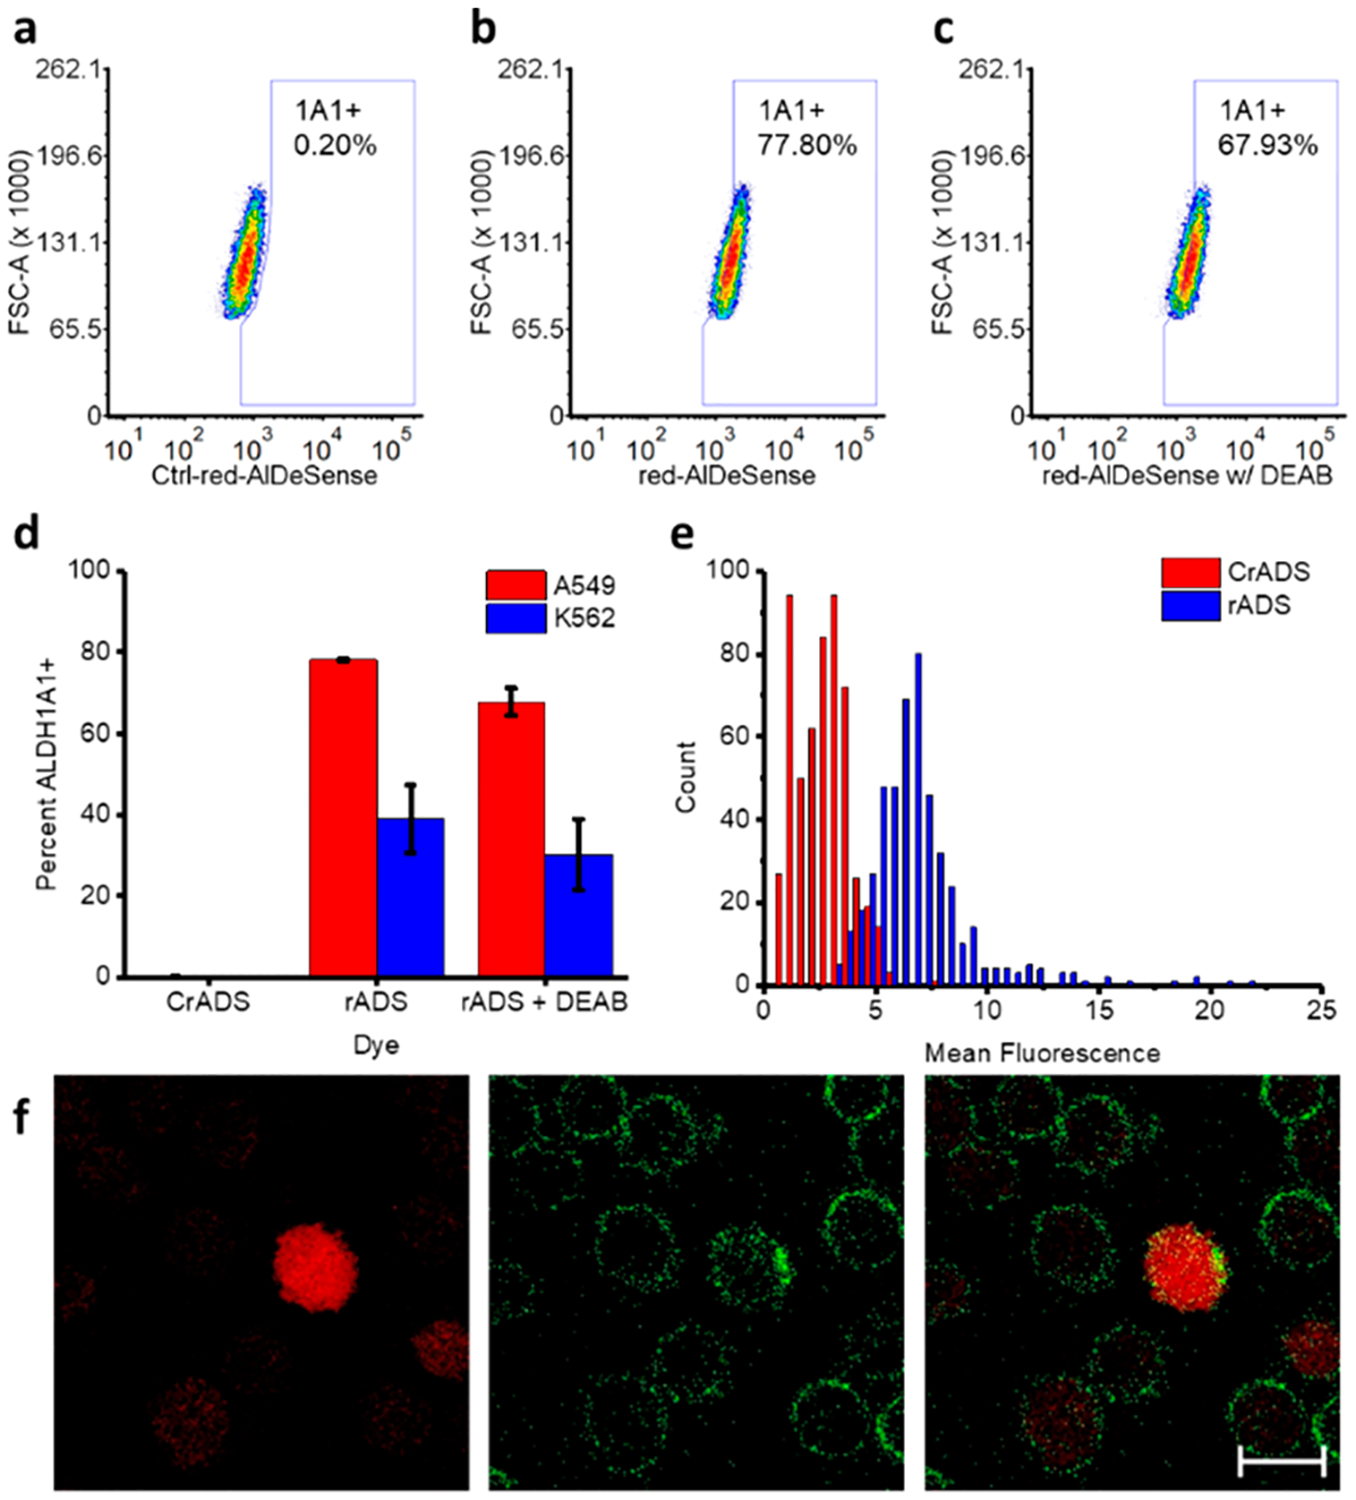
Representative plots of the flow cytometry analysis of A549 cells stained for 10 min at 0 °C with (a) Ctrl-red-AlDeSense, (b) red-AlDeSense, and (c) red-AlDeSense plus 20 μM DEAB. (d) Quantified data of each assay performed in triplicate with A549 and K562 cells. (e) Histogram of the mean fluorescence of cells stained for 10 min at room temperature with Ctrl-red-AlDeSense or red-AlDeSense. (f) Representative confocal images of A549 cells costained with red-AlDeSense (red) and a FITC-labeled anti-CD44 antibody (CD44, green). All assays were performed using 1 μM Ctrl-red-AlDeSense or red-AlDeSense.
Lastly, we sought to highlight the multicolor imaging capabilities of the new sensor using a green FITC-labeled anti-CD44 antibody. The surface biomarker expression profiles of cancer stem cells sometimes correlate with and other times are independent of ALDH1A1.4,10 Thus, we wanted to investigate whether A549 cells with the highest ALDH1A1 activity would correlate with those with the greatest extent of CD44 staining. Using confocal imaging, we found that most cells were CD44+ as evidenced by a clear cell membrane staining pattern. However, only a subset of these cells were highly fluorescent on the red-AlDeSense channel (Figure 4f). This suggests CD44 and ALDH1A1 are independent markers (Figure S2).
In summary, we have developed a red fluorescent sensor that is selective for ALDH1A1. By utilizing a benzaldehyde-based substrate design we were able to exclude cross-reactivity with a majority of the ALDHs (e.g., ALDH3A1) that feature a narrow channel leading to the active site. Moreover, we were able to achieve selectivity over the 1A2 and 1A3 isoforms through strategic placement of fluoro substituents on the pendant aryl ring that presumably forms crucial hydrophobic contacts with the enzyme. To our knowledge, this is the first example in which a rational design approach was employed to develop a red fluorescent sensor based on the d-PeT mechanism. The major advantage of red-AlDeSense is its cell permeability, which can be attributed to the pKa value of the phenolic alcohol (6.68). As such, the sensor requires only the action of ALDH1A1 for both accumulation and fluorescence turn on. Moreover, we observed 2.3-fold higher catalytic efficiency (kcat/Km) for the new sensor. The change to Si-xanthene and modification of the pendant aryl ring substituents resulted in a 100 nm bathochromic shift in absorbance and emission compared to our first-generation sensor (AlDeSense). Bathochromic shifting allowed for multicolor imaging using a green FITC-labeled anti-CD44 antibody. From these studies we showed independent staining for ALDH1A1 activity and CD44 levels in A549 lung adenocarcinoma cells. We believe red-AlDeSense will emerge as a useful tool for studying cells expressing high ALDH1A1 activity.
Supplementary Material
ACKNOWLEDGMENTS
This work was supported by the National Institutes of Health (R35GM133581). Major funding for the 500 MHz Bruker CryoProbeTM was provided by the Roy J. Carver Charitable Trust (Muscatine, Iowa; grant no. 15-4521) to the School of Chemical Sciences NMR Lab. The Q-Tof Ultima mass spectrometer was purchased in part with a grant from the National Science Foundation, Division of Biological Infrastructure (DBI-0100085). We also acknowledge the Core Facilities at the Carl R. Woese Institute for Genomic Biology for access to the Zeiss LSM 710 confocal microscope and corresponding software. We thank Dr. Barbara Pilas and the Flow Cytometry Facility for use of the BD LSR II flow cytometry analyzer.
Footnotes
Supporting Information
The Supporting Information is available free of charge on the ACS Publications website at DOI: 10.1021/acs.bioconjchem.9b00723.
Experimental procedures, additional figures, syntheses, compound characterization, and spectral data (PDF)
The authors declare the following competing financial interest(s): T.E.B. and J.C. hold a patent for AlDeSense and are in the process of licensing the technology.
Safety statement: No unexpected or unusually high safety hazards were encountered.
REFERENCES
- (1).Tomita H, Tanaka K, Tanaka T, and Hara A (2016) Aldehyde Dehydrogenase 1A1 in Stem Cells and Cancer. Oncotarget 7, 11018–11032. [DOI] [PMC free article] [PubMed] [Google Scholar]
- (2).Allahverdiyev AM, Bagirova M, Nehir O, Yaman S, Sefik E, Cakir R, Canim S, Elcicek S, and Yesilkir S (2012) Aldehyde Dehydrogenase: Cancer and Stem Cells. Dehydrogenases 1, 3–28. [Google Scholar]
- (3).Ginestier C, Hur MH, Charafe-Jauffret E, Monville F, Dutcher J, Brown M, Jacquemier J, Viens P, Kleer CG, Liu S, et al. (2007) ALDH1 Is a Marker of Normal and Malignant Human Mammary Stem Cells and a Predictor of Poor Clinical Outcome. Cell Stem Cell 1, 555–567. [DOI] [PMC free article] [PubMed] [Google Scholar]
- (4).Miyata T, Oyama T, Yoshimatsu T, Higa H, Kawano D, Sekimura A, Yamashita N, So T, and Gotoh A (2017) The Clinical Significance of Cancer Stem Cell Markers ALDH1A1 and CD133 in Lung Adenocarcinoma. Anticancer Res. 37, 2541–2547. [DOI] [PubMed] [Google Scholar]
- (5).Gao F, Zhou B, Xu JC, Gao X, Li SX, Zhu GC, Zhang XG, and Yang C (2015) The Role of LGR5 and ALDH1A1 in Non-Small Cell Lung Cancer: Cancer Progression and Prognosis. Biochem. Biophys. Res. Commun 462, 91–98. [DOI] [PubMed] [Google Scholar]
- (6).Liebscher CA, Prinzler J, Sinn BV, Budczies J, Denkert C, Noske A, Sehouli J, Braicu EI, Dietel M, and Darb-Esfahani S (2013) Aldehyde Dehydrogenase 1/Epidermal Growth Factor Receptor Coexpression Is Characteristic of a Highly Aggressive, Poor-Prognosis Subgroup of High-Grade Serous Ovarian Carcinoma. Hum. Pathol 44, 1465–1471. [DOI] [PubMed] [Google Scholar]
- (7).Li T, Su Y, Mei Y, Leng Q, Leng B, Liu Z, Stass SA, and Jiang F (2010) ALDH1A1 Is a Marker for Malignant Prostate Stem Cells and Predictor of Prostate Cancer Patients’ Outcome. Lab. Invest 90, 234–244. [DOI] [PMC free article] [PubMed] [Google Scholar]
- (8).Smith C, Gasparetto M, Humphries K, Pollyea DA, Vasiliou V, and Jordan CT (2014) Aldehyde Dehydrogenases in Acute Myeloid Leukemia. Ann. N. Y. Acad. Sci 1310, 58–68. [DOI] [PubMed] [Google Scholar]
- (9).Song Y-H, Zhong M-Z, Chai Q, Gong K-Y, Tan X-L, Hu J-Y, and Wang G-H (2018) The Role of Aldehyde Dehydrogenase 1A1 in B-Cell Non-Hodgkin’s Lymphoma. Oncol. Rep 39, 1261–1268. [DOI] [PubMed] [Google Scholar]
- (10).Anorma C, Hedhli J, Bearrood TE, Pino NW, Gardner SH, Inaba H, Zhang P, Li Y, Feng D, Dibrell SE, et al. (2018) Surveillance of Cancer Stem Cell Plasticity Using an Isoform-Selective Fluorescent Probe for Aldehyde Dehydrogenase 1A1. ACS Cent. Sci 4, 1045–1055. [DOI] [PMC free article] [PubMed] [Google Scholar]
- (11).Egawa T, Koide Y, Hanaoka K, Komatsu T, Terai T, and Nagano T (2011) Development of a Fluorescein Analogue, TokyoMagenta, as a Novel Scaffold for Fluorescence Probes in Red Region. Chem. Commun 47, 4162–4164. [DOI] [PubMed] [Google Scholar]
- (12).Prabavathy D, Swarnalatha Y, and Ramadoss N (2018) Lung Cancer Stem Cells—Origin, Characteristics and Therapy. Stem Cell Investig. 5, 6. [DOI] [PMC free article] [PubMed] [Google Scholar]
- (13).Leung EL-H, Fiscus RR, Tung JW, Tin VP-C, Cheng LC, Sihoe AD-L, Fink LM, Ma Y, and Wong MP (2010) Non-Small Cell Lung Cancer Cells Expressing CD44 Are Enriched for Stem Cell-Like Properties. PLoS One 5, No. e14062. [DOI] [PMC free article] [PubMed] [Google Scholar]
- (14).Hu B, Ma Y, Yang Y, Zhang L, Han H, and Chen J (2018) CD44 Promotes Cell Proliferation in Non-Small Cell Lung Cancer. Oncol. Lett 15, 5627–5633. [DOI] [PMC free article] [PubMed] [Google Scholar]
- (15).Koide Y, Urano Y, Hanaoka K, Terai T, and Nagano T (2011) Evolution of Group 14 Rhodamines as Platforms for Near-Infrared Fluorescence Probes Utilizing Photoinduced Electron Transfer. ACS Chem. Biol 6, 600–608. [DOI] [PubMed] [Google Scholar]
- (16).Kushida Y, Nagano T, and Hanaoka K (2015) Silicon-Substituted Xanthene Dyes and Their Applications in Bioimaging. Analyst 140, 685–695. [DOI] [PubMed] [Google Scholar]
- (17).Ikeno T, Nagano T, and Hanaoka K (2017) Silicon-Substituted Xanthene Dyes and Their Unique Photophysical Properties for Fluorescent Probes. Chem. - Asian J 12, 1435–1446. [DOI] [PubMed] [Google Scholar]
- (18).Rehm D, and Weller A (1970) Kinetics of Fluorescence Quenching by Electron and H-Atom Transfer. Isr. J. Chem 8, 259–271. [Google Scholar]
- (19).Umezawa K, Yoshida M, Kamiya M, Yamasoba T, and Urano Y (2017) Rational Design of Reversible Fluorescent Probes for Live-Cell Imaging and Quantification of Fast Glutathione Dynamics. Nat. Chem 9, 279–286. [DOI] [PubMed] [Google Scholar]
- (20).ALDH1A1. https://www.proteinatlas.org/ENSG00000165092-ALDH1A1/cell#human (accessed Oct 21, 2019).
Associated Data
This section collects any data citations, data availability statements, or supplementary materials included in this article.