Abstract
Controlled light-mediated delivery of biological analytes can enable the investigation of highly reactivity molecules within living systems. As many biological effects are concentration dependent, it is critical to determine the location, time, and quantity of analyte donation. In this work, we have developed the first photoactivatable donor for formaldehyde (FA). Our optimized photoactivatable donor, photoFAD-3, is equipped with a fluorescence readout that enables monitoring of FA release with a concomitant 139-fold fluorescence enhancement. Tuning of photostability and cellular retention enabled quantification of intracellular FA release through cell lysate calibration. Application of photoFAD-3 uncovered the concentration range necessary for arresting wound healing in live cells. This marks the first report where a photoactivatable donor for any analyte has been used to quantify intracellular release.
Chemical tools that enable controlled perturbation of complex biological networks represent a powerful approach for the mechanistic evaluation of biological signaling. For instance, enzyme inhibitors can disrupt metabolic pathways and alter the cellular levels of an associated analyte. Although direct supplementation of the cell culture media can yield the desired effect, this strategy precludes analytes that exhibit high reactivity and short biological lifetimes. To address these limitations, a diverse palette of donors based on spontaneous, enzymatic, and light-mediated activation have been designed to mask reactive analytes until release. The latter class, photoactivatable donors, provides the greatest control because the intensity of light, duration of irradiation, and focal point can be adjusted. Photoactivatable donors for reactive oxygen,1,2 nitrogen,3−7 sulfur,8−10 and carbonyl species,11−13 as well as metal ions,14 have been reported. Recent developments have led to photoactivatable donors equipped with the ability to monitor analyte release through fluorescence12,13,15−18 or photoacoustic19 readouts. Despite these advances we have recognized that there are two major voids in this area. First, there are no photoactivatable donors (with or without a readout) for biological aldehydes, such as formaldehyde (FA). Second, no studies have leveraged the unique monitoring capabilities of donors with internal readout to quantify analyte release within living systems.
Recently, mounting evidence has surfaced that suggests that FA is not merely a byproduct of cellular metabolism.20,21 On the contrary, FA was hypothesized to be a signaling molecule22 and has been shown to be involved in the synthesis of purines via the one-carbon cycle.23 At elevated levels (in the mM range)24 FA is associated with aging and pathologies ranging from cancer to Alzheimer’s disease.20,25,26 The cellular concentration that marks the transition from physiological to pathological roles of FA is currently unknown. In this work, we have developed a series of photoactivatable FA Donors (photoFADs) that are equipped with the ability to report on FA release via fluorescence enhancement. We selected the most suitable donor based on photouncaging kinetics, turn-on response, biocompatibility, subcellular localization, and cellular retention to evaluate the FA concentration range required to arrest wound healing in HEK293 cells.
Each of the photoFADs features a photolabile nitrobenzyl group connected to a silicon-xanthene dye through an acetal linkage (Figure 1a). Alkylated silicon-based fluorophores are nonfluorescent due to the perturbed electronic push-pull system, as well as donor-photoinduced electron transfer (d-PeT) quenching from the proximal nitro group.27 Irradiation with light induces cleavage of the photocage28 to afford an unstable hemiacetal intermediate that we hypothesize will spontaneously collapse to generate FA and the corresponding dye (Figure 1b). Our first-generation donor, photoFAD-1, displayed a 40-fold fluorescence signal enhancement following activation; however, photobleaching of the dye was observed, which would preclude reliable in cellulo quantification (Figures S1−S2). We reasoned that replacing the 2-methyl substituent on the pendent aryl ring with a trifluoromethyl moiety would lead to higher quantum yields and less photobleaching.29 The resultant donor, photoFAD-2, exhibited improved photo-stability, as well as greater fluorescence turn-on (205-fold) (Figure S3). Unfortunately, when photoFAD-2 was evaluated in HEK293 cells, we observed that the dye was not retained relative to the unactivated donor (Figure S4a). This was addressed in photoFAD-3 (Scheme 1) by installing electron-withdrawing chloro substituents on the silicon xanthene core to decrease the pKa of the phenol from 6.9 to 5.6 (Figure S5).30 This modification resulted in greater cellular retention because the dye is predominantly in an anionic state under physiological conditions, which reduces passive diffusion through the cell membrane.
Figure 1.
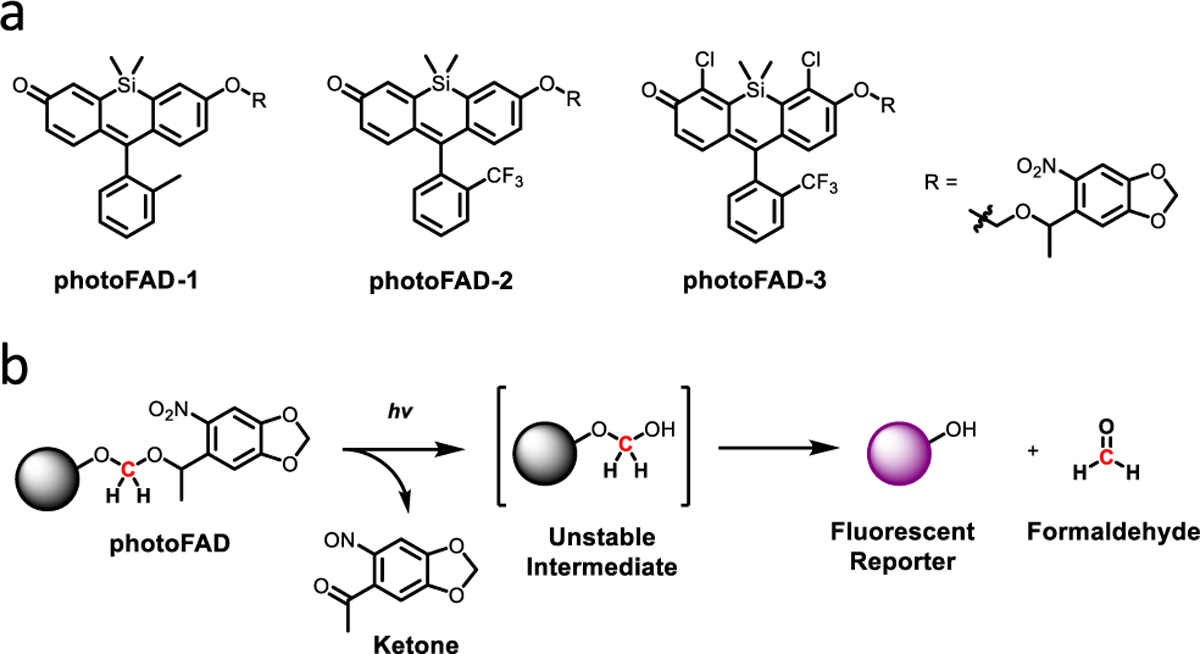
(a) Chemical structures of the photoFAD series. (b) Mechanism of light-mediated FA release.
Scheme 1.
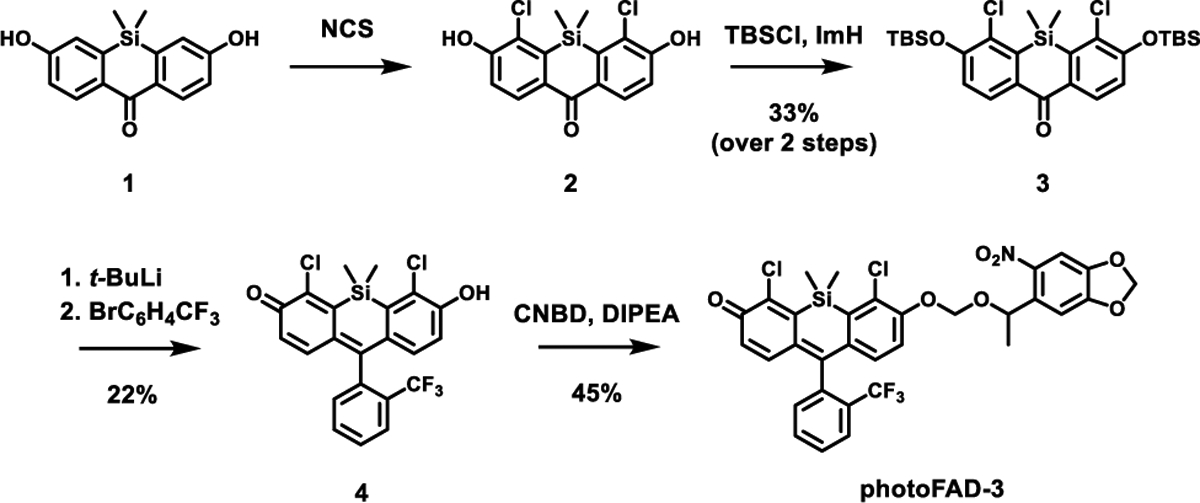
Synthesis of photoFAD-3
The synthesis of photoFAD-3 began with the chlorination of silicon xanthone 1 using N-chlorosuccinimide to yield 2. The free hydroxyl groups were protected as silyl ethers using tert-butyldimethylsilyl chloride to afford 3 in 33% over two steps. 1-Bromo-2-(trifluoromethyl)benzene was treated sequentially with tert-butyllithium and 3 to yield the dye 4 after acidic workup. Compound 4 was then alkylated with 5-[1-(chloromethoxy)ethyl]-6-nitro-1,3-benzodioxole (CNDB) to afford photoFAD-3 in 45% yield.
In vitro characterization of photoFAD-3 revealed that it is nonfluorescent in its unactivated form (Figure 2a). The quantum yield of 4 on the other hand was determined to be 60% (Table S1). This corresponds to a 139-fold fluorescence turn-on response in vitro (krelease = 137 nM/min) (Figure 2b and 2c). Irradiation with light over 30 min did not cause significant photobleaching (Figure S2). Of note, the total exposure to light does not exceed 3 min in our experiments. When activated a 10.4-fold fluorescence enhancement was observed in HEK293 cells (Figure S6). Moreover, we demonstrate spatial control by activating photoFAD-3 in a small area within a larger field of cells (Figure S7).
Figure 2.
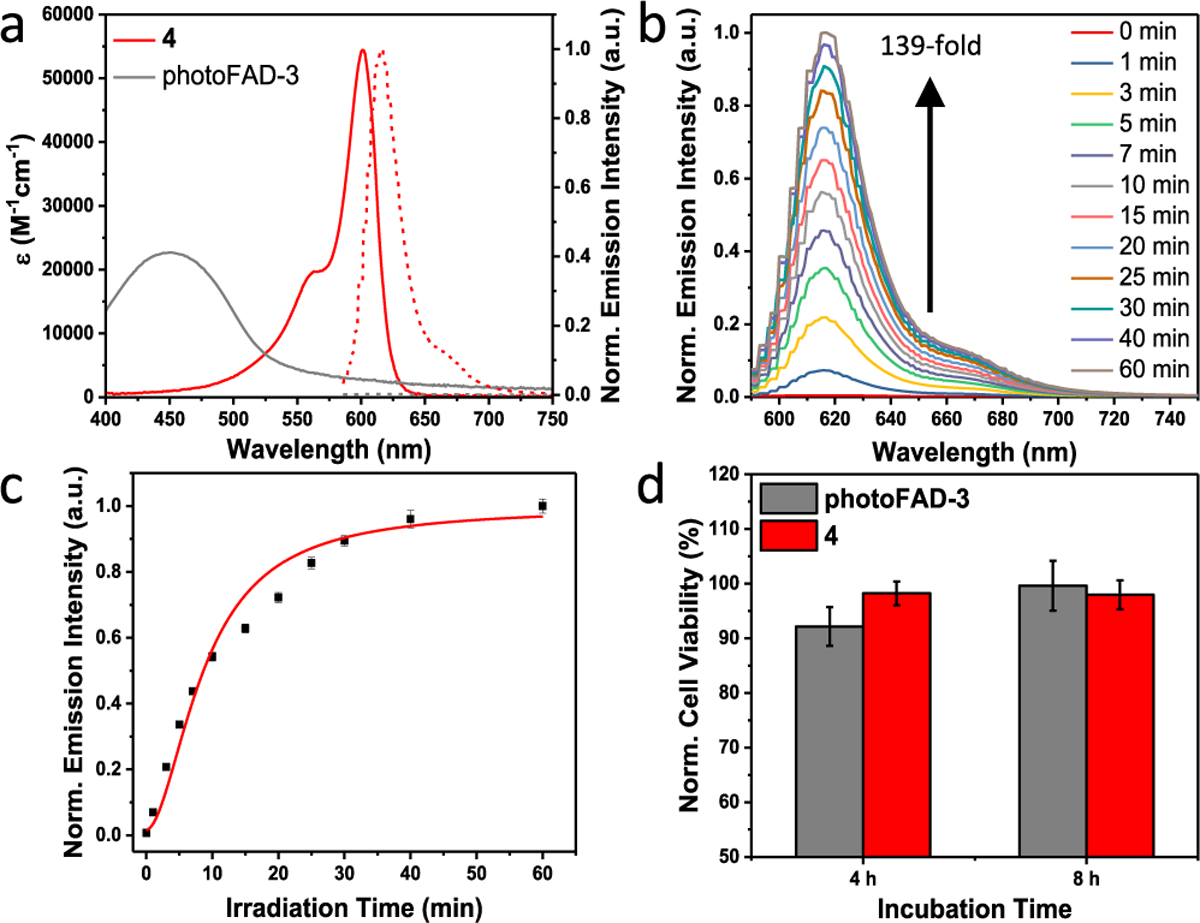
(a) Absorbance (solid) and emission (dashed) spectra of 2 μM photoFAD-3 and 4. (b) Emission spectra and (c) release kinetics of photoFAD-3 upon photoactivation over 60 min. (d) Cytotoxicity assay of HEK293 cells stained with 4 μM photoFAD-3 and 4 for 4 and 8 h. Cell viability was normalized to a vehicle control. Data are represented as mean ± SD (n = 3).
Owing to the novel combination of the photolabile nitrobenzyl group, acetal linkage, and fluorescent dye it was essential to verify that FA was being released upon photolysis. To address this, we performed mass spectrometry analysis on an activated solution of photoFAD-3. The experimental results confirmed release of 4 (m/z = 467.3) (Figure S8). Furthermore, we confirmed the formation of FA using an isotopologue of photoFAD-3 (13C-photoFAD-3). Activation of 13C-photoFAD-3 in deuterated methanol resulted in a 13C NMR signal at 91.10 ppm, which corresponds to the resonance of the hemiacetal species in methanol (Figure S9).31
Prior to application in live cells, we evaluated its chemo- and photostability. Neither prolonged incubation with a serum-containing medium (Figure S10a) nor exposure to ambient light (Figure S10b) resulted in significant activation. Additionally, photoFAD-3 was stable against a panel of thiols and reactive oxygen species (Figure S11a), as well as across a range of pH values (Figure S11b). We were delighted to observe that photoFAD-3 and 4 did not induce any notable cytotoxicity in HEK293 cells (Figure 2d) and that both compounds are localized in the cytoplasm (Figure S12).
We next turned our attention to establishing a protocol to quantify FA release from photoFAD-3 in living systems. Specifically, photoFAD-3-stained HEK293 cells were subjected to different irradiation times and imaged using fluorescence microscopy (Figure 3a). The cells were then lysed, and the signal was quantified using fluorescence spectroscopy (Figure S14a). Compound 4 was used to establish a calibration curve to correlate the intensity of the cell lysates to a known concentration of 4 (Figure S14b). By determining the number of cells within each sample, we were able to calculate the FA concentration released per cell at different irradiation times (eq S1). For instance, 6.20 attomol (10−18) of FA were released in a single cell upon 3 min of photoactivation. We determined the average diameter of HEK293 cells in suspension to be ~14.5 μm, which corresponds to a cell volume of ~1.60 pL (10−12). Using this information, we determined that 4.0 μM FA was released inside each cell after 180 s of irradiation, assuming that the resultant FA will persist throughout activation. It is important to note that our quantification procedure is not limited to fluorescence microscopy. For example, we were able to perform experiments with an IVIS fluorescence imager with a larger imaging window (e.g., the entire well of a 6-well plate) (Figure 3b). Results from these experiments were consistent with those obtained using a fluorescence microscope (3.9 μM increase of FA concentration upon 3 min of photoactivation). Together, these experiments highlight the utility of photoFAD-3 for consistent results across multiple imaging platforms.
Figure 3.
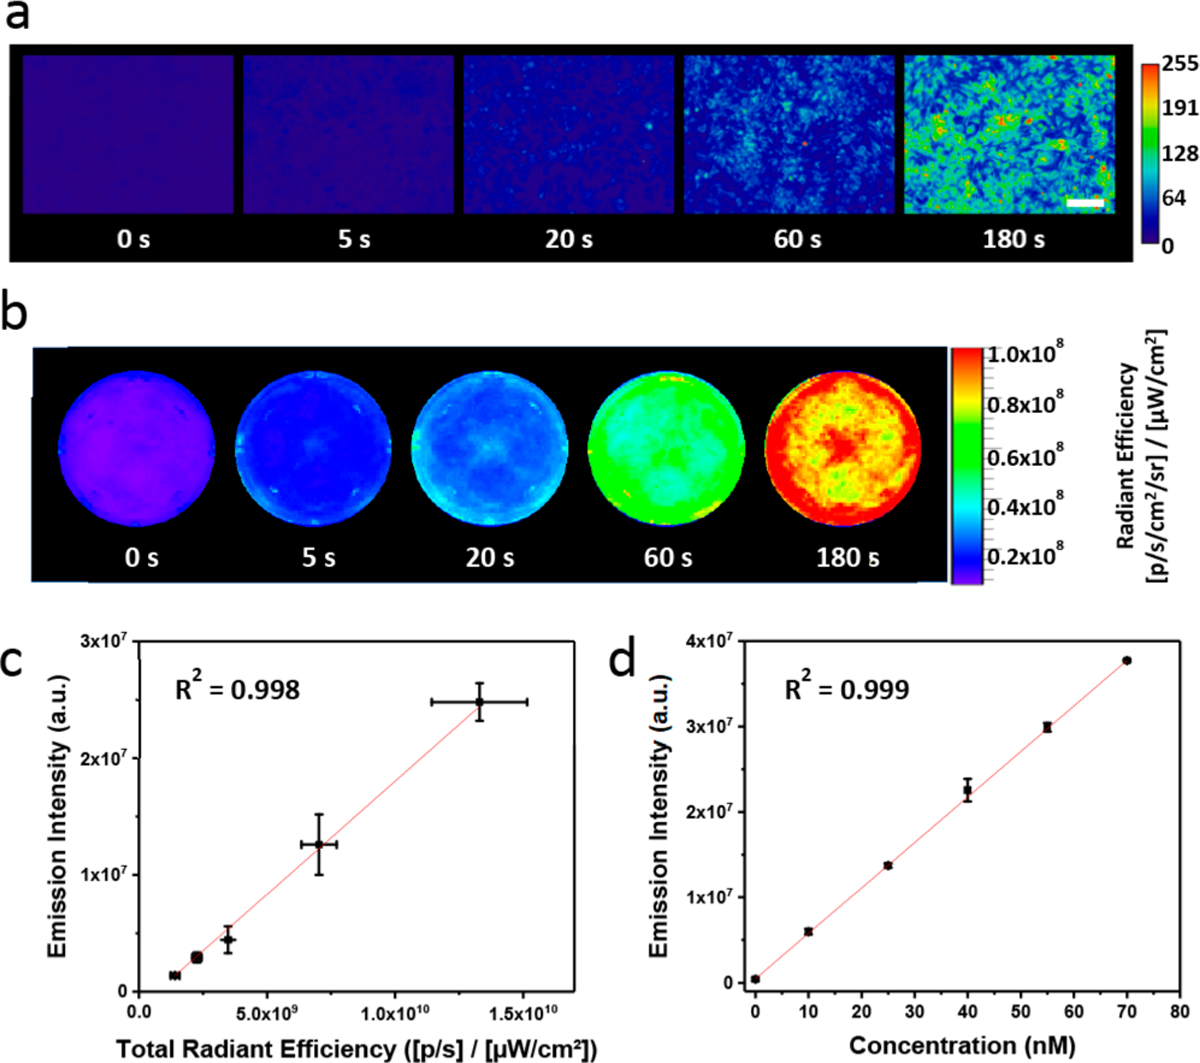
(a) Epifluorescence and (b) IVIS images of HEK293 cells stained with photoFAD-3 after 0, 5, 20, 60, and 180 s of photoactivation. Scale bar represents 100 μm. (c) Correlation plot of in vitro cell lysate fluorescence versus total radiant efficiency. (d) Reference plot of in vitro fluorescence versus concentration of 4. Data are represented as mean ± SD (n = 3).
Finally, we applied photoFAD-3 to determine the threshold required to exceed the cell’s ability to detoxify FA. For these studies we synthesized a control reagent (Ctrl-photoFAD-3) consisting of the dye connected directly to the nitrobenzyl photocage. Because Ctrl-photoFAD-3 does not feature the acetal linkage found in photoFAD-3, irradiation releases only the dye and the photocage fragment but not FA (Figures S15a, S16). Confluent HEK293 cells were stained with CtrlphotoFAD-3 or photoFAD-3 and irradiated (0–180 s). These cells were subsequently used for a wound healing assay which reports on cell migration and proliferation. The rate of wound closure was monitored over the course of 24 h (Figure 4a). We did not observe any effect on wound healing when Ctrl-photoFAD-3 was activated (Figure S17). In contrast, activation of photoFAD-3 resulted in an irradiation time-dependent decrease of wound healing (Figure 4b). Specifically, FA concentrations below 2.2 μM per cell did not significantly affect recovery, whereas higher concentrations resulted in a decreased propensity to close the wound. At the longest irradiation time, cells lost their ability to adhere to the plate (Figure 4c). Moreover, dose-dependent activation of Ctrl-photoFAD-3 strongly suggests that the nitrosoacetophe-none byproduct and the released dye do not have an apparent impact on wound healing (Figure S18).
Figure 4.
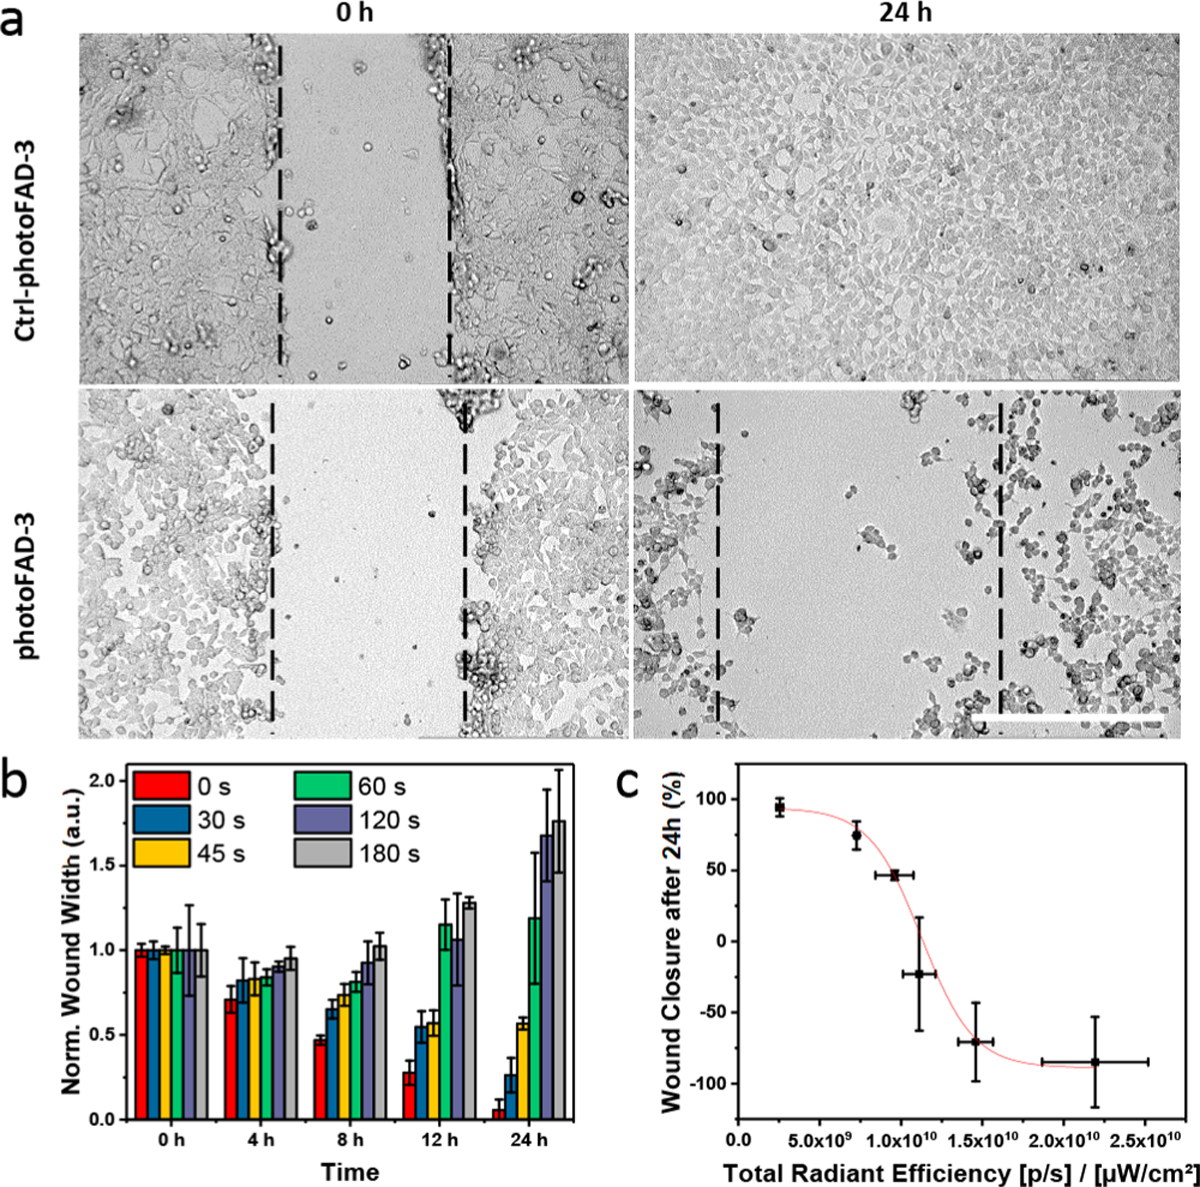
Wound healing assay of HEK293 cells upon treatment with 5 μM Ctrl-photoFAD-3 or photoFAD. (a) Microscopy images at 0 and 24 h after 180 s irradiation. Scale bar (white) represents 400 μm. (b) Dose-dependent release of FA and the impact on wound healing over 24 h for photoFAD-3. (c) Correlation plot of total radiant efficiency versus wound closure after 24 h. Data are represented as mean ± SD (n = 3).
Inspired by these results, we explored whether common prodrug and probe delivery strategies that release FA through esterase-mediated cleavage of masking groups (e.g., acetoxymethyl (AM) ether) would yield similar results.32 This led to the design of AM-FAD-3 that consists of the dye capped with an AM ether group (Figure S15b). Incubation of HEK293 cells with AM-FAD-3 under standard conditions did in fact impair wound healing to the same extent (Figure S19). This observation indicates that FA-releasing masking groups could aid drug efficacy through a secondary effect beyond simple increase of bioavailability, if FA levels overwhelm the intracellular detoxification mechanisms.
In conclusion, we have developed the first photoactivatable FA donor that enables perturbation of intracellular FA levels with high spatiotemporal control. This is the first report where a photoactivatable donor equipped with a reporter has been used to quantify in cellulo release. Prior to this work, calibration was only performed in vitro which does not indicate how much of an analyte is being delivered into cells. Our quantification approach is readily compatible with various instruments. We were able to reveal that an increase of 2.2 μM FA is sufficient to impair wound healing for HEK293 cells. Additionally, we were able to show that intracellular FA buildup through cleavage of prodrug masking groups can reach this concentration range, which could enhance observable drug efficacy. Our future work will focus on the use of photoFAD-3 to study the role of FA in stem cell aging. In addition to providing a tool to study FA biology, we envision this work will set a new standard of using the readout of photoactivatable donors to determine the concentration of cellular release.
Supplementary Material
ACKNOWLEDGMENTS
This work was supported the National Institutes of Health (R35GM133581). N.W.P. and G.E.I. acknowledge the Chemistry-Biology Interface Training Grant (T32 GM070421) and the Alfred P. Sloan Foundation for financial support. N.W.P. thanks Dr. Robert C. and Mrs. Carolyn J. Springborn for a graduate fellowship. G.E.I. thanks the National Consortium for Graduate Degrees for Minorities in Engineering & Science for a graduate fellowship. Major funding for the 500 MHz Bruker CryoProbeTM was provided by the Roy J. Carver Charitable Trust (Muscatine, Iowa; Grant No. 15-4521) to the School of Chemical Sciences NMR Lab. The Q-Tof Ultima mass spectrometer was purchased in part with a grant from the National Science Foundation, Division of Biological Infrastructure (DBI-0100085). We also acknowledge the Core Facilities at the Carl R. Woese Institute for Genomic Biology for access to the Zeiss LSM 700 confocal microscope and corresponding software. We acknowledge Dr. Iwona Dobrucka and the Molecular Imaging Laboratory at the Beckman Institute for use of the IVIS imaging system. We thank Mr. Lucas D. Akin for aid with mass spectrometry experiments, Prof. Paul J. Hergenrother and Mr. Matthew Boudreau for assistance with apoptotic assays, Prof. Kai Zhang for help with construction of an LED array, and Ms. Ashley Chan for the design of the graphical abstract.
Footnotes
Supporting Information
The Supporting Information is available free of charge at https://pubs.acs.org/doi/10.1021/jacs.9b11899.
Details regarding the materials, instrumentation, data processing, synthetic procedures as well as NMR spectra, supporting figures, tables, and equations PDF)
The authors declare no competing financial interest.
REFERENCES
- (1).Miller EW; Taulet N; Onak CS; New EJ; Lanselle JK; Smelick GS; Chang CJ Light-Activated Regulation of Cofilin Dynamics Using a Photocaged Hydrogen Peroxide Generator. J. Am. Chem. Soc 2010, 132 (48), 17071–17073. [DOI] [PMC free article] [PubMed] [Google Scholar]
- (2).Sharma AK; Singh H; Chakrapani H Photocontrolled Endogenous Reactive Oxygen Species (ROS) Generation. Chem. Commun 2019, 55 (36), 5259–5262. [DOI] [PubMed] [Google Scholar]
- (3).Makings LR; Tsien RY Caged Nitric Oxide. J. Biol. Chem 1994, 269 (9), 6282–6285. [PubMed] [Google Scholar]
- (4).Namiki S; Arai T; Fujimori K High-Performance Caged Nitric Oxide: A New Molecular Design, Synthesis, and Photochemical Reaction. J. Am. Chem. Soc 1997, 119 (16), 3840–3841. [Google Scholar]
- (5).Suzuki T; Nagae O; Kato Y; Nakagawa H; Fukuhara K; Miyata N Photoinduced Nitric Oxide Release from Nitrobenzene Derivatives. J. Am. Chem. Soc 2005, 127 (33), 11720–11726. [DOI] [PubMed] [Google Scholar]
- (6).Hishikawa K; Nakagawa H; Furuta T; Fukuhara K; Tsumoto H; Suzuki T; Miyata N Photoinduced Nitric Oxide Release from a Hindered Nitrobenzene Derivative by Two-Photon Excitation. J. Am. Chem. Soc 2009, 131 (22), 7488–7489. [DOI] [PubMed] [Google Scholar]
- (7).Ieda N; Hotta Y; Miyata N; Kimura K; Nakagawa H Photomanipulation of Vasodilation with a Blue-Light-Controllable Nitric Oxide Releaser. J. Am. Chem. Soc 2014, 136 (19), 7085–7091. [DOI] [PubMed] [Google Scholar]
- (8).Devarie-Baez NO; Bagdon PE; Peng B; Zhao Y; Park CM; Xian M Light-Induced Hydrogen Sulfide Release from “Caged” Gem-Dithiols. Org. Lett 2013, 15 (11), 2786–2789. [DOI] [PMC free article] [PubMed] [Google Scholar]
- (9).Fukushima N; Ieda N; Sasakura K; Nagano T; Hanaoka K; Suzuki T; Miyata N; Nakagawa H Synthesis of a Photocontrollable Hydrogen Sulfide Donor Using Ketoprofenate Photocages. Chem. Commun 2014, 50 (5), 587–589. [DOI] [PubMed] [Google Scholar]
- (10).Zhao Y; Bolton SG; Pluth MD Light-Activated COS/H2S Donation from Photocaged Thiocarbamates. Org. Lett 2017, 19 (9), 2278–2281. [DOI] [PubMed] [Google Scholar]
- (11).Pierri AE; Pallaoro A; Wu G; Ford PC A Luminescent and Biocompatible PhotoCORM. J. Am. Chem. Soc 2012, 134 (44), 18197–18200. [DOI] [PubMed] [Google Scholar]
- (12).Antony LAP; Slanina T;Šebej P;Šolomek T; Klán P Fluorescein Analogue Xanthene-9-Carboxylic Acid: A Transition-Metal-Free CO Releasing Molecule Activated by Green Light. Org. Lett 2013, 15 (17), 4552–4555. [DOI] [PubMed] [Google Scholar]
- (13).Palao E; Slanina T; Muchová L;Šolomek T; Vítek L; Klán P Transition-Metal-Free CO-Releasing BODIPY Derivatives Activatable by Visible to NIR Light as Promising Bioactive Molecules. J. Am. Chem. Soc 2016, 138 (1), 126–133. [DOI] [PubMed] [Google Scholar]
- (14).Adams SR; Lec-Ram V; Tsien RY A New Caged Ca2+, Azid-1, Is Far More Photosensitive than Nitrobenzyl-Based Chelators. Chem. Biol 1997, 4 (11), 867–878. [DOI] [PubMed] [Google Scholar]
- (15).Zhang Z; Wu J; Shang Z; Wang C; Cheng J; Qian X; Xiao Y; Xu Z; Yang Y Photocalibrated NO Release from NNitrosated Napthalimides upon One-Photon or Two-Photon Irradiation. Anal. Chem 2016, 88 (14), 7274–7280. [DOI] [PubMed] [Google Scholar]
- (16).Soboleva T; Esquer HJ; Benninghoff AD; Berreau LM Sense and Release: A Thiol-Responsive Flavonol-Based Photonically Driven Carbon Monoxide-Releasing Molecule That Operates via a Multiple-Input and Logic Gate. J. Am. Chem. Soc 2017, 139 (28), 9435–9438. [DOI] [PubMed] [Google Scholar]
- (17).He H; Ye Z; Xiao Y; Yang W; Qian X; Yang Y Super-Resolution Monitoring of Mitochondrial Dynamics upon Time-Gated Photo-Triggered Release of Nitric Oxide. Anal. Chem 2018, 90 (3), 2164–2169. [DOI] [PubMed] [Google Scholar]
- (18).Venkatesh Y; Das J; Chaudhuri A; Karmakar A; Maiti TK; Singh NDP Light Triggered Uncaging of Hydrogen Sulfide (H2S) with Real-Time Monitoring. Chem. Commun 2018, 54 (25), 3106–3109. [DOI] [PubMed] [Google Scholar]
- (19).Zhou EY; Knox HJ; Reinhardt CJ; Partipilo G; Nilges MJ; Chan J Near-Infrared Photoactivatable Nitric Oxide Donors with Integrated Photoacoustic Monitoring. J. Am. Chem. Soc 2018, 140 (37), 11686–11697. [DOI] [PMC free article] [PubMed] [Google Scholar]
- (20).Tulpule K; Dringen R Formaldehyde in Brain: An Overlooked Player in Neurodegeneration? J. Neurochem 2013, 127 (1), 7–21. [DOI] [PubMed] [Google Scholar]
- (21).Reingruber H; Pontel LB Formaldehyde Metabolism and Its Impact on Human Health. Curr. Opin. Toxicol 2018, 9, 28–34. [Google Scholar]
- (22).Cao Y; Lu ZS; Qiao Y; Wang L; He HJ; Yang X; Li CM A New Hypothesis of Endogenous Formaldehyde as a Novel Signaling Molecule. Proc. Indoor Air 2005, 450, 3822–3826. [Google Scholar]
- (23).Burgos-Barragan G; Wit N; Meiser J; Dingler FA; Pietzke M; Mulderrig L; Pontel LB; Rosado IV; Brewer TF; Cordell RL; Monks PS; Chang CJ; Vazquez A; Patel KJ Mammals Divert Endogenous Genotoxic Formaldehyde into One-Carbon Metabolism. Nature 2017, 548 (7669), 549–554. [DOI] [PMC free article] [PubMed] [Google Scholar]
- (24).Tong Z; Zhang J; Luo W; Wang W; Li F; Li H; Luo H; Lu J; Zhou J; Wan Y; He R Urine Formaldehyde Level Is Inversely Correlated to Mini Mental State Examination Scores in Senile Dementia. Neurobiol. Aging 2011, 32 (1), 31–41. [DOI] [PubMed] [Google Scholar]
- (25).Pontel LB; Rosado IV; Burgos-Barragan G; Garaycoechea JI; Yu R; Arends MJ; Chandrasekaran G; Broecker V; Wei W; Liu L; Swenberg JA; Crossan GP; Patel KJ Endogenous Formaldehyde Is a Hematopoietic Stem Cell Genotoxin and Metabolic Carcinogen. Mol. Cell 2015, 60 (1), 177–188. [DOI] [PMC free article] [PubMed] [Google Scholar]
- (26).Lai Y; Yu R; Hartwell HJ; Moeller BC; Bodnar WM; Swenberg JA Measurement of Endogenous versus Exogenous Formaldehyde-Induced DNA-Protein Crosslinks in Animal Tissues by Stable Isotope Labeling and Ultrasensitive Mass Spectrometry. Cancer Res. 2016, 76 (9), 2652–2661. [DOI] [PMC free article] [PubMed] [Google Scholar]
- (27).Egawa T; Koide Y; Hanaoka K; Komatsu T; Terai T; Nagano T Development of a Fluorescein Analogue, TokyoMagenta, as a Novel Scaffold for Fluorescence Probes in Red Region. Chem. Commun 2011, 47 (14), 4162–4164. [DOI] [PubMed] [Google Scholar]
- (28).Il’ichev YV; Schwörer MA; Wirz J Photochemical Reaction Mechanisms of 2-Nitrobenzyl Compounds: Methyl Ethers and Caged ATP. J. Am. Chem. Soc 2004, 126 (14), 4581–4595. [DOI] [PubMed] [Google Scholar]
- (29).Dodani SC; Firl A; Chan J; Nam CI; Aron AT; Onak CS; Ramos-Torres KM; Paek J; Webster CM; Feller MB; Chang CJ Copper Is an Endogenous Modulator of Neural Circuit Spontaneous Activity. Proc. Natl. Acad. Sci. U. S. A 2014, 111 (46), 16280–16285. [DOI] [PMC free article] [PubMed] [Google Scholar]
- (30).Egawa T; Hirabayashi K; Koide Y; Kobayashi C; Takahashi N; Mineno T; Terai T; Ueno T; Komatsu T; Ikegaya Y; Matsuki N; Nagano T; Hanaoka K Red Fluorescent Probe for Monitoring the Dynamics of Cytoplasmic Calcium Ions. Angew. Chem., Int. Ed 2013, 52 (14), 3874–3877. [DOI] [PubMed] [Google Scholar]
- (31).Hahnenstein I; Hasse H; Kreiter CG; Maurer G 1H- and 13C-NMR-Spectroscopic Study of Chemical Equilibria in Solutions of Formaldehyde in Water, Deuterium Oxide, and Methanol. Ind. Eng. Chem. Res 1994, 33 (4), 1022–1029. [Google Scholar]
- (32).Schultz C Prodrugs of Biologically Active Phosphate Esters. Bioorg. Med. Chem 2003, 11 (6), 885–898. [DOI] [PubMed] [Google Scholar]
Associated Data
This section collects any data citations, data availability statements, or supplementary materials included in this article.


