

Abstract
We did a comparative analysis of the gene expression profiles of the hippocampus from sleep deprivation and Alzheimer’s disease (AD) mice. Differentially expressed genes (DEGs) were identified by comparing the transcriptome profiles of the hippocampus of sleep deprivation or AD mouse models to matched controls. The common DEGs between sleep deprivation and AD were identified by the overlapping analysis, followed by Gene Ontology (GO) and Kyoto Encyclopedia of Genes and Genomes (KEGG) analyses. The results showed that a total of 16 common DEGs showed similar change patterns in both sleep deprivation mice and AD mice. Sgk1, Ly6a, Atp6v0e, Hspb8, Htra1, Pdk4, Pfkfb3, Golm1, and Plin3 were up-regulated in the two disorders, whereas, Marcksl1, Fgd1, Scarb1, Mvd, Klhl13, Elovl2, and Vps29 were down-regulated. Acetyl-CoA metabolic process and lipid biosynthetic process were significantly enriched by those DEGs. The highly expressed DEGs and the two GO terms were associated with neuropathological changes according to the previous studies. As expected, sleep deprivation may contribute the AD development through these common DEGs.
Keywords: Sleep deprivation, Alzheimer’s disease, hippocampus, Acetyl-CoA, lipid
Introduction
Alzheimer’s disease (AD), a common age-related progressive neurodegenerative disease, is characterized by progressive neuronal loss in the hippocampus and cortex, with the accumulation in the brain of extracellular neuritic plaques caused by β-amyloid (Aβ) peptides as well as intracellular neurofibrillary tangles induced by hyperphosphorylated tau proteins, resulting in irreversible memory loss and declined cognitive functioning (Chen et al., 2017; Area-Gomez et al., 2018). Clinical studies report that up to 45% of patients suffer from sleep disturbances as well as sleep-wake rhythm disturbances, which tends to be one of the earliest symptoms in the development of AD (Peter-Derex et al., 2015). Recently, human and transgenic animal studies show that amyloid deposition and tau aggregation directly cause sleep impairment (Roh et al., 2012; Mander et al., 2015). Besides, dysfunction of neurotransmitter systems responsible for sleep including the cholinergic system, and physiological alterations in the suprachiasmatic nucleus (SCN) and pineal gland, as well as reduction of precuneus volume have been reported to be associated with sleep disturbance in patients with AD (Sarter and Bruno, 1997; Wu and Swaab, 2007; Matsuoka et al., 2018). Therefore, sleep deprivation is initially considered to be a biomarker of a subclinical neurodegenerative process, such as AD.
Recently, many studies demonstrate a relationship between sleep deprivation and AD that sleep deprivation is not only a simple biomarker of AD but a direct contributor to its pathogenesis (Di Meco et al., 2014). Patients with mild cognitive impairment, the early stage of AD, have sleep disturbance before any cognitive impairment, suggesting sleep disturbance may precede clinical diagnosis of AD years in advance (Hita-Yanez et al., 2012; Westerberg et al., 2012). The previous study concludes that sleep deprivation has high comorbidity with many neurodegenerative disorders (Vecsey et al., 2012). Clinical studies show that sleep deprivation increases cerebral Aβ production, and in AβPPswe/PS1∆E9 transgenic mouse model of AD, extended wakefulness results in more Aβ plaques deposition (Kang et al., 2009; Slats et al., 2013). Also, sleep deprivation is correlated with Glycogen synthase kinase 3 (GSK3) activation, which causes the phosphorylation of tau and the formation of neurofibrillary tangles (Benedetti et al., 2004). In A βPPswe/PS1∆E9 transgenic mice, chronic sleep deprivation induces an increased number of p-tau (T231) positive neurons and p-tau (T231) protein level, and these pathological alterations still remain even three months after sleep deprivation termination (Qiu et al., 2016). Furthermore, sleep deprivation also contributes to a striking neuronal mitochondrial damage, caspase cascade activation, and neuronal apoptosis in the hippocampus which are all associated with the pathogenesis of AD (Qiu et al., 2016; Area-Gomez et al., 2018). These similar pathological alterations suggest sleep deprivation may be a risk factor for AD development.
The hippocampus plays a crucial role in the formation of spatial, contextual, and declarative memories (Morris et al., 2003), and it is one of the first regions in the brain to suffer damage during AD progression (Braak and Braak, 1991; Braak et al., 1993; Greene and Killiany, 2012). A recent study reports sleep deprivation disrupts hippocampal function and synaptic plasticity, a neural correlate of memory (Prince et al., 2014). It is well-known that sleep deprivation impairs memory, and hippocampus-dependent memory consolidation is particularly sensitive to sleep loss (Porter et al., 2012). The consolidation of memories includes synaptic consolidation and systems consolidation, both of which can be regulated by sleep deprivation (Havekes and Abel, 2017). Thus, the hippocampus may be an important region on memory impairment caused by both sleep deprivation and AD, and the similarities and differences in molecular impacts of the two disorders on hippocampal function should be deserving of attention.
Recent findings have identified several signaling pathways and molecules affected by sleep deprivation or AD in the hippocampus (Polito et al., 2014). However, the related mechanism remains unclear. Here, we compared the gene expression profiles of the hippocampus of sleep deprivation or AD mouse models to its matched controls and identified the conserved differentially expressed genes (DEGs) between them. These common DEGs may be the potential molecular targets involved in the underlying mechanisms.
Materials and Methods
Datasets information
Two Gene Expression Omnibus (GEO) datasets were downloaded. GSE53480 dataset included gene expression data of hippocampus from rTg4510 Tau transgenic mice and the littermate wild-type mice. Both of the AD mice models and control mice were C57BL/6J strains (Polito et al., 2014). Mice were euthanized at 4 months of age. GSE33302 dataset included gene expression data of hippocampus from sleep deprivation mice and time-matched non-sleep-deprived control mice. C57BL/6J mice (2-4 months of age) were housed individually on a 12 h/ 12 h light-dark schedule with lights on at 7 am which is set as Zeitgeber time (ZT) 0 (Vecsey et al., 2012). Each mouse was handled daily for 3-6 days before sleep deprivation. Sleep deprivation began between ZT4 and 6 and carried out in the mice’s home cages for5h by gentle handling. Hippocampal dissections were performed immediately following the behavioral treatment.
Identification of DEGs
All data were extracted and downloaded from Series Matrix File(s). R software was used to pre-process the data via background correction and quantile normalization. “Impute” package (Hastie et al., 2011), a package of R, was applied to complement the missing expression by using the adjacent value. Then, we obtained a file containing available Entrez Gene identifiers and their corresponding expression values.
Limma package, a package of R, was used to identify DEGs in AD mice or sleep deprivation mice compared with their control mice by using empirical Bayes (eBayes) method (Smyth, 2005). The log2 (fold change) of each gene was calculated. To correct for multiple testing, the `fdr’ function was used to adjust the p-value of each gene by using the Benjamini and Hochberg’s approach to control the false discovery rate. Log2(fold change) >0.15 and p <0.05 were set as the threshold. We used sva R package to decrease the Batch effect of GSE53480 and GSE33302 in the previous Differentially Expressed Genes (DEGs) Analysis.
To identify the common DEGs changed in both AD mice and sleep deprivation mice, we overlapped the whole DEGs in the two disorders. And common DEGs showing similar change patterns in the two disorders were further sorted out.
Functional enrichment analysis
The common DEGs showing similar change patterns in the two disorders were used to analyzing functional enrichment analysis by using GO.db (Harris et al., 2004), KEGG.db (Organizer and Goode, 2008) and KEGG REST, R packages. The threshold for significantly enriched GO biological processes and KEGG pathways was set as p-value <0.05.
Results
Identification of DEGs in Alzheimer’s disease (AD)
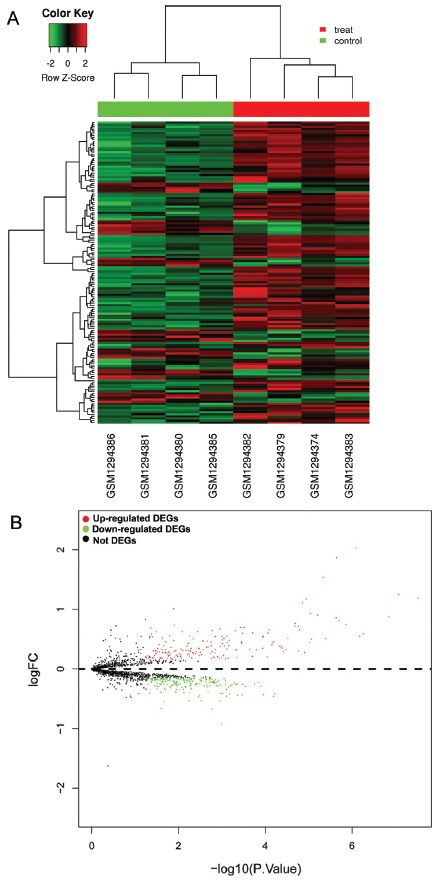
GSE53480 dataset including gene expression data of hippocampus from the rTg4510 Tau transgenic mouse models (AD mouse models) and wild-type mice was downloaded and analyzed. Compared to wild-type mice, 382 DEGs were identified in rTg4510 mice hippocampus, at a threshold of p value <0.05 and log2(fold change) >0.15, including 180 up-regulated DEGs and 202 down-regulated DEGs (top 50 up-regulated DEGs were shown in Table 1). The cluster analysis showed the expression level of each gene in each sample. In the heat map, the left four columns represent samples from wild-type mice, and the right four columns represent samples from rTg4510 mice) (Figure 1A). The volcano plot revealed the p-value and log2 (fold change) of each gene in rTg4510 mice compared with wild-type mice, and the green and red points represent DEGs (Figure 1B).
Table 1. The top 50 up-regulated DEGs in AD mice compared with wild-type mice.
| DEGs | Log FC | p-value |
|---|---|---|
| Ccl6 | 2.654661 | 1.01E-05 |
| C1qb | 2.037188 | 8.02E-07 |
| C1qa | 1.869896 | 2.23E-06 |
| Cd14 | 1.536667 | 4.49E-06 |
| Ctsc | 1.254297 | 8.38E-08 |
| Man2b1 | 1.190078 | 2.97E-08 |
| Irf8 | 1.171094 | 1.11E-05 |
| Cd9 | 1.110365 | 1.34E-05 |
| Serping1 | 1.010443 | 0.012721 |
| Lcp1 | 0.933281 | 8.77E-06 |
| Srgn | 0.904922 | 6.09E-06 |
| Npc2 | 0.871771 | 1.40E-07 |
| Itgb5 | 0.858255 | 2.27E-06 |
| Serpinf1 | 0.806563 | 1.91E-06 |
| Clic1 | 0.765182 | 2.00E-05 |
| Tnfrsf1a | 0.747682 | 1.35E-06 |
| Rnase1 | 0.735547 | 0.012204 |
| Nfe2l2 | 0.718568 | 2.04E-05 |
| Sparc | 0.713255 | 1.68E-05 |
| Lamp2 | 0.699453 | 0.000296 |
| Sgk1 | 0.697813 | 0.000358 |
| Vsir | 0.694245 | 0.00031 |
| Bgn | 0.683047 | 0.042412 |
| Kcne1l | 0.669245 | 0.001091 |
| Pmp22 | 0.655938 | 1.58E-05 |
| Rgs10 | 0.65401 | 8.01E-05 |
| Slc22a4 | 0.644583 | 0.001629 |
| Aldh1a1 | 0.641849 | 0.000484 |
| Hist1h1c | 0.631302 | 0.003537 |
| Ctla2b | 0.625781 | 0.007986 |
| Ifitm2 | 0.622005 | 0.031678 |
| Tspo | 0.603073 | 0.000192 |
| Prnp | 0.601172 | 8.51E-05 |
| Gsn | 0.598828 | 0.000327 |
| Sdc4 | 0.589219 | 5.40E-07 |
| Cp | 0.588932 | 0.040956 |
| Magel2 | 0.555638 | 0.015686 |
| Cpq | 0.552448 | 0.005398 |
| Hspb8 | 0.549844 | 0.000749 |
| Creg1 | 0.548932 | 6.59E-07 |
| Apoc1 | 0.547526 | 0.000109 |
| Lox | 0.546016 | 0.000962 |
| Apod | 0.546016 | 0.044451 |
| Lsp1 | 0.545156 | 0.001374 |
| Emp1 | 0.538203 | 0.038335 |
| Gm5637 | 0.535807 | 0.000113 |
| Cyp1b1 | 0.522734 | 0.045007 |
| Serpinf2 | 0.51612 | 0.023 |
| Tubb6 | 0.51375 | 2.96E-05 |
| Id3 | 0.513594 | 0.000866 |
Figure 1. The DEGs in AD mice compared with wild-type mice. A: Heat map analysis. B: Volcano plot analysis. Green represents down-regulated.DEGs, red represents up-regulated DEGs.
Among these DEGs, Complement C1q Subcomponent Subunit B (C1qb) and Cluster of differentiation 14 (Cd14) were highly expressed in AD mouse models compared with wild-type mice. A previous study also showed an increased level of C1qb in the senescence-accelerated mouse/prone 8 (SAMP8), a suitable animal model to investigate the fundamental mechanisms of age-related learning and memory deficits, and after treated with Huang-Lian-Jie-Du decoction which has the ability to ameliorate the learning and memory function of central nervous system, C1qb was decreased (Lu et al., 1998), suggesting that overexpression of C1qb may be closely associated with memory impairment. CD14 is a critical regulator of the microglial inflammatory response modu lating Aβ deposition, and deletion of CD14 attenuates AD pathology, suggesting its overexpression is also a risk factor for AD (Bi et al., 2017).
Determination of differentially expressed genes in sleep deprivation
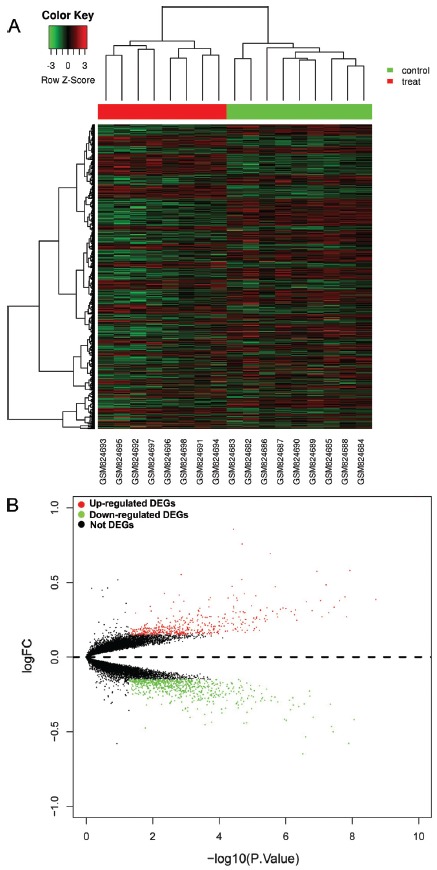
GSE33302 dataset, including gene expression data of hippocampus from sleep-deprived mice and time-matched non-sleep-deprived control mice, was analyzed. Compared to control mice, a total of 1149 genes were differentially expressed in sleep deprivation mice at a threshold of p-value <0.05 and log2(fold change) >0.15, which consisted of 470 up-regulated genes and 679 down-regulated genes (top 50 up-regulated DEGs were shown in Table 2). A heat map showing the expression levels of all 1149 DEGs were generated. The left eight columns represent samples from sleep deprivation mice, and the right nine columns represent samples from non-sleep-deprived control mice (Figure 2A). The volcano plot revealed the p-value and log2(fold change) of each gene in sleep deprivation mice compared with nonsleep-deprived control mice, and the green and red points represent differentially expressed genes (Figure 2B).
Table 2. The top 50 up-regulated DEGs in sleep deprivation mice compared with non-sleep-deprived control mice.
| DEGs | Log FC | P Value |
|---|---|---|
| C330006P03Rik | 1.075404 | 1.04E-10 |
| Gm19439 | 0.856981 | 3.64E-05 |
| Fos | 0.757198 | 1.99E-05 |
| Arc | 0.692398 | 2.87E-06 |
| Zmym1 | 0.580331 | 1.15E-08 |
| Fam46a | 0.575429 | 1.13E-07 |
| Sgk1 | 0.553333 | 0.001363 |
| Klf2 | 0.519179 | 2.03E-05 |
| Hist2h3b | 0.484559 | 5.94E-08 |
| Hspb1 | 0.474444 | 4.00E-05 |
| Pglyrp1 | 0.470768 | 2.00E-06 |
| Sult1a1 | 0.426495 | 0.004354 |
| Manf | 0.425482 | 1.72E-05 |
| Slc39a2 | 0.415629 | 0.001572 |
| Ppp1r3g | 0.41489 | 3.61E-05 |
| Thbs4 | 0.410694 | 7.70E-06 |
| Nostrin | 0.403824 | 1.61E-08 |
| Hist1h3d | 0.398284 | 0.00018 |
| Gjb6 | 0.395809 | 2.93E-05 |
| Plekhf1 | 0.395282 | 5.27E-05 |
| Prkab2 | 0.385805 | 1.89E-09 |
| Alox12b | 0.384485 | 0.000199 |
| Nr4a1 | 0.381311 | 2.83E-05 |
| Hspa5 | 0.379371 | 8.82E-08 |
| P4ha1 | 0.379167 | 2.35E-08 |
| 1500032P08Rik | 0.374252 | 0.001125 |
| Creld2 | 0.371924 | 2.34E-07 |
| Gm3515 | 0.368799 | 0.002315 |
| Tsc22d3 | 0.344395 | 1.04E-05 |
| Nfil3 | 0.339857 | 3.60E-05 |
| Plin4 | 0.339444 | 0.011519 |
| Ddit4 | 0.336401 | 0.000199 |
| Hist1h3a | 0.334779 | 3.41E-08 |
| Rasl10a | 0.330384 | 3.56E-06 |
| Klf4 | 0.329763 | 3.55E-05 |
| Hrk | 0.329359 | 1.18E-06 |
| Mfsd2a | 0.327831 | 0.000374 |
| Hbb-bt | 0.326426 | 0.002756 |
| Htr1a | 0.325029 | 9.61E-07 |
| Gpt2 | 0.320188 | 1.42E-06 |
| Med20 | 0.315592 | 4.95E-07 |
| Dnajc28 | 0.315429 | 5.62E-06 |
| Nfkbia | 0.312606 | 0.000415 |
| Gm5553 | 0.311924 | 5.58E-06 |
| Hdac4 | 0.310993 | 1.57E-07 |
| 8430408G22Rik | 0.309265 | 0.010796 |
| A330023F24Rik | 0.30857 | 0.00149 |
| Smim3 | 0.308505 | 0.000401 |
| St5 | 0.307945 | 2.41E-06 |
| Dio2 | 0.306009 | 6.69E-07 |
Figure 2. The DEGs in sleep deprivation mice compared with non-sleepdeprived control mice. A: Heat map analysis. B: Volcano plot analysis. Green represents down-regulated. DEGs, red represents up-regulated DEGs.
Among these DEGs, Fos transcription factor family (Fos) and activity-regulated cytoskeleton-associated protein (Arc) were highly expressed in sleep deprivation mice compared with non-sleep-deprived control mice. The overexpression of Fos in hippocampal neurons in AD has also been reported by Lu et al., 1998. Arc is a key factor for AD, plays a crucial role in synaptic plasticity, learning, memory, and Aβ generation, and the Arc gene in human confers susceptibility to AD in Han Chinese (Bi et al., 2017).
Potential molecular targets involved in the impact of sleep deprivation on AD pathogenesis
Here we overlapped the DEGs between sleep deprivation mice and AD mice. 38 common DEGs were identified, and 16 of them showed a similar change (Table 3). The increased DEGs included serum/glucocorticoid regulated kinase 1 (Sgk1), lymphocyte antigen 6 complex (Ly6a), V-type proton ATPase subunit e 1 (Atp6v0e), heat shock protein family B member 8 (Hspb8), high-temperature requirement serine peptidase A1 (Htra1), pyruvate dehydrogenase kinase 4 (Pdk4), 6-phosphofructo-2-kinase/fructose-2, 6-biphosphatase (Pfkfb3), Golgi membrane protein 1 (Golm1) and perilipin-3 (Plin3) were up-regulated in the two disorders. Meanwhile, the rest of them were decreased, including Myristoylated Alanine-Rich C-kinase Substrate protein 1 (Marcksl1), guanine-nucleotide exchange factor (Fgd1), sucrose-6-phosphate dehydrogenase (Scarb1), Mevalonate Diphosphate Decarboxylase (Mvd), Kelch-like family member 13 (Klhl13), ELOVL fatty acid elongase 2 (Elovl2) and Vacuolar protein sorting-associated protein 20 (Vps29). Among them, Sgk1 was highly expressed with the highest fold changes in both sleep deprivation and AD mice.
Table 3. A total of 16 common DEGs showed similar change patterns in both sleep deprivation mice and AD mice.
| Common DEGs | Log FC in sleep deprivation mice compared with nonsleep-deprived control mice | Log FC in AD mice compared with wild-type mice |
|---|---|---|
| Sgk1 | 0.553333333 | 0.6978125 |
| Ly6a | 0.278660131 | 0.510390625 |
| Atp6v0e | 0.251478758 | 0.39078125 |
| Hspb8 | 0.161646242 | 0.54984375 |
| Marcksl1 | -0.160261438 | -0.534609375 |
| Htra1 | 0.209203431 | 0.406328125 |
| Pdk4 | 0.213876634 | 0.346744792 |
| Fgd1 | -0.168006536 | -0.422604167 |
| Pfkfb3 | 0.220535131 | 0.290546875 |
| Scarb1 | -0.182712418 | -0.341432292 |
| Golm1 | 0.249387255 | 0.194140625 |
| Plin3 | 0.160951797 | 0.291510417 |
| Mvd | -0.162626634 | -0.258515625 |
| Klhl13 | -0.172769608 | -0.238541667 |
| Elovl2 | -0.201650327 | -0.193359375 |
| Vps29 | -0.161968954 | -0.1528125 |
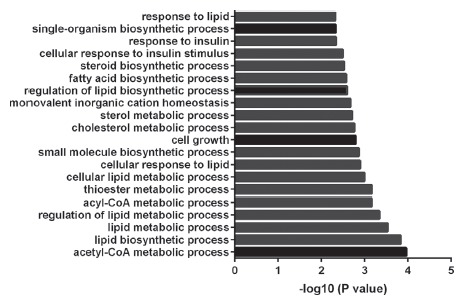
To understand the associated pathways of these common genes, GO and KEGG were conducted on these 16 genes. This showed that the common DEGs were mainly related to acetyl-CoA metabolic process and lipid biosynthetic process. Acetyl-CoA metabolic process included Pdk4 and Mvd, whereas lipid biosynthetic process consisted of Scarb1, Pdk4, Elovl2, and Mvd. The top 20 significantly enriched GO biological processes were shown in a histogram (Figure 3). KEGG pathway analysis showed that these DEGs were mainly enriched in Phagosome.
Figure 3. Top 20 significantly enriched GO biological processes.
Discussion
Here we performed acomparative analysis of the transcriptome profiles of mouse hippocampus of sleep deprivation or AD and identified the common DEGs between them, which were highly related to acetyl-CoA metabolic process and lipid biosynthetic process. These common DEGs may explain the potential mechanism of how sleep deprivation affecting AD development.
Although either sleep deprivation or AD can cause hippocampus dysfunction, the related molecular changes of the hippocampus in mouse models of the two disorders were different. The number of DEGs in sleep deprivation mice (1149 genes) is nearly three times more than that of AD mice (382 genes). Overlapping of the DEGs between them identified 16 common DEGs with the same change direction. Among these common DEGs, the previous studies suggest that some of the induced genes, such as Sgk1 or Htra1 or Pfkfb3, may play a protective role in AD development while some of them (e.g. Golm1) may aid in AD development. In detail, Sgk1 has been reported to be correlated with the inhibition of Aβ deposition and the improvement of cognitive function and to play an important role in neuronal plasticity, spatial memory and fear-conditioning memory in the hippocampus (Izumi et al., 2018). Htra1 is demonstrated to cleave Tau (Poepsel et al., 2015) while Tau was proven to be the trigger and bullet in Alzheimer disease pathogenesis (Poepsel et al., 2015). Meanwhile, Pfkfb3 is the rate-limiting enzyme for glycolysis, and inhibition of Pfkfb3 has been proved to cause an accumulation of amyloid protein and vulnerability to Aβ cytotoxicity (Fu et al., 2015). Therefore, these three genes were induced by sleep deprivation or AD probably due to a feedback mechanism. In contrast, the genetic variation of Golm1 was found to be associated with AD. For example, a polymorphism of Golm1, rs10868366, has been identified as an AD risk factor (Inkster et al., 2012). Taken together, some of the common DEGs have been reported to be involved in AD development, suggesting an investigation of the role these overlapped genes may aid to understand how sleep deprivation may promote AD development.
Our further GO biological processes analysis showed that the 16 common DEGs were mainly enriched in the acetyl-CoA metabolic process and lipid biosynthetic process. Pyruvate-derived acetyl-CoA is a principal direct precursor substrate for bulk energy synthesis in the brain (Bielarczyk et al., 2015). A β-induced deficits in acetyl-CoA are confined to mitochondrial and cytoplasmic compartments of Tg2576 mice nerve terminals, which is the early primary signal for neurodegeneration (Bielarczyk et al., 2015). These findings suggest a critical role of acetyl-CoA metabolic process in AD. It is reported that lipid metabolism is significantly influenced in neurodegenerative diseases, such as AD, and the dysfunctions can further cause abnormal levels of certain lipids in the brain, cerebrospinal fluid and plasma (Zarrouk et al., 2018). Previous studies have reported several lipid biomarkers for AD, including cholesterol, oxysterols, fatty acids, and phospholipids, some of which have a prognostic and diagnosis value, suggesting lipids play a role in the pathogenesis of AD (Zarrouk et al., 2018).
There are some limitations to our current manuscript. First, our analyses were done on mouse samples, instead of human samples. However, tissue from sleep-deprived humans is to be difficult to acquire. Therefore, we further analyzed the online databases about human brain tissues with AD. DEGs from human Alzheimer’s disease brains (GSE36980 and GSE5281 datasets) were identified using the same cutoff (logFC >0.15, p <0.05) as our current analyses, followed by overlapping with the 16 common DEGs in sleep-deprivation mice and AD mice (Table 3). Three (HSPB8, FGD1, GOLM1) and five (MARCKSL1, PFKFB3, PLIN3, MVD, VPS29) overlapped genes were found in GSE36980 and GSE5281 datasets, respectively. It suggests that these genes may play a vital role in the development of human Alzheimer’s disease. Second, the batch effect may exist. Although the two datasets used in our study were done on C57BL/6J mouse strains, they are finished in a different lab in different conditions so that we cannot exclude the batch differences may exist in these two independent experiments. Last, although the investigation of the role of these common genes in AD can aid in the understanding of AD development, we should remember that not all sleep-deprived individuals will develop AD. Other factors, such as genetic background, other living habits, and general health conditions, should be considered even though the individuals may have similar changes of these 16 DEGs.
In conclusion, taking advantage of the online databases, we systematically analyzed the transcriptome profiles of mouse hippocampus of sleep deprivation and AD, followed by the identification of the common DEGs between them. Most of the common genes, highly enriched in acetylCoA metabolic and lipid biosynthetic processes, are reported to be associated with neuropathological changes. These findings suggest that sleep deprivation causing neuropathological changes in mouse brains may contribute the AD development by dysregulation of these common DEGs.
Acknowledgments
This work was supported by the Advanced Research Program for Provincial or Ministry Level Project of Nanjing Forest Police College (RWY201603); Key Project of Philosophy and Social Science Research in Colleges and Universities in Jiangsu Province (No. 2017ZDIXM100).
References
- Area-Gomez E, Groof A, Bonilla E, Montesinos J, Tanji K, Boldogh I, Pon L, Schon EA. A key role for MAM in mediating mitochondrial dysfunction in Alzheimer disease. Cell Death Dis. 2018;9:335–335. doi: 10.1038/s41419-017-0215-0. [DOI] [PMC free article] [PubMed] [Google Scholar]
- Benedetti F, Serretti A, Colombo C, Lorenzi C, Tubazio V, Smeraldi E. A glycogen synthase kinase 3-beta promoter gene single nucleotide polymorphism is associated with age at onset and response to total sleep deprivation in bipolar depression. Neurosci Lett. 2004;368:123–126. doi: 10.1016/j.neulet.2004.06.050. [DOI] [PubMed] [Google Scholar]
- Bi R, Kong LL, Xu M, Li GD, Zhang DF, Li T, Fang Y, Zhang C, Zhang B. The Arc gene confers genetic susceptibility to Alzheimer’s Disease in Han Chinese. Mol Neurobiol. 2017;55:1217–1226. doi: 10.1007/s12035-017-0397-6. [DOI] [PubMed] [Google Scholar]
- Bielarczyk H, Jankowska-Kulawy A, Hofling C, Ronowska A, Gul-Hinc S, Rossner S, Schliebs R, Pawelczyk T, Szutowicz A. AbetaPP-transgenic 2576 mice mimic cell type-specific aspects of acetyl-CoA-linked metabolic deficits in Alzheimer’s disease. J Alzheimers Dis. 2015;48:1083–1094. doi: 10.3233/JAD-150327. [DOI] [PubMed] [Google Scholar]
- Braak H, Braak E. Neuropathological stageing of Alzheimer-related changes. Acta Neuropathol. 1991;82:239–259. doi: 10.1007/BF00308809. [DOI] [PubMed] [Google Scholar]
- Braak H, Braak E, Bohl J. Staging of Alzheimer-related cortical destruction. Eur Neurol. 1993;33:403–408. doi: 10.1159/000116984. [DOI] [PubMed] [Google Scholar]
- Chen L, Huang J, Yang L, Zeng X A, Zhang Y, Wang X, Chen M, Li X, Zhang Y, Zhang M. Sleep deprivation accelerates the progression of alzheimer’s disease by influencing Aβ-related metabolism. Neurosci Lett. 2017;650:146–152. doi: 10.1016/j.neulet.2017.04.047. [DOI] [PubMed] [Google Scholar]
- Di Meco A, Joshi YB, Pratico D. Sleep deprivation impairs memory, tau metabolism, and synaptic integrity of a mouse model of Alzheimer’s disease with plaques and tangles. Neurobiol Aging. 2014;35:1813–1820. doi: 10.1016/j.neurobiolaging.2014.02.011. [DOI] [PubMed] [Google Scholar]
- Fu W, Shi D, Westaway D, Jhamandas JH. Bioenergetic mechanisms in astrocytes may contribute to amyloid plaque deposition and toxicity. J Biol Chem. 2015;290:12504–12513. doi: 10.1074/jbc.M114.618157. [DOI] [PMC free article] [PubMed] [Google Scholar]
- Greene SJ, Killiany RJ, Alzheimer’s Disease Neuroimaging Initiative Hippocampal subregions are differentially affected in the progression to Alzheimer’s disease. Anat Rec. 2012;295:132–140. doi: 10.1002/ar.21493. [DOI] [PubMed] [Google Scholar]
- Harris MA, Clark J, Ireland A, Lomax J, Ashburner M, Foulger R, Eilbeck K, Lewis S, Marshall B, Mungall C, et al. The Gene Ontology (GO) database and informatics resource. Nucleic Acids Res. 2004;32:D258–D261. doi: 10.1093/nar/gkh036. [DOI] [PMC free article] [PubMed] [Google Scholar]
- Hastie T, Tibshirani R, Narasimhan B, Chu G. Impute: Imputation for microarray data. Bioconductor; 2011. [DOI] [Google Scholar]
- Havekes R, Abel T. The tired hippocampus: the molecular impact of sleep deprivation on hippocampal function. Curr Opin Neurobiol. 2017;44:13–19. doi: 10.1016/j.conb.2017.02.005. [DOI] [PMC free article] [PubMed] [Google Scholar]
- Hita-Yanez E, Atienza M, Gil-Neciga E, Cantero JL. Disturbed sleep patterns in elders with mild cognitive impairment: the role of memory decline and ApoE epsilon4 genotype. Curr Alzheimer Res. 2012;9:290–297. doi: 10.2174/156720512800107609. [DOI] [PubMed] [Google Scholar]
- Inkster B, Rao AW, Ridler K, Filippini N, Whitcher B, Nichols TE, Wetten S, Gibson RA, Borrie M, Kertesz A, et al. Genetic variation in GOLM1 and prefrontal cortical volume in Alzheimer’s disease. Neurobiol Aging. 2012;33:457–465. doi: 10.1016/j.neurobiolaging.2010.04.018. [DOI] [PubMed] [Google Scholar]
- Izumi H, Shinoda Y, Saito T, Saido TC, Sato K, Yabuki Y, Matsumoto Y, Kanemitsu Y, Tomioka Y, Abolhassani N, et al. The disease-modifying drug candidate, SAK3 improves cognitive impairment and inhibits amyloid beta deposition in App knock-in mice. Neuroscience. 2018;377:87–97. doi: 10.1016/j.neuroscience.2018.02.031. [DOI] [PubMed] [Google Scholar]
- Kang JE, Lim MM, Bateman RJ, Lee JJ, Smyth LP, Cirrito JR, Fujiki N, Nishino S, Holtzman DM. Amyloid-beta dynamics are regulated by orexin and the sleep-wake cycle. Science. 2009;326:1005–1007. doi: 10.1126/science.1180962. [DOI] [PMC free article] [PubMed] [Google Scholar]
- Lu W, Mi R, Tang H, Liu S, Fan M, Wang L. Overexpression of c-fos mRNA in the hippocampal neurons in Alzheimer’s disease. Chin Med J (Engl) 1998;111:35–37. [PubMed] [Google Scholar]
- Mander BA, Marks SM, Vogel JW, Rao V, Lu B, Saletin JM, Ancoli-Israel S, Jagust WJ, Walker MP. β-amyloid disrupts human NREM slow waves and related hippocampusdependent memory consolidation. Nat Neurosci. 2015;18:1051–1057. doi: 10.1038/nn.4035. [DOI] [PMC free article] [PubMed] [Google Scholar]
- Matsuoka T, Imai A, Fujimoto H, Kato Y, Shibata K, Nakamura K, Yokota H, Yamada K, Narumoto J. Neural correlates of sleep disturbance in Alzheimer’s disease: Role of the precuneus in sleep disturbance. J Alzheimers Dis. 2018;63:957–964. doi: 10.3233/JAD-171169. [DOI] [PMC free article] [PubMed] [Google Scholar]
- Morris RG, Moser EI, Riedel G, Martin SJ, Sandin J, Day M, O’Carroll C. Elements of a neurobiological theory of the hippocampus: the role of activity-dependent synaptic plasticity in memory. Philos Trans R Soc Lond B Biol Sci. 2003;358:773–786. doi: 10.1098/rstb.2002.1264. [DOI] [PMC free article] [PubMed] [Google Scholar]
- Organizer GB, Goode JA. The KEGG Database. John Wiley & Sons; Chichester: 2008. [Google Scholar]
- Peter-Derex L, Yammine P, Bastuji H, Croisile B. Sleep and Alzheimer’s disease. Sleep Med Rev. 2015;19:29–38. doi: 10.1016/j.smrv.2014.03.007. [DOI] [PubMed] [Google Scholar]
- Poepsel S, Sprengel A, Sacca B, Kaschani F, Kaiser M, Gatsogiannis C, Raunser S, Clausen T, Ehrmann M. Determinants of amyloid fibril degradation by the PDZ protease HTRA1. Nat Chem Biol. 2015;11:862–869. doi: 10.1038/nchembio.1931. [DOI] [PubMed] [Google Scholar]
- Polito VA, Li H, Martini-Stoica H, Wang B, Yang L, Xu Y, Swartzlander DB, Palmieri M, Ronza A, Lee VM, et al. Selective clearance of aberrant tau proteins and rescue of neurotoxicity by transcription factor EB. EMBO Mol Med. 2014;6:1142–1160. doi: 10.15252/emmm.201303671. [DOI] [PMC free article] [PubMed] [Google Scholar]
- Porter NM, Bohannon JH, Meredith CR, Buechel HM, Dowling ALS, Brewer LD, Popovic J, Thibault V, Kraner SD, Chen CK, et al. Transcriptional profile of sleep deprivation: Relation to aging and stress. Plos One. 2012;7:e40128. doi: 10.1371/journal.pone.0040128. [DOI] [PMC free article] [PubMed] [Google Scholar]
- Prince TM, Wimmer M, Choi J, Havekes R, Aton S, Abel T. Sleep deprivation during a specific 3-hour time window post-training impairs hippocampal synaptic plasticity and memory. Neurobiol Learn Mem. 2014;109:122–130. doi: 10.1016/j.nlm.2013.11.021. [DOI] [PMC free article] [PubMed] [Google Scholar]
- Qiu H, Zhong R, Liu H, Zhang F, Li S, Le W. Chronic sleep deprivation exacerbates learning-memory disability and Alzheimer’s disease-like pathologies in AbetaPP(swe)/PS1(DeltaE9) mice. J Alzheimers Dis. 2016;50:669–685. doi: 10.3233/JAD-150774. [DOI] [PubMed] [Google Scholar]
- Roh JH, Huang Y, Bero AW, Kasten T, Stewart FR, Bateman RJ, Holtzman DM. Disruption of the sleep-wake cycle and diurnal fluctuation of β-amyloid in mice with Alzheimer’s disease pathology. Sci Transl Med. 2012;4:150ra122–150ra122. doi: 10.1126/scitranslmed.3004291. [DOI] [PMC free article] [PubMed] [Google Scholar]
- Sarter M, Bruno JP. Cognitive functions of cortical acetylcholine: toward a unifying hypothesis. Brain Res Brain Res Rev. 1997;23:28–46. doi: 10.1016/s0165-0173(96)00009-4. [DOI] [PubMed] [Google Scholar]
- Slats D, Claassen JA, Verbeek MM, Overeem S. Reciprocal interactions between sleep, circadian rhythms and Alzheimer’s disease: focus on the role of hypocretin and melatonin. Ageing Res Rev. 2013;12:188–200. doi: 10.1016/j.arr.2012.04.003. [DOI] [PubMed] [Google Scholar]
- Smyth GK. limma: linear models for microarray data. In: Gentleman R, Carey VJ, Huber W, Irizarry RA, Dudoit S, editors. Bioinformatics and computational biology solutions using R and bioconductor. Springer; New York: 2005. pp. 397–420. [Google Scholar]
- Vecsey CG, Peixoto L, Choi JH, Wimmer M, Jaganath D, Hernandez PJ, Blackwell J, Meda K, Park AJ, Hannenhalli S, et al. Genomic analysis of sleep deprivation reveals translational regulation in the hippocampus. Physiol Genomics. 2012;44:981–991. doi: 10.1152/physiolgenomics.00084.2012. [DOI] [PMC free article] [PubMed] [Google Scholar]
- Westerberg CE, Mander BA, Florczak SM, Weintraub S, Mesulam MM, Zee PC, Paller KA. Concurrent impairments in sleep and memory in amnestic mild cognitive impairment. J Int Neuropsychol Soc. 2012;18:490–500. doi: 10.1017/S135561771200001X. [DOI] [PMC free article] [PubMed] [Google Scholar]
- Wu YH, Swaab DF. Disturbance and strategies for reactivation of the circadian rhythm system in aging and Alzheimer’s disease. Sleep Med. 2007;8:623–636. doi: 10.1016/j.sleep.2006.11.010. [DOI] [PubMed] [Google Scholar]
- Zarrouk A, Debbabi M, Bezine M, Karym EM, Badreddine A, Rouaud O, Moreau T, Cherkaoui-Malki M, El Ayeb M, Nasser B, et al. Lipid biomarkers in Alzheimer’s disease. Curr Alzheimer Res. 2018;15:303–312. doi: 10.2174/1567205014666170505101426. [DOI] [PubMed] [Google Scholar]