Abstract
Immunotherapies are treatments that use a patient’s immune system to combat disease. One important type of immunotherapy employed in cancer treatments is the delivery of monoclonal antibodies to block growth receptors. In this manuscript, we develop a methodology that enables accurate and simple evaluation of antibody-type drug delivery using MALDI-MSI. To overcome the mass-range limitation that prevents the detection of large therapeutic antibodies, we used in situ reduction and alkylation to break disulfide bonds to generate smaller fragments. These smaller fragments are more readily ionized and detected by MALDI-MSI without loss of spatial information on the parent drug. As a proof of concept study, we evaluated the distribution of cetuximab in 3D colon cell cultures. Cetuximab is a monoclonal antibody that binds to the extracellular domain of epidermal-growth-factor receptor (EGFR), which is often overexpressed in colorectal cancer (CRC) and mediates cell differentiation, proliferation, migration, and angiogenesis. Cetuximab directly inhibits tumor growth and metastasis and induces apoptosis. By performing on-tissue reduction followed by MALDI-MSI analysis, we successfully mapped the timedependent penetration and distribution of cetuximab in spheroids derived from two different colon-cancer cell lines (HT-29 and DLD-1). The localization patterns were further confirmed with IF staining of the drug. Changes in other biomolecules following drug treatment were also observed, including the elevation of ATP in spheroids. The developed method has also been applied to map cetuximab distribution in patient-derived colorectal-tumor organoids (CTOs). Overall, we believe this powerful label-free approach will be useful for visualizing the heterogeneous distribution of antibody drugs in tissues and tumors and will help to monitor and optimize their use in the clinic.
Graphical Abstract
Immunotherapy is changing the face of cancer treatment. The principle aim of cancer immunotherapy is to resurrect the suppressed immune systems of patients to fight cancer cells and destroy the tumor.1 There are two major ways that immunotherapy can be implemented in cancer treatment: stimulating the patient’s immune system to attack tumor cells or providing the patient with man-made immune-system proteins that bind and inhibit growth-factor receptors.2 Currently, one estimate suggests that there are approximately 800 immunotherapy clinical trials under way in the United States, and the number keeps growing.3 A wide range of these immunotherapy treatments, including cancer vaccines, immune-checkpoint blockers, and monoclonal antibodies against tumor-associated antigens and receptors, have demonstrated efficacy in patients.4,5
Cetuximab is a mouse−human chimeric monoclonal antibody, which is an example of “passive” immunotherapy that often does not require the patient’s immune system to take an active role in combating the cancer.4,5 This drug binds to epidermal-growth-factor receptor (EGFR) with high affinity and prevents downstream signaling, leading to inhibition of tumor growth.6,7 Moreover, cetuximab can induce immune cells (e.g., macrophages, cytotoxic T-lymphocytes, natural killer cells, etc.) to attack the cells it binds to.2 Consequently, it has been approved for clinical use, either alone or in combination with radio- or chemotherapy.7–9 Cetuximab is also utilized as a targeting probe to carry various therapeutic agents to improve tumor-directed drug delivery.10–13
In colorectal cancer (CRC), EGFR, a cell-membrane protein participating in cell proliferation and differentiation, is overexpressed in the majority (50–80%) of colorectal tumors.14 Its expression is associated with tumor aggressiveness and poor disease-free survival.15 Blocking EGFR provides a promising approach for CRC treatment. Currently, as one of the novel anticancer therapeutic antibodies that have been developed targeting EGFR-family members, cetuximab treatment has been shown to significantly improve CRC-patient outcomes.2 It has become apparent that RAS-mutation status is a predictive factor for anti-EGFR therapy. Although some patients who harbor wild-type RAS tumors benefit from cetuximab therapy, 40 to 60% of patients with wild-type RAS do not respond to the drug for unknown reasons.2 Because of the increasing importance of antibody-based therapies, analysis of the penetration and distribution properties of monoclonal antibodies is valuable.
Studying the localization of monoclonal antibodies has primarily been investigated through various imaging techniques, such as magnetic-resonance imaging (MRI),16 positronemission tomography (PET),17,18 fluorescence microscopy,19 and autoradiography,20 using radio-labeled or fluorescently labeled probes. However, these methodologies suffer from radiation burden, high cost, and other pitfalls such as changes in affinity and unspecific reactions due to the labeled molecules. As a complementary method, mass-spectrometry imaging (MSI) provides simple sample preparation with no preselection or labeling of analytes and enables spatialdistribution analysis of multiple species simultaneously in the same experiment.21
Our lab has developed a platform to assess drug penetration and metabolism in three-dimensional (3D) cell-culture systems using matrix-assisted-laser-desorption-ionization (MALDI) MSI.21–27 3D growth of immortalized cell lines or primary cell cultures is regarded as a representative model for performing therapeutic screening.28 Among the different 3D cell cultures, spheroids closely mimic the complex scenarios of in vivo tissues, including cell−cell interactions, the production of extracellular matrix, drug penetration and responses, and cellular heterogeneity, and they are one of the most commonly used model systems. However, despite the success of analyzing small-molecule anticancer drugs in spheroids using MALDI-MSI,21–27 the challenges of analyzing higher-mass ranges have constrained the analysis of high-molecular-weight biomolecules like therapeutic antibodies (c. 150 kDa).29 This limitation has been attributed to factors such as low ionization efficiencies and detection of large molecules, and efforts have been made by researchers to extend the upper mass limit by MALDI-MSI. Instrumental hardware such as CovalX high-mass HM1 detector,30 which was specifically designed for the detection of high-mass ions, has been shown to enhance sensitivity for high-mass proteins. Sample-preparation methods and different matrices, such as ferulic acid, have also been reported to increase the mass range of proteins amenable to MALDI analysis.31–34 However, these strategies either required the use of harsh solvents like hexafluoroisopropyl alcohol (HFIP) and 2,2,2-trifluoroethanol (TFE) or were shown to have a low shot-to-shot reproducibility.32,33
Here, we present an on-tissue-reduction approach using dithiothreitol (DTT) to break the disulfide bonds of cetuximab, generating two heavy chains (HC, c. 50 kDa) and two light chains (LC, c. 25 kDa). Using MALDI-MSI analysis, the LC were detected and mapped in spheroids derived from two colon-cancer cell lines. The distribution of cetuximab was further confirmed by fluorescence microscopy using immunofluorescence (IF) staining. As well as assessing drug penetration, the distribution of endogenous molecules in spheroids was analyzed at a low-mass range by MALDI-MSI, and changes in ATP levels were observed in cetuximab-treated samples. The developed imaging approach was also successfully applied to detect cetuximab in 3D colorectal-cancer organoids (CTOs) established from patient resected tissue. This research provides a powerful approach for investigating the distribution of therapeutic antibodies using MALDI-MSI without any labeling. This method will help in evaluating drug efficacy and in optimizing immunotherapeutic regimens involving antibodies in solid tumors.
METHODS
Cell Culture, Growth of Spheroids, and Drug Treatment
The human colon-carcinoma cell lines HT-29 and DLD-1 were obtained from the American Type Culture Collection (ATCC, Manassas, VA). HT-29 cells were grown in McCoy’s 5A cell-culture medium (Life Technologies, Carlsbad, CA), while DLD-1 cells were cultured in RPMI 1640 cell-culture medium (Life Technologies, Carlsbad, CA). The medium was supplemented with 10% fetal-bovine serum (FBS; Thermo Scientific, Waltham, MA). The provider assured authentication of these cell lines by cytogenetic analysis, and they were verified by short-tandem-repeat sequencing in 2016.
Spheroids were generated by loading suspensions of HT-29 or DLD-1 cells at a density of 7000 cells per 200 μL of medium into each well of agarose-coated 96-well plates.22 After an initiation period of 4 days, 50% of the culture volume was replaced with fresh medium every 2 days thereafter. The spheroids reached a diameter of approximately 1 mm after 12 days in culture. The reproducibility of the growth of DLD-1 spheroids is shown in Supplemental Figure 1.
Cetuximab was acquired from the pharmacy at the University of Southern California Norris Comprehensive Cancer Center. Spheroids on day 13 were incubated in cetuximab solution (1 mg/mL) for 24 or 72 h, and phosphatebuffered saline (PBS) was used in the control cultures.
Organoid Culture and Drug Treatment
Tumor tissues were received from colorectal-cancer patients under Institutional Review Board (IRB) approval at the Norris Comprehensive Cancer Center of USC. Patient-derived colorectal-tumor organoids (CTOs) were developed following previously described methods.35 Organoids were cultured in 24-well plates with basement-membrane-matrix-type-2 (BME) gel (Trevigen, Gaithersburg, MD). Culture media consisted of Advanced DMEM/F12 (Life Technologies, Carlsbad, CA) with 10% fetal-bovine serum, 1% penicillin−streptomycin, 1% Glutamax, and 1% HEPES supplemented with N2 (Sigma, St. Louis, MO), B-27 (Sigma, St. Louis, MO), 1 mM Nacetylcysteine (Sigma, St. Louis, MO), 50 ng/mL EGF (Life Technologies, Carlsbad, CA), 100 ng/mL Noggin (Tonbo, San Diego, CA), 10 mM nicotinamide (Sigma, St. Louis, MO), 500 nM A83–01 (Calbiochem, Burlington, MA), 10 μM SB202190 (Sigma, St. Louis, MO), and 0.01 μM PGE2 (Sigma, St. Louis, MO).
For MALDI experiments, CTOs were harvested from a single confluent well and dissociated using TrypLE (Life Technologies, Carlsbad, CA; 500 μL/well). The collected CTOs were mixed with BME (1:4 dilution) and plated at 60 μL of organoid−BME mix per well. CTOs were cultured for 10 days, and the culture media was replenished every 3 days. Prior to cetuximab treatment, the EGF concentration in the media was reduced to 0.04 ng/mL. Cetuximab was added at a 1 μM concentration, and the cells were treated for 72 h.
Sample Preparation for MALDI-MSI Analysis
After specific incubation times, the medium was aspirated, and the spheroids were washed with 1× PBS twice. For the fixed-sample preparation, spheroids were first incubated with 10% formalin in PBS for 20 min and washed with PBS. Both the fixed and unfixed spheroids were then harvested, sectioned into 14 μm slices using the gelatin-assisted sectioning method, and thaw-mounted on indium−tin oxide (ITO) glass slides (Bruker Daltonics, Bremen, Germany) as previously described.36,37 The slides were stored at −80 °C before use. For the formalin-fixed samples, heat-induced epitope retrieval was performed with 10 mM citrate buffer (pH 6.0) for 30 min, followed by 20 min of cooldown at RT.
For protein analysis, the spheroid sections were brought to room temperature, and then they were washed for 30 s in 70% ethanol and 30 s in 95% ethanol, dipped (<1 s) five times in deionized water, and washed 30 s in 70% ethanol and 30 s in 95% ethanol. The slides were air-dried and stored in a desiccator for at least 1 h before on-tissue reduction.
Reduction and alkylation were performed with a TM sprayer nebulizer (HTX Technologies, Carrboro, NC); 80 mM dithiothreitol (DTT) was applied at 37 °C for six passes over the sample surface. The pressure was set at 10 psi, the gas flow rate was 3 L/min, and the nozzle height was 40 mm. The flow rate was 0.05 mL/min at a moving velocity of 1000 mm/min with a track spacing of 2 mm and 20 s of drying time in between passes. The sprayed slides were placed in a Petri dish containing a moist Kim Wipe and the plate was incubated at 37 °C for 50 min to allow efficient penetration and reaction of the reducing agent. In the following alkylation step, 55 mM iodoacetamide (IAA) was sprayed (30 °C nozzle temperature, two passes, 0.08 mL min−1 flow rate) on the slides, and the Petri dish was placed in darkness for 20 min at room temperature. The slides were then washed in 95% ethanol−0.1% trifluoroacetic acid (TFA) for 15 s to remove the reduction and alkylation reagents, which could cause ion suppression during MALDI-MSI. After complete dryness was achieved in a desiccator, spheroid sections were spotted with the matrix sinapic acid (SA; Sigma, St. Louis, MO), which was prepared at 30 mg/mL in 50% acetonitrile (ACN) −0.2% TFA. In a control experiment, sections were processed without the reduction and alkylation steps. All samples were analyzed in four biological replicates and with one technical duplicate. CTOs samples were processed in a similar fashion as described above.
For evaluation of small molecules, the washing process for the slides was skipped. 9-Aminoacridine (9-AA; Sigma, St. Louis, MO) was dissolved in 60% methanol−0.1% TFA at 5 mg/mL and applied (60 °C nozzle temperature, four passes, 0.1 mL min−1 flow rate). The sample was allowed to dry fully in a desiccator before data acquisition.
MALDI-MSI and Data Analysis
Mass spectra were acquired on an UltrafleXtreme TOF/TOF mass spectrometer (Bruker Daltonics, Billerica, MA) equipped with a smartbeam II Nd:YAG 355 nm laser. For MSI analysis of proteins, the instrument was operated in linear positive-ion mode at 200 Hz in the mass range of m/z 10 000–55 000 with the “medium” focus setting under optimized delayed-extraction conditions. At each pixel, 1000 laser shots were accumulated with a lateral resolution of 70 μm. For analysis of small molecules, reflectron negative-ion mode at 1000 Hz in the mass range of m/z 200–1000 was used. The spectrum at each x–y coordinate is a result of 500 consecutive laser shots. The “small” laser-spot diameter and a raster width of 35 μm were employed. External calibration was performed using a standard protein or custom small-molecule mixture by spotting the standards on a region without gelatin near the spheroid section.
The data were visualized by FlexImaging (ver. 4.1; Bruker Daltonics, Billerica, MA) or analyzed with SCiLS Lab (ver. 2015; Bremen, Germany). Raw data was imported into the SCiLS Lab software. The TopHat algorithm was used to remove the baseline, and peak picking was performed using an orthogonal-matching-pursuit algorithm with a signal-to-noise ratio of 3. Spectra were normalized against the total ion count. For supervised analysis, peaks that discriminated drug-treated and untreated spheroids were elucidated by means of receiver-operating-characteristic (ROC) curves to find discriminating m/z signals.
Immunofluorescence Staining and Imaging
Spheroid samples were fixed in PBS with 4% (w/v) paraformaldehyde at room temperature (RT) for 30 min. Slides were then blocked and permeabilized for 20 min. Rabbit anti-Ki-67 primary antibody and anti-EGFR primary antibody (Cell Signaling Technologies, Inc., Danvers, MA) were used for the proliferation study and for the visualization of EGFR in spheroids. The antibodies were prepared in 1:100 dilutions and then were added on the spheroid sections, after which the sections were incubated for 2 h at RT. Next, the goat antirabbit-IgG−TRITC secondary antibody (Thermo Scientific, Gaithersburg, MD), diluted 1:100, was added in the same manner, after which the sections were incubated for 1 h at RT in the dark; this was followed by incubation with 4′,6diamidino-2-phenylindole (DAPI; Sigma, St. Louis, MO) at 1:500 for 5 min. For analysis of cetuximab distribution, FITCconjugated goat anti-mouse-IgG secondary antibody was used. After the secondary antibody and DAPI were removed and washed, mounting media was added, and the slides were allowed to dry for 1 h in the dark, after which they were sealed with fingernail polish. Negative controls consisted of samples not incubated with the primary antibody but only with the secondary antibody.
Confocal z-stack images were acquired on a Nikon A1R confocal-laser-microscope system (Nikon Instruments Inc., Melville, NY). For quantitative comparisons, relative proliferation was determined by normalizing images by their corresponding DAPI intensities. All samples were analyzed in biological triplicate and technical duplicate.
RESULTS AND DISCUSSION
Immunotherapy has now become the fourth pillar of cancer therapy, complementing surgery, cytotoxic therapy, and radiotherapy and providing an exciting new treatment option for some patients.38 Among different types of immunotherapy, antibodies are increasingly important vehicles for targeting elements of tumors, such as growth-factor receptors, and stimulating the host immune system to attack tumor cells and ideally eradicate the tumor. Many of these monoclonal antibodies have been shown to have important clinical activity.38 However, there is limited information about the penetration of this type of drug. In this study, our approach aims to use MALDI-MSI to assess the distribution of a therapeutic antibody, cetuximab, in 3D colon-cancer model systems.
Localizing antibody molecules by mass spectrometry is difficult because a greater amount of energy is required to ionize larger molecules.39,40 In this study, we first tried a “topdown” in-source-decay (ISD) approach, which consists of direct in situ fragmentation of proteins. This pseudo-MS/MS technique uses hydrogen-radical transfer from the matrix to analytes to enable fragmentation and sequencing of the N- and C-termini of proteins.41 To analyze cetuximab, we collected the ISD mass spectra by mixing a 1,5-diaminonaphtalene (1,5DAN) matrix with the purified antibody drug and directly spotting it on the MALDI target. The best fragmentation range was obtained between m/z 1000–8000, and residues corresponding to the LC and HC of the drug were successfully identified (Supplemental Figure 2). However, when performing the same ISD method by spotting cetuximab on control spheroid slices, signal intensities and fragment ions from the drug were significantly decreased, indicating that ion suppression from interfering species in the spheroid sample affected detection. As a result, when we further applied this top-down approach in cetuximab-treated spheroid samples, it failed to detect ions derived from the drug.
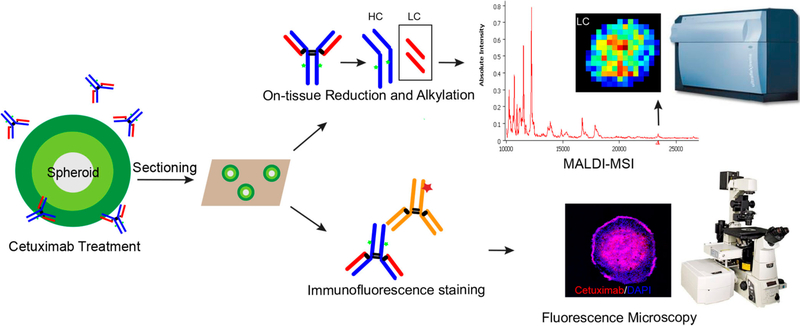
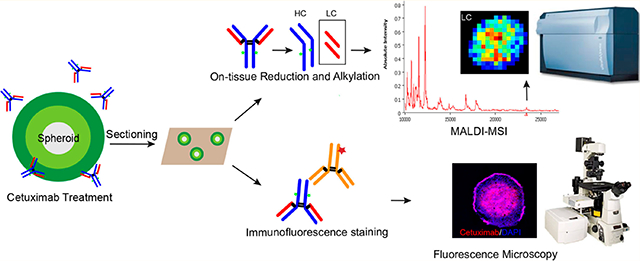
Another way to overcome the difficulty of detecting high-molecular-weight molecules involves in situ digestion of proteins to generate smaller fragments that not only represent the abundance of the parent protein but allow for an efficient detection by MALDI-MS. Information on the distribution of the parent protein can be inferred from the spatial positions of the fragments. Therefore, we conducted on-tissue digestion using an IdeS enzyme followed by reduction to map smaller subunits derived from antibody drugs. This method was successfully used to detect the LC, Fc/2, and Fd domains by analyzing the cetuximab standard on spheroid sections with drug spotted (Supplemental Figure 3). However, one drawback of this method is that application of the IdeS enzyme results in delocalization of cetuximab as well as other molecules across the sample surface, making it less suitable for an imaging experiment. To overcome this problem, we modified the strategy by directly performing on-tissue reduction using DTT followed by alkylation, as described below. A schematic illustration for the workflow is shown in Figure 1.
Figure 1.
Schematic illustration of the overall workflow. Spheroids were treated with cetuximab for a specific length of time. Spheroids were then harvested and sectioned using gelatin-assisted cryosectioning; this was followed by either on-tissue reduction to enable detection of cetuximab using MALDI-MSI or immunofluorescence staining combined with fluorescence-microscopy analysis.
Detection of Cetuximab by On-Tissue Reduction Coupled with MALDI-MSI
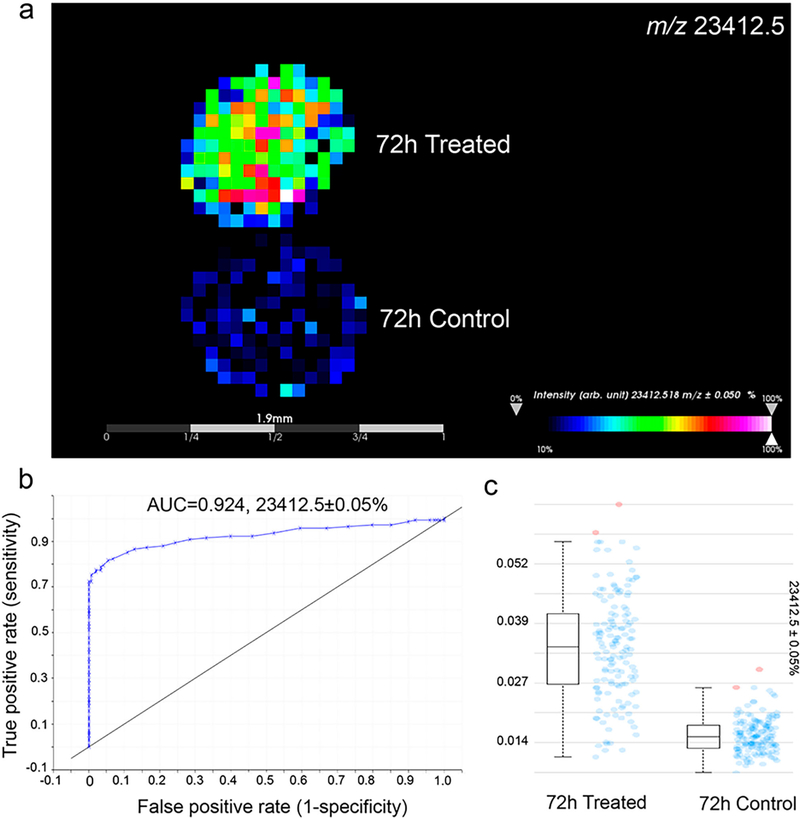
HT-29 spheroids were treated with cetuximab (1 mg/mL) for 72 h and then harvested. The spheroids were then sectioned, and in situ reduction and alkylation were performed. The slides were then washed with 95% ethanol–% TFA for 15 s to reduce ion suppression during MALDI-MSI (Supplemental Figure 4). Probabilistic latent semantic analysis (pLSA) with deterministic initialization was carried out to observe the trends in the data sets.24,42 The 3D scores plot presented in Supplemental Figure 5a shows a clear distinction between the treated and control spheroids. Using the data from the loadings plot, it was possible to identify multiple m/z values that differentiated the two conditions. Receiver operating characteristics (ROC) were also used to determine how well a selected m/z signal distinguishes two different samples with the area-under-the-curve (AUC) value representing the discrimination power. As an example, m/z 23 412.5 was found to be present only in treated spheroids, as shown in the mass spectra, the intensity box plot, and the ROC plot with an AUC > 0.9 (Figure 2 and Supplemental Figure 5b). This m/z value corresponds to the LC of cetuximab, and the peak is also in accordance with the ion detected using the reduced cetuximab standard (Supplemental Figure 5c). With an additional antigen-retrieval step, this approach has been successfully applied to detect the drug in formalin-fixed HT-29 spheroids treated with cetuximab for 72 h (Supplemental Figure 6).
Figure 2.
Detection of cetuximab in HT-29 spheroids treated for 72 h. (a) MALDI-MSI ion images showing distribution of m/z 23 412.5 (LC of cetuximab). (b) ROC plot revealing the selected signal (m/z 23 412.5) specifically distinguishing cetuximab-treated spheroids from untreated ones. (c) Box plots showing the median intensities. Blue dots represent the spectra in which intensities of the given m/z interval is between the lower and upper quartiles, and red dots represent outliers.
To study if the on-tissue-reduction approach would cause delocalization of analytes on the sample surface, MALDI-MSI was also performed on spheroid slices without the reduction and alkylation steps. Proteins with different distribution patterns were analyzed, and three of these ion signals are shown in Supplemental Figure 7. The ion with m/z 10 693.8 is found to be present in the outer region of the spheroids, m/z 16 719.4 mainly localizes in the core area, and m/z 41 643.2 distributes throughout the spheroid sections. Correlation plots confirmed that the correlation between m/z 10 693.8 and 16 719.4 was insignificant with a correlation of 0.0533 compared with a threshold of 0.5 (p ≤ 0.05). For the samples with on-tissue reduction, similar spatial positions of these molecules were observed. A correlation of 0.229 was calculated for m/z10 693.8 and 16 719.4, indicating the distinct localization of these analytes, whereas m/z 41 643.2 was evenly distributed. Our reduction method is shown to generate limited delocalization of molecules on spheroid samples.
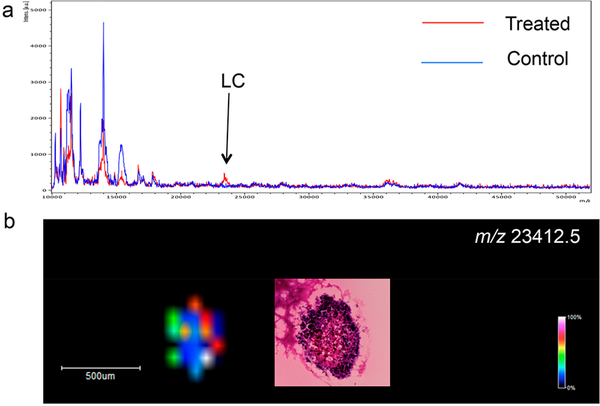
The developed method has also been applied to detect cetuximab in patient-derived CTOs, which closely mimic the complex morphological and genetic features and drug responses observed in tumors in vivo. As shown in Figure 3 and Supplemental Figure 8, the LC of cetuximab at m/z 23 412.5 was successfully detected in the treated CTOs, whereas no drug signal was observed in the control, untreated samples.
Figure 3.
Detection of cetuximab using MALDI-MSI in CTOs treated for 72 h. (a) MALDI-MS protein profiles directly acquired from treated and control CTOs. (b) Ion image showing the distribution of m/z 23 412.5 (LC of cetuximab). H&E was performed on a consecutive CTO slice.
Time-Dependent Cetuximab Penetration in HT-29 and DLD-1 Spheroids
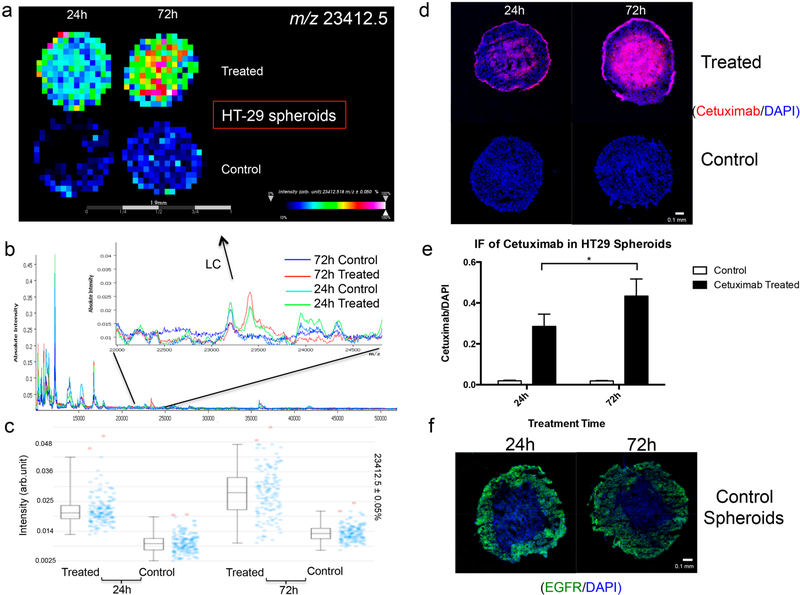
EGFR-protein-expression levels are about 8 times higher in DLD-1 cells than in HT-29 cells,43,44 which may lead to binding differences in EGFR-targeting therapeutic antibodies. Therefore, the developed method was then used to study the penetration of cetuximab in HT-29- and DLD-1-derived spheroids. They were treated for either 24 or 72 h, which were selected to exploit the long half-life of the drug, allowing it to penetrate the tissue before it is cleared from circulation. In both the HT-29 and DLD-1 spheroids, the signal from the LC of cetuximab was higher in the samples treated for 72 h than in those treated for 24 h (Figure 4a–d Supplemental Figure 9a–c), indicating an enhancement of drug levels with longer treatment times. In addition, a similar distribution pattern was observed for the spheroids treated for 24 h, in which cetuximab penetrated into the core area with a slightly higher signal intensity of the drug detected in the outer-rim region (Supplemental Figure 10a,b). However, localization of cetuximab shows differences in the samples treated for 72 h. In the HT-29 spheroids, cetuximab was found to be mainly present in the core region, whereas the drug had not accumulated in the central cells of the DLD-1 spheroids. IF was carried out to confirm the presence of cetuximab on the spheroid sections (Figure 4d and Supplemental Figures 6d and 11a,b). In accordance with the MALDI-MSI results, significantly higher levels of the drug are detected in spheroids treated for 72 h (Figure 4e and Supplemental Figure 9e). Furthermore, an accumulation of cetuximab was observed in the cores of the HT-29 spheroids, whereas in the DLD-1 spheroids treated for 72 h, an intense ring of the drug is present in the outer proliferative cells. To help explain the heterogeneous localization of cetuximab, IF staining of EGFR was performed (Figure 4f and Supplemental Figure 9f). In DLD-1 spheroids, EGFR is found to be highly expressed in cells near the edges of the spheroids, moderately expressed in the intermediate regions, and lowly expressed in the cores. Because the penetration of a drug is highly dependent on its consumption, avid binding of cetuximab to EGFR highly expressed on rim cells of DLD-1 spheroids may inhibit its further permeation into the core. However, in HT-29 spheroids, the intense ring of EGFR expression in the outer cells is less pronounced, so the drug molecules could more efficiently diffuse around and between cells and finally accumulate in the necrotic core with ample extracellular space and possibly a slow draining mechanism. This mismatch of high cetuximab uptake with low EGFR expression and vice versa is also observed in different in vivo studies,45–47 indicating that the penetration and distribution of the drug is multifactorial, dependent on drug concentration, treatment time, and upon tumor factors in addition to EGFR-expression levels. This discrepancy may help to explain the poor correlation often reported between EGFR expression and cetuximab efficacy.48
Figure 4.
(a) MALDI-MSI ion-intensity maps, (b) summed mass spectra, and (c) intensity box plots of HT-29 spheroids treated with 1 mg/mL cetuximab for 24 or 72 h. (d,e) Immunofluorescence (IF) study of cetuximab localization. Data were normalized to DAPI intensities. Statistical significance was tested using Student’s t-test (n = 6, *p < 0.05). (f) IF analysis of EGFR expression in HT-29 control spheroids.
Changes in Cell Proliferation and ATP Levels Following Cetuximab Treatment
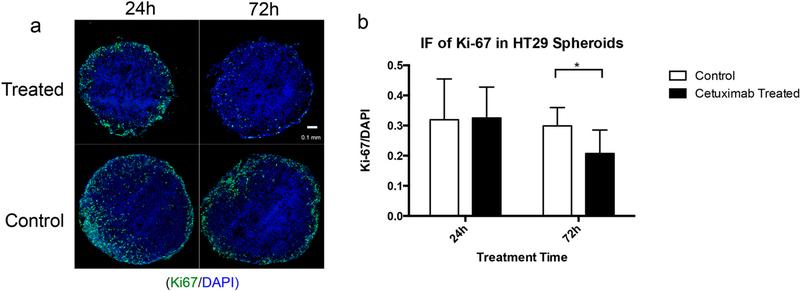
To complement the mass-spectrometric detection of cetuximab in spheroids and to evaluate a phenotypic effect of drug treatment, a proliferation study using IF staining of the proliferation marker Ki-67 was performed (Figure 5 and Supplemental Figure 12). In spheroids grown with both HT-29 and DLD-1 cells, spheroids treated for 72 h at 1 mg/mL appear to have minimal Ki-67 staining, whereas in spheroids treated for 24 h, no significant changes in cell proliferation were observed when compared with the control, indicating that the antiproliferative effect of cetuximab increases with time. This result is consistent with former studies showing that cetuximab could induce inhibition of proliferation in HT-29 and DLD-1 cells at high concentrations (≥0.1 mg/mL).45,49
Figure 5.
IF study of cell proliferation (marker: Ki-67) in HT-29 spheroids with and without cetuximab treatment. (a) Typical IF images showing distribution of Ki-67 (green) and DAPI (blue) in spheroids treated or untreated (1 mg/mL) for 24 h or 72 h. (b) Statistical relative quantification of Ki-67 changes in spheroids following drug treatment. Data were normalized to DAPI intensities. Student’s t-test was used to test the statistical significance (n = 6, *p < 0.05).
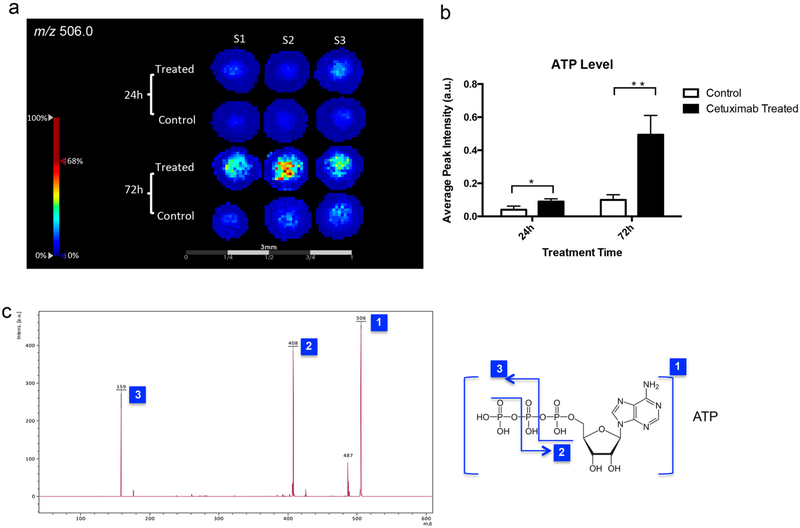
Changes in the distributions of small molecules in spheroids following drug treatment were also examined by performing MALDI-MSI. We found that the ion signal at m/z 506.0 significantly increased in the samples treated with cetuximab (Figure 6a,b). The m/z 506.0 was attributable to ATP, according to the MALDI-MS/MS spectrum (Figure 6c), indicating elevated levels of ATP in the spheroids after drug treatment. Several studies have shown that nucleotide triphosphate (NTP) levels, and in particular, ATP levels, can increase in cells responding to treatment,50–52 and increased ATP levels could reflect apoptotic changes.52 Cetuximab treatment of HT-29 cells was found to be associated with apoptosis,53 which may contribute to the increase in ATP levels observed in this study.
Figure 6.
MALDI-MSI of ATP in HT-29 spheroids with or without cetuximab treatments. (a) Ion images of ATP (m/z 506.0). (b) Average signal intensities of ATP from MALDI-MSI results (n = 6, *p < 0.05, **p < 0.01). (c) MALDI-MS/MS confirming that m/z 506.0 is the signal from ATP.
CONCLUSIONS
The most important goal of this work was to visualize therapeutic antibodies using MALDI-MSI. As a proof-ofconcept study, we used an on-tissue-reduction and -alkylation strategy to map the distribution of the anti-EGFR drug cetuximab in 3D colon-cell model systems. Time-dependent penetration and heterogeneous distribution of the drug were observed in accordance with former in vivo studies. Moreover, distinct localization patterns of cetuximab in spheroids derived from two different cell lines were found and verified with IF staining. Additionally, we have detected changes in other biological macromolecules and small molecules following drug treatment, which could be further studied. The developed approach was also used to detect cetuximab in fixed spheroid samples and patient-derived CTOs. Here, we conclude that this label-free on-tissue-reduction approach combined with MALDI-MSI has great potential for applications in testing innovative antibody drugs’ tissue and tumor distributions, which are important features for drug development and monitoring and for predicting drug efficacy and safety.
Supplementary Material
ACKNOWLEDGMENTS
We would like to thank the Mass Spectrometry and Proteomics Facility at the University of Notre Dame. This research was funded through a generous donation from Michael A. Patterson and family. A.B.H. was supported by the National Institutes of Health (R01GM110406) and the National Science Foundation (CAREER Award, CHE1351595). The UltrafleXtreme instrument (MALDI-TOFTOF) was acquired through National Science Foundation award #1625944.
Footnotes
The authors declare no competing financial interest.
ASSOCIATED CONTENT
Supporting Information
The Supporting Information is available free of charge on the ACS Publications website at DOI: 10.1021/acs.analchem.8b02151.
Reproducibility of DLD-1-spheroid diameter; MALDIISD spectrum of cetuximab in the DAN matrix; “middleup” MALDI analysis of cetuximab using IdeS-enzyme digestion followed by reduction; MALDI-MS protein profiles directly acquired from serial sections of spheroids treated with cetuximab for 72 h and not washed or washed with different washing conditions; pLSA separating spectra from cetuximab-treated and untreated spheroids; MALDI-MS protein profiles of formalin-fixed HT-29 spheroids; MALDI-MSI ion images; delocalization study of HT-29 spheroid samples with and without on-tissue reduction and alkylation; distribution of cetuximab in treated organoids analyzed using on-tissue reduction and alkylation combined with MALDI-MSI; MALDI-MSI ion-intensity maps, summed mass spectra, and intensity box plots of DLD-1 spheroids treated with 1 mg/mL cetuximab for 24 or 72 h; IF study of cetuximab localization; IF analysis of EGFR expression in DLD-1 control spheroids; localization of cetuximab in treated HT-29 or DLD-1 spheroids analyzed using on-tissue reduction and alkylation combined with MALDI-MSI; localization of cetuximab in treated HT-29 or DLD-1 spheroids analyzed using IF followed by fluorescence microscopy; and IF study of cell proliferation (marker: Ki-67) in DLD-1 spheroids with and without cetuximab treatment (PDF)
REFERENCES
- (1).Gotwals P; Cameron S; Cipolletta D; Cremasco V; Crystal A; Hewes B; Mueller B; Quaratino S; Sabatos-Peyton C; Petruzzelli L; et al. Nat. Rev. Cancer 2017, 17 (5), 286–301. [DOI] [PubMed] [Google Scholar]
- (2).Holubec L; Polivka J Jr; Safanda M Karas M; Liska V Anticancer Res. 2016, 36 (9), 4421–4426. [DOI] [PubMed] [Google Scholar]
- (3).The Lancet Oncology. Lancet Oncol. 2017, 18 (8), 981. [DOI] [PubMed] [Google Scholar]
- (4).Klener P; Otahal P; Lateckova L; Klener P Curr. Pharm. Biotechnol 2015, 16 (9), 771–781. [DOI] [PubMed] [Google Scholar]
- (5).Weiner LM Clin. Adv. Hematol. Oncol 2015, 13 (5), 299–306. [PubMed] [Google Scholar]
- (6).Harding J; Burtness B Drugs Today 2005, 41 (2), 107–127. [DOI] [PubMed] [Google Scholar]
- (7).Galizia G; Lieto E; De Vita F; Orditura M; Castellano P; Troiani T; Imperatore V; Ciardiello F Oncogene 2007, 26 (25), 3654–3660. [DOI] [PubMed] [Google Scholar]
- (8).Gapany M Yearbook of Otolaryngology-Head and Neck Surgery 2007, 2007, 255–256. [Google Scholar]
- (9).Specenier P; Vermorken JB Biol.: Targets Ther 2013, 7, 77–90. [DOI] [PMC free article] [PubMed] [Google Scholar]
- (10).Löw K; Wacker M; Wagner S; Langer K; von Briesen H Nanomedicine 2011, 7 (4), 454–463. [DOI] [PubMed] [Google Scholar]
- (11).Reuveni T; Motiei M; Romman Z; Popovtzer A; Popovtzer R Int. J. Nanomed 2011, 6, 2859–2864. [DOI] [PMC free article] [PubMed] [Google Scholar]
- (12).Zalba S; Contreras AM; Haeri A; Ten Hagen TLM; Navarro I; Koning G; Garrido MJ J. Controlled Release 2015, 210, 26–38. [DOI] [PubMed] [Google Scholar]
- (13).Shih Y-H; Peng C-L; Lee S-Y; Chiang P-F; Yao C-J; Lin W-J; Luo T-Y; Shieh M-J Oncotarget 2015, 6 (18), 16601–16610. [DOI] [PMC free article] [PubMed] [Google Scholar]
- (14).Shankaran V; Obel J; Benson AB 3rd. Oncologist 2010, 15(2), 157–167. [DOI] [PMC free article] [PubMed] [Google Scholar]
- (15).Spano J-P; Lagorce C; Atlan D; Milano G; Domont J; Benamouzig R; Attar A; Benichou J; Martin A; Morere J-F; et al. Ann. Oncol 2005, 16 (1), 102–108. [DOI] [PubMed] [Google Scholar]
- (16).Pichler BJ; Wehrl HF; Judenhofer MS J. Nucl. Med. 2008, 49, 5S–23S. [DOI] [PubMed] [Google Scholar]
- (17).Oliveira S; Cohen R; Walsum MS; van Dongen GA; Elias SG; van Diest PJ; Mali W; van Bergen En Henegouwen PM EJNMMI Res. 2012, 2 (1), 50. [DOI] [PMC free article] [PubMed] [Google Scholar]
- (18).Kuriu Y; Otsuji E; Kin S; Nakase Y; Fukuda K-I; Okamoto K; Hagiwara A; Yamagishi HJ Surg. Oncol 2006, 94 (2), 144–148. [DOI] [PubMed] [Google Scholar]
- (19).Heiduschka P; Fietz H; Hofmeister S; Schultheiss S; Mack AF; Peters S; Ziemssen F; Niggemann B; Julien S; BartzSchmidt KU; et al. Invest. Ophthalmol. Visual Sci 2007, 48 (6), 2814–2823. [DOI] [PubMed] [Google Scholar]
- (20).Roselli M; Hitchcock CL; Molinolo A; Milenic DE; Colcher D; Martin EW Jr; Hinkle GH; Schlom J Anticancer Res 1995, 15 (3), 975–984. [PubMed] [Google Scholar]
- (21).Liu X; Hummon AB Anal. Chem 2015, 87 (19), 9508–9519. [DOI] [PMC free article] [PubMed] [Google Scholar]
- (22).Liu X; Weaver EM; Hummon AB Anal. Chem 2013, 85 (13), 6295–6302. [DOI] [PMC free article] [PubMed] [Google Scholar]
- (23).Ahlf Wheatcraft DR; Liu X; Hummon AB J. Visualized Exp 2014, 94, e52313. [DOI] [PMC free article] [PubMed] [Google Scholar]
- (24).Liu X; Hummon AB Sci. Rep. 2016, 6, 38507. [DOI] [PMC free article] [PubMed] [Google Scholar]
- (25).Liu X; Flinders C; Mumenthaler SM; Hummon AB J. Am. Soc. Mass Spectrom 2018, 29 (3), 516–526. [DOI] [PMC free article] [PubMed] [Google Scholar]
- (26).Lukowski JK; Weaver EM; Hummon AB Anal. Chem 2017, 89 (16), 8453–8458. [DOI] [PMC free article] [PubMed] [Google Scholar]
- (27).LaBonia GJ; Lockwood SY; Heller AA; Spence DM; Hummon AB Proteomics 2016, 16 (11–12), 1814–1821. [DOI] [PMC free article] [PubMed] [Google Scholar]
- (28).Zanoni M; Piccinini F; Arienti C; Zamagni A; Santi S; Polico R; Bevilacqua A; Tesei A Sci. Rep 2016, 6, 19103. [DOI] [PMC free article] [PubMed] [Google Scholar]
- (29).Ait-Belkacem R; Berenguer C; Villard C; Ouafik L; Figarella-Branger D; Beck A; Chinot O; Lafitte D mAbs 2014, 6 (6), 1385–1393. [DOI] [PMC free article] [PubMed] [Google Scholar]
- (30).van Remoortere A; van Zeijl RJM; van den Oever N; Franck J; Longuespée R; Wisztorski M; Salzet M; Deelder AM; Fournier I; McDonnell LA J. Am. Soc. Mass Spectrom 2010, 21 (11), 1922–1929. [DOI] [PubMed] [Google Scholar]
- (31).Leinweber BD; Tsaprailis G; Monks TJ; Lau SS J. Am. Soc. Mass Spectrom 2009, 20 (1), 89–95. [DOI] [PMC free article] [PubMed] [Google Scholar]
- (32).Mainini V; Bovo G; Chinello C; Gianazza E; Grasso M; Cattoretti G; Magni F Mol. BioSyst 2013, 9 (6), 1101–1107. [DOI] [PubMed] [Google Scholar]
- (33).Williams TL; Andrzejewski D; Lay JO; Musser SM J. Am. Soc. Mass Spectrom 2003, 14 (4), 342–351. [DOI] [PubMed] [Google Scholar]
- (34).Franck J; Longuespée R; Wisztorski M; Van Remoortere A; Van Zeijl R; Deelder A; Salzet M; McDonnell L; Fournier I Med. Sci. Monit. 2010, 16 (9), BR293–BR299. [PubMed] [Google Scholar]
- (35).Sato T; Stange DE; Ferrante M; Vries RGJ; Van Es JH; Van den Brink S; Van Houdt WJ; Pronk A; Van Gorp J; Siersema PD; et al. Gastroenterology 2011, 141 (5), 1762–1772. [DOI] [PubMed] [Google Scholar]
- (36).Weaver EM; Hummon AB Adv. Drug Delivery Rev 2013, 65 (8), 1039–1055. [DOI] [PubMed] [Google Scholar]
- (37).Li H; Hummon AB Anal. Chem 2011, 83 (22), 8794–8801. [DOI] [PubMed] [Google Scholar]
- (38).Smyth MJ Immunol. Cell Biol 2017, 95 (4), 323–324. [DOI] [PubMed] [Google Scholar]
- (39).Green-Mitchell SM; Cazares LH; Semmes OJ; Nadler JL; Nyalwidhe JO Proteomics: Clin. Appl 2011, 5 (7−8), 448–453. [DOI] [PMC free article] [PubMed] [Google Scholar]
- (40).Groseclose MR; Andersson M; Hardesty WM; Caprioli RM J. Mass Spectrom 2007, 42 (2), 254–262. [DOI] [PubMed] [Google Scholar]
- (41).Demeure K; Quinton L; Gabelica V; De Pauw E Anal. Chem 2007, 79 (22), 8678–8685. [DOI] [PubMed] [Google Scholar]
- (42).Zhang Y; Liu X Bioanalysis 2018, 10, 519. [DOI] [PubMed] [Google Scholar]
- (43).Li S; Buchbinder E; Wu L; Bjorge JD; Fujita DJ; Zhu S Discoveries Rep. 2014, 1 (1), No. e1. [Google Scholar]
- (44).Beji A; Horst D; Engel J; Kirchner T; Ullrich A Clin. Cancer Res. 2012, 18 (4), 956–968. [DOI] [PubMed] [Google Scholar]
- (45).Magdeldin T; López-Dávila V; Villemant C; Cameron G; Drake R; Cheema U; Loizidou M J. Tissue Eng 2014, 5, 204173141454418. [DOI] [PMC free article] [PubMed] [Google Scholar]
- (46).Aerts HJWL; Dubois L; Hackeng TM; Straathof R; Chiu RK; Lieuwes NG; Jutten B; Weppler SA; Lammering G; Wouters BG; et al. Radiother. Oncol 2007, (3), 326–332. [DOI] [PubMed] [Google Scholar]
- (47).Aerts HJWL; Dubois L; Perk L; Vermaelen P; van Dongen GAMS; Wouters BG; Lambin PJ Nucl. Med 2009, 50 (1), 123–131. [DOI] [PubMed] [Google Scholar]
- (48).Hebbar M; Wacrenier A; Desauw C; Romano O; Cattan S; Triboulet J-P; Pruvot F-R Anti-Cancer Drugs 2006, 17 (7), 855–857. [DOI] [PubMed] [Google Scholar]
- (49).Levy EM; Sycz G; Arriaga JM; Barrio MM; von Euw EM; Morales SB; González M; Mordoh J; Bianchini M Innate Immun. 2009, 15 (2), 91–100. [DOI] [PubMed] [Google Scholar]
- (50).Boddie AW Jr; Constantinou A; Williams C; Reed A Br. J. Cancer 1998, 77 (9), 1395–1404. [DOI] [PMC free article] [PubMed] [Google Scholar]
- (51).Walenta S; Feigk B; Wachsmuth I; Dunkern T; Degani H; Mueller-Klieser W Int. J. Oncol 2002, 21 (2), 289–296. [PubMed] [Google Scholar]
- (52).Lutz NW C. R. Chim 2006, 9 (3–4), 445–451. [Google Scholar]
- (53).Yu Y; Guo M; Wei Y; Yu S; Li H; Wang Y; Xu X; Cui Y; Tian J; Liang L; et al. Oncotarget 2016, 7 (49), 80888–80900. [DOI] [PMC free article] [PubMed] [Google Scholar]
Associated Data
This section collects any data citations, data availability statements, or supplementary materials included in this article.


