Abstract
The amygdala plays a critical role in emotional processing and has been implicated in the etiology of numerous psychiatric disorders. It is an evolutionarily ancient structure that is enlarged in primates relative to rodents. Certain amygdala nuclei, such as the lateral nucleus, show relatively greater phylogenetic expansion than other nuclei. However, it is unknown whether there is also differential alteration in neuronal features. To address this question, we examined the dendritic arbors of principal neurons, visualized by using the Golgi method, in the lateral and central nuclei of young adult rhesus macaques and rats. Total dendritic length is greater in the macaque than in the rat. Dendritic trees are increased by 250% in length in the lateral nucleus of the monkey compared with the rat (6,009 μm vs. 2,473 μm); dendritic tree length in the central nucleus is increased by 50% (1,786 μm vs. 1,232 μm). Somal volume is increased 62% between species in the lateral nucleus and 48% in the central nucleus. Spine density is lower on macaque lateral nucleus dendrites compared with rat (− 22%) but equivalent in the central nucleus. Spines are equally long in the lateral nucleus of rat and macaque, but spines are longer by about 20% in the central nucleus of the macaque. The alterations in dendritic structure that we observed between the two species suggest differences in the number and spacing of inputs into these nuclei that undoubtedly influence amygdala function.
INDEXING TERMS: amygdala, neuron, dendrite, Golgi, lateral nucleus, central nucleus
The amygdala is a medial temporal lobe structure that is involved in evaluating environmental stimuli for potential dangers and modulating an array of emotional processes, including fear and anxiety (Amaral, 2003; Ambroggi et al., 2008; Davis and Shi, 2000; Rauch et al., 2003; Roozendaal et al., 2009; Shabel and Janak, 2009). Disruptions in amygdala structure and function have been linked to an array of psychiatric conditions, including schizophrenia, autism, and depression (Pezawas et al., 2005; Schumann et al., 2004; Shenton et al., 2001). To model environmental and genetic alterations that impact amygdala function, rodents are frequently used (see, e.g., Balleine and Killcross, 2006; Pitkanen et al., 1997). However, because of the limited behavioral repertoire of rodents, primates are used for many studies on the perception of more complex environmental stimuli, such as faces (Adolphs, 2003; Jabes et al., 2010).
The amygdala displays substantial evolutionary enlargement between rodents and primates. It increases in volume approximately 20-fold in rhesus macaques relative to rats (Chareyron et al., 2011; Stephan and Andy, 1977). This enlargement is less than the total brain volume increase of roughly 50-fold between these species (Chareyron et al., 2011). What is not clear from available studies is whether there are significant species differences in the amygdala at the cellular level.
The amygdala is comprised of several distinct nuclei. As a first approximation, information from higher order unimodal sensory cortices and polysensory association cortices enters the amygdala via the lateral nucleus (for reviews see McDonald, 1998; Sah and Lopez De Armentia, 2003). It then proceeds via the basal nucleus to the central nucleus, which sends outputs to regions such as the hypothalamus and periaqueductal gray, modulating the autonomic nervous system (Fudge and Tucker, 2009; Pitkanen and Amaral, 1991; Stefanacci et al., 1992).
Interestingly, the amygdala enlargement in rhesus macaque relative to rat is not evenly distributed between nuclei. There are approximately 40-fold increases in the volumes of the lateral, basal, and accessory basal nuclei (Chareyron et al., 2011). The central nucleus, on the other hand, increases in volume by only eightfold (Chareyron et al., 2011). These enlargements are not fully explained by increases in neuron and glia numbers. In fact, cellular density is lower in rhesus macaques (Chareyron et al., 2011). Therefore, many cellular components are likely to display nucleus-specific alterations between rats and macaques.
There is currently no comparative quantitative information on the dendritic structure of principal neurons in the rat and rhesus macaque amygdala. To address this gap, we characterized the organization of the dendrites of principal neurons in the lateral and central nuclei of rat and rhesus macaque amygdala using Golgi-Cox preparations. The goal of this study was not to carry out a comprehensive analysis of all neuronal types in the amygdala but rather to directly compare easily identified neurons in the lateral and central nuclei of the rat and rhesus macaque.
MATERIALS AND METHODS
Tissue acquisition
Three 4-year-old, male rhesus macaques (Macaca mulatta) and four 2-month-old, male Sprague-Dawley rats (Rattus norvegicus) were used for this study. We matched ages between species based on the time of sexual maturity in males (Zilles et al., 1988). The rats were acquired at 6 weeks of age and housed in caged pairs on a ventilated rack with ad libitum access to water and food until they were sacrificed. The macaques were born from multiparous mothers and raised at the California National Primate Research Center (CNPRC). They were maternally reared in 2,000-m2 outdoor enclosures and lived in large social groups until they were sacrificed. Only neurologically unremarkable macaques that were selected to be culled for colony management were used in this study. Sacrifices were conducted after animals had been deeply anesthetized via pericardial perfusion with 4% paraformaldehyde in 0.1 M phosphate buffer (pH 7.2), following our laboratory’s standard protocol (Lavenex et al., 2002, 2004, 2006). All protocols were approved by the Institutional Animal Care and Use Committee of the University of California, Davis, and were in accordance with the National Institutes of Health guidelines for the use of animals in research.
Golgi processing
Dendritic arbors were visualized using a modified Golgi-Cox method. In the macaque monkey, a block 4 cm on each side containing the amygdala was isolated from the right hemisphere of the brain. For the rat, the whole brain was used. The tissue was immersed in a solution that contained 100 ml of 5% potassium dichromate, 100 ml of 5% mercuric chloride, 80 ml of 5% potassium chromate, and 200 ml double-distilled (dd) H2O for 8 weeks. It was then dehydrated and embedded in 10% parlodion (prepared from parlodion strips; Fisher Scientific, Fair Lawn, NJ). The blocks were sectioned in the coronal plane at 150 μm thickness on a sliding microtome and collected in 70% EtOH. Stained elements were visualized via 10-minute immersion in a solution of 12.5% NH4OH. After development, the tissue was fixed for 5 minutes with Kodak Professional fixer (Eastman Kodak, Rochester, NY) and counterstained for 1 minute in 0.125% thionin. The sections were dehydrated through a series of 50%, 70%, 95%, and 100% ethanol; equal parts of 100% ethanol and 100% propanol; and finally xylene, and were coverslipped using DPX (VWR International, Prode, England).
Data collection
All data were collected from the right amygdala. The lateral nucleus was selected as a region of analysis because of a recent finding that it is enlarged nearly 40-fold between rat and rhesus macaque (Chareyron et al., 2011) and its role as a primary input nucleus of the amygdala (LeDoux et al., 1990; Stefanacci and Amaral, 2000). The medial division of the central nucleus was selected as a region of analysis because of the relatively limited (eightfold) enlargement of the central nucleus between rat and rhesus macaque in a recent study (Chareyron et al., 2011) and its role in conveying amygdala output to autonomic and visceral regions of the brainstem (LeDoux, 1998; Price and Amaral, 1981; Rizvi et al., 1991).
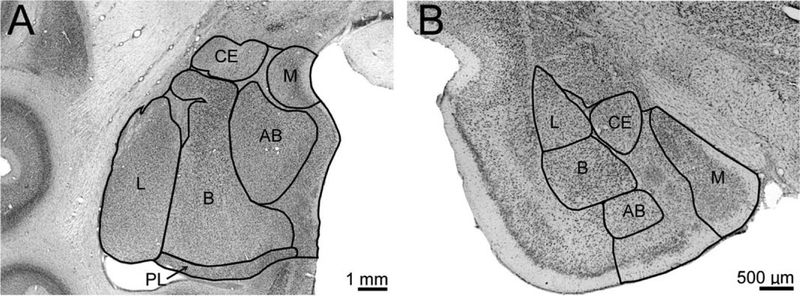
The lateral and central nuclei were delineated in accordance with prior neuroanatomical studies of these regions in the rat (Chareyron et al., 2011; Pitkanen et al., 2000) and rhesus macaque (Amaral et al., 1992; Chareyron et al., 2011; Pitkanen et al., 1998; Price et al., 1987; Fig. 1). Principal neurons of the lateral nucleus were identified on the basis of a large soma and densely packed spines on most secondary and tertiary dendritic branches. These distinguishing characteristics have been consistently observed for “type I” or “spiny projection” neurons across a wide array of mammalian species (Braak and Braak, 1983; Hall, 1972; Herzog, 1982; Kamal and Tombol, 1975; McDonald, 1982b, 1984; McDonald and Culberson, 1981; Millhouse and DeOlmos, 1983; Rowniak et al., 2003; Tombol and Szafranska-Kosmal, 1972; Washburn and Moises, 1992). Principal neurons in the lateral nucleus (n = 10 per case) were selected for analysis to achieve an even distribution along dorsoventral, rostrocaudal, and mediolateral axes. “Medium spiny” principal neurons in the medial portion of the central nucleus (n = 10 per case) were identified by the presence of several relatively straight dendritic segments, an absence of spines on primary dendrite branches, and moderate spine density on secondary and tertiary dendrite branches (Hall, 1972; Kamal and Tombol, 1975; McDonald, 1982a; Schiess et al., 1999; Tombol and Szafranska-Kosmal, 1972).
Figure 1.
Nissl-stained images of coronal sections through the amygdala of the rhesus monkey (A) and rat (B) illustrate the locations of major amygdala nuclei. Adapted with permission from Chareyron et al. (2011). AB, accessory basal nucleus; B, basal nucleus; CE, central nucleus; L, lateral nucleus; M, medial nucleus; PL, paralaminar nucleus. Note that images are not at the same magnification. Scale bars = 1 mm in A; 500 μm in B.
The full dendritic arbor of each selected cell was traced in Neurolucida 9.14.2 (MBF Bioscience, Williston, VT) on a Zeiss Axioimager D2 microscope with a Zeiss Axiocam MRc camera and a × 100 objective (1.3 NA). The dendrites were followed through multiple serial sections. Stained blood vessels and the relative positions of multiple dendritic branches were used for alignment between sections.
One dendrite per neuron was selected for spine density and morphological analyses using a random-number generator (http://www.random.org). All spines on that dendrite were marked and classified into one of six morphological categories (thin, filopodial, stubby, mushroom, branched, and detached). These categories reflect an expansion of the thin, stubby, and mushroom spine types defined by Peters and Kaiserman-Abramof (1970). The additional spine types that were identified we called filopodial (thin spines without any clear head), branched (spines that branch from a single stalk into two mushroom-shaped terminations), and detached (spines that appear as a spherical head disconnected from the dendrite; Dall’Oglio et al., 2010). After tracing, dendritic characteristics were calculated using Neurolucida Explorer 9.0 software (MBF Bioscience). To estimate spine number and density, we corrected for the number of spines obscured by the dendritic shaft using obtained measures of dendritic thickness and spine length (Stirling and Bliss, 1978). The distance between the terminations of neighboring dendrites was calculated by examining the three-dimensional distance from each individual dendritic end point to all other dendritic end points. Dendritic tortuosity was calculated by dividing the absolute distance between the origin and end of a dendritic branch by the measured length along the branch.
Two-dimensional composite photomicrographs of dendritic arbors were constructed from serial, through-focus images (separated by 1.5 μm) of a single section in Adobe Photoshop 11.0.2 (Adobe Systems, San Jose, CA). The image in which the soma was in sharpest focus was used as a base. The dendritic segments that were in focus in each serial image were cut out and aligned with segments from neighboring serial images in the base image. This resulted in a flattened, two-dimensional composite of the neuron’s full dendritic arbor within a section. Some incidental dendrites from the base image that were not part of the composite arbor were edited out of the photomicrograph. In figures with multiple photomicrographs, contrast and brightness levels were adjusted to improve consistency. Three-dimensional reconstructions of the dendritic arbors were generated in Neurolucida Explorer. The dendrites were manually corrected to a consistent thickness for illustration purposes in Adobe Photoshop.
Sholl plots of average dendritic branching and spine density were generated using data from Neurolucida Explorer. The distance intervals reported were selected to be consistent with prior publications (Elston et al., 2005, 2010a). Dendritic branching was plotted out to the maximum range of the longest dendritic arbor. Average spine density values were plotted out to the distance at which at least three neurons still had dendritic arbors. At distances with fewer than three arbors, spine density data became extremely noisy and difficult to interpret.
Statistical analysis
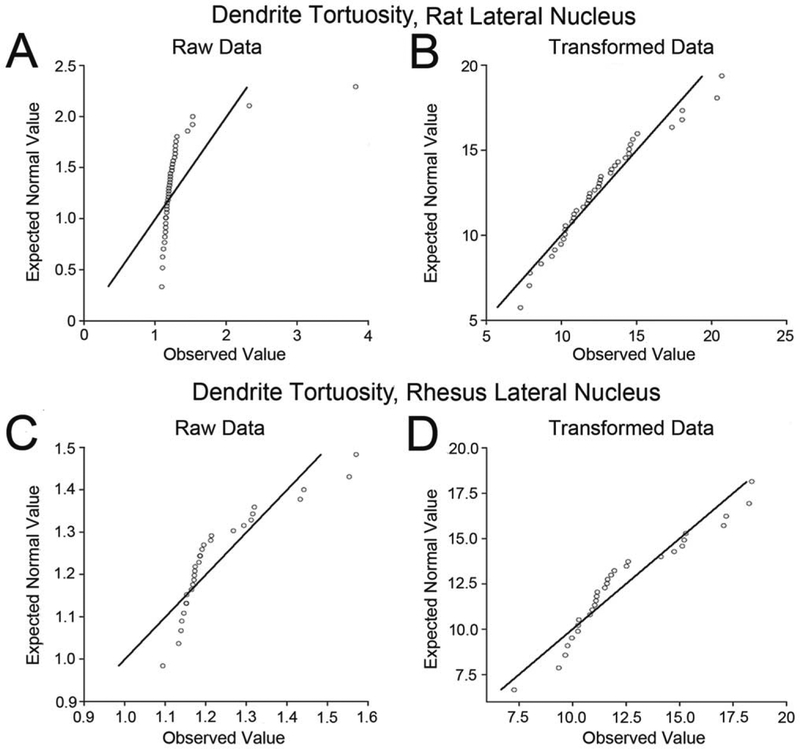
All analyses were performed in IBM SPSS Statistics 19.0 software (IBM, Armonk, NY) except where otherwise noted. A general linear mixed model (GLMM) was used to analyze group differences, because multiple observations were performed in each case. The GLMM is a parametric test that requires normally distributed data and does not have a readily available nonparametric equivalent. We tested the normality of each data set using a one-sample Kolmogorov-Smirnov test. Several data sets had a significantly non-normal distribution. Therefore, all data sets were transformed using the Box-Cox method to improve normality (Fig. 2) with XLStat 2011.5 software (Addinsoft, New York, NY). The Box-Cox transformation is defined by the equation (and if λ = 0). For each data set, we used XLStat to solve for the value of λ that most improved the data set’s normality (for review see Spitzer, 1982). After transformation, we verified the normality of all of the data sets via one-sample Kolmogorov-Smirnov test.
Figure 2.
Effects of the Box-Cox transformation to improve normality in two data sets that were not normal prior to transformation. Each figure is a Q-Q plot, which compares the observed values (x-axis) to the values that would be predicted in a normal distribution (y-axis). Deviation of the data set (circles) from the diagonal line indicates deviation from perfect normality. A: Q-Q plot of the pretransformation distribution of dendritic tortuosity in rat lateral nucleus principal neurons. The sharp deviation from the diagonal line indicates significant non-normality in the data set (P < 0.001). B: Q-Q plot demonstrating the normalized distribution of dendritic tortuosity in rat lateral nucleus principal neurons following Box-Cox transformation (λ = −4.29). This distribution is not significantly non-normal (P = 0.65). C: Q-Q plot of pretransformation distribution of dendritic tortuosity in rhesus macaque lateral nucleus principal neurons, which is significantly non-normal (P = 0.03). D: Q-Q plot of post-transformation distribution of dendritic tortuosity in rhesus macaque lateral nucleus principal neurons, which is not significantly non-normal (P = 0.20).
We tested species and nuclei differences in dendritic features using the GLMM with the normalized data. All significant results from the GLMM tests were confirmed by running a generalized estimating equations test on the same data. We also tested the data sets without Box-Cox transformation to ensure that Box-Cox transformation did not change nonsignificant group differences into significant differences. We assessed the relationship between somal volume and several dendritic features via GLMM, correcting for nucleus and species.
We also wanted to determine whether the proportional lateral and central amygdala nuclei volumes in rat and macaque reflect phylogenetic differences or instead vary specifically with brain volume. Therefore, we performed a linear regression analysis on previously reported amygdala volume values (Stephan et al., 1981, 1987) for dozens of different species in the same evolutionary groups as our experimental species. We examined the relationships among total brain volume, species group (rodent/insectivore vs. primate), and proportional volume of the amygdala occupied by the basal and lateral nuclei via linear regression analysis. Rodents and other nonprimate insectivores were grouped together to provide a pool of species with a wide range of total brain volumes for analysis of volumetric scaling relationships.
RESULTS
Lateral nucleus principal neurons in the rhesus macaque and rat
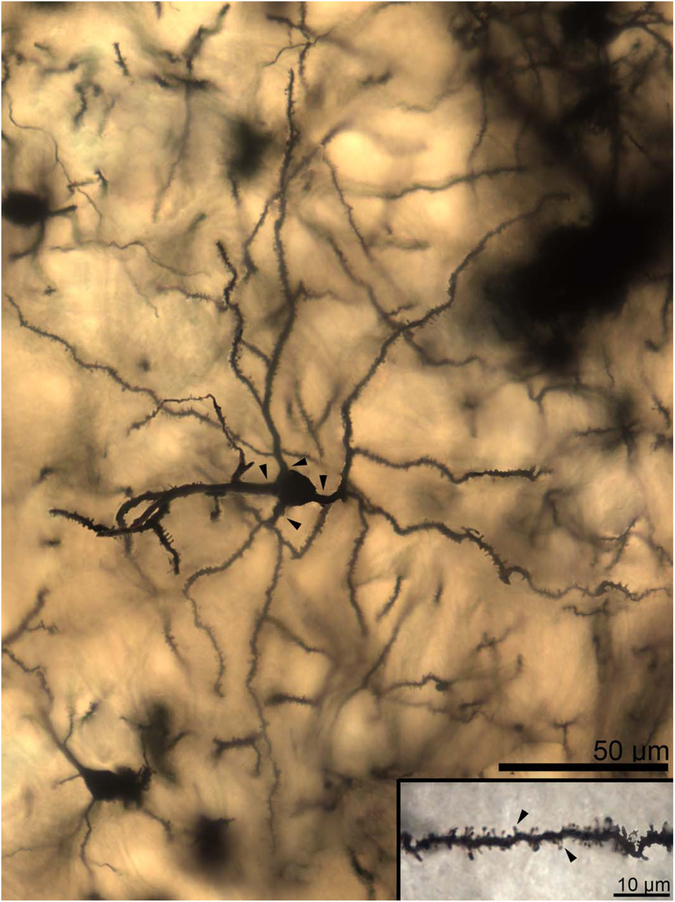
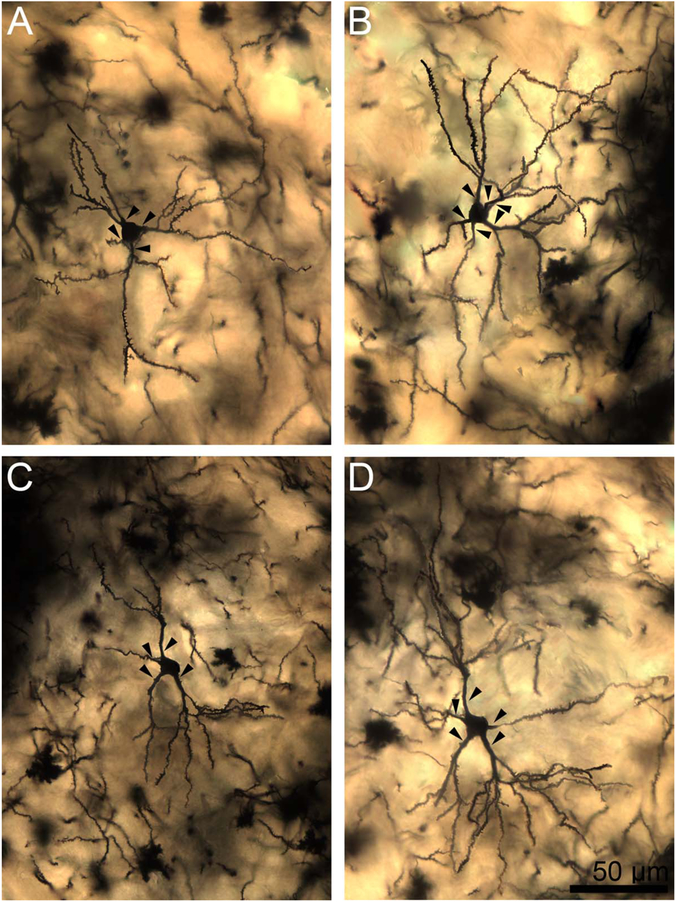
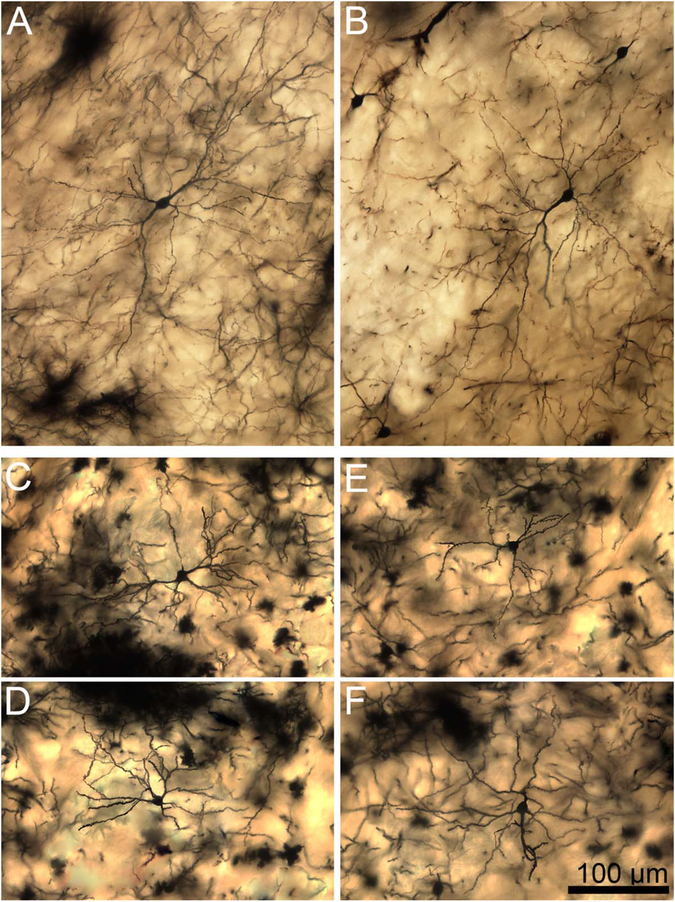
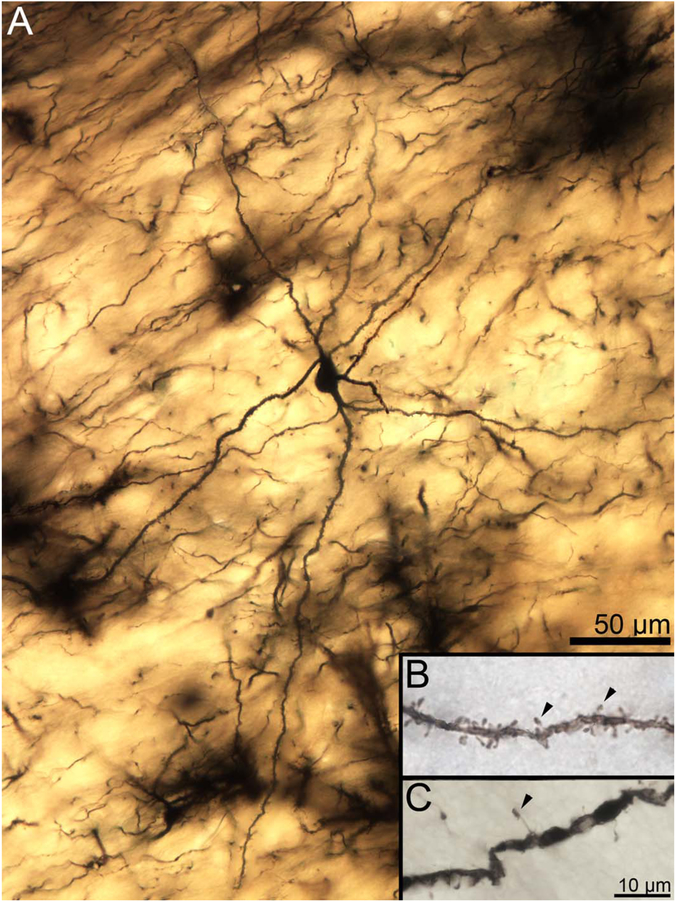
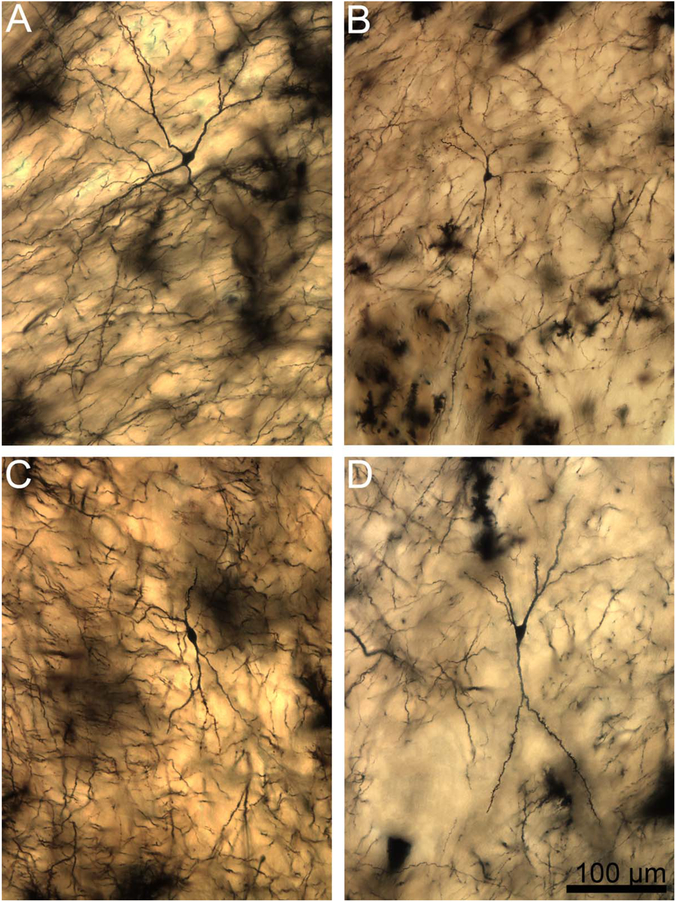
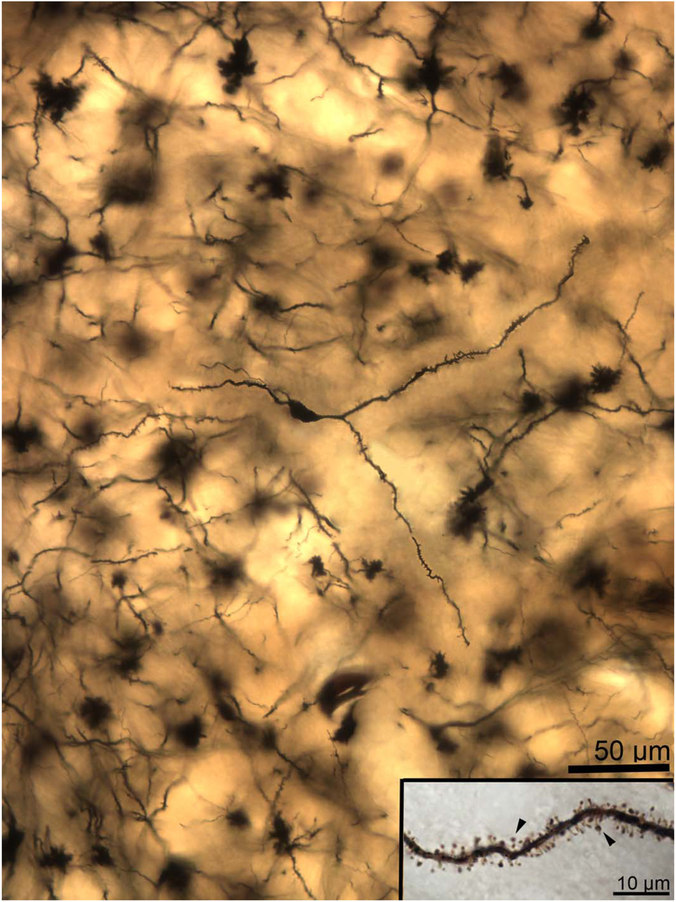
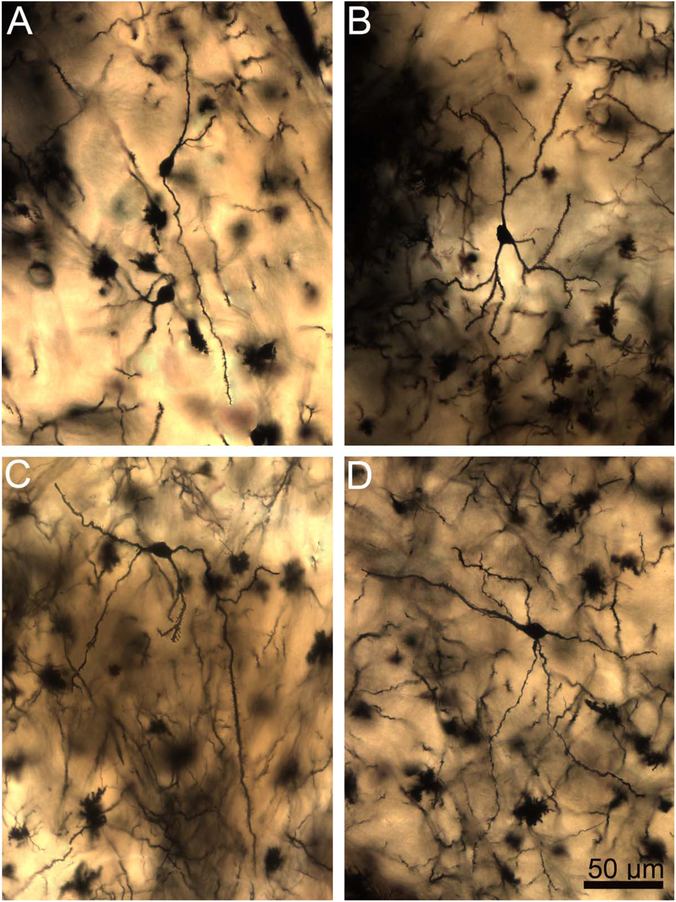
In the rhesus macaque lateral nucleus, principal neuron dendritic arbors branched extensively at both primary and secondary levels (Figs. 3, 4). In the rat, multiple branches were also present at the primary level in nearly all dendritic arbors (Figs. 5, 6). However, the number of branches was typically lower than in macaque, and secondary branching was less frequent (Fig. 7). The dendritic arbors extended for a much greater distance from the soma in the macaque than in the rat (Fig. 7).
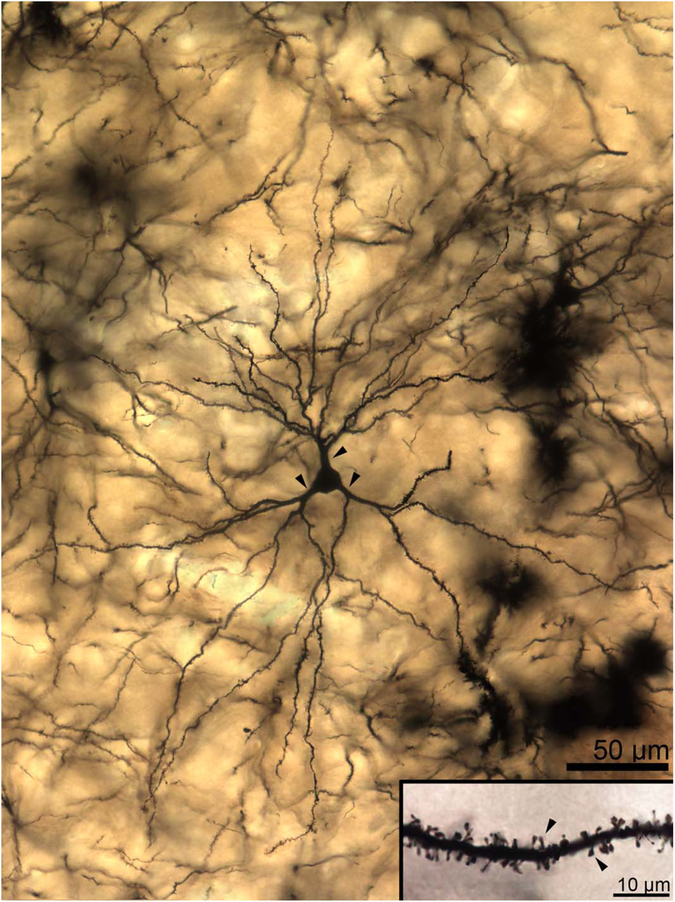
Figure 3.
Two-dimensional composite photomicrograph of the dendritic arbor of a rhesus macaque lateral nucleus principal neuron. Three large primary dendrites are visible (arrowheads). Each of the primary dendrites branches extensively, as do many but not all of the secondary dendrites. Inset: High-magnification image of a secondary dendrite showing spine features. Spines are large, moderately densely packed, and frequently mushroom shaped (arrowheads indicate exemplars), with a few “stubby” spines visible. Scale bars = 50 μm; 10 μm in inset.
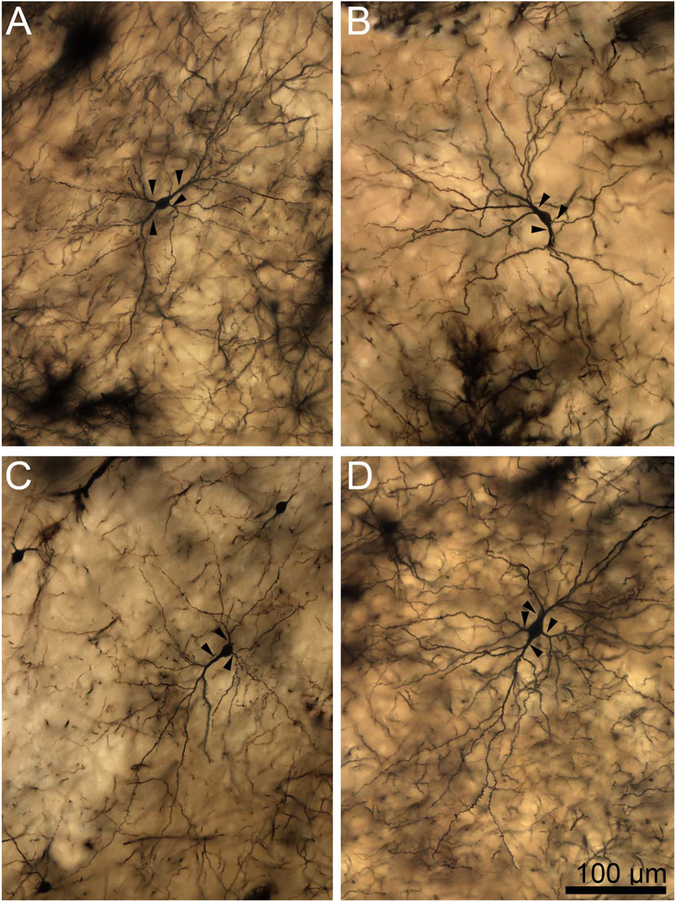
Figure 4.
Two-dimensional composite photomicrographs of the dendritic arbors of four rhesus macaque lateral nucleus principal neurons. In A,B,D, there are two large primary dendrites and one to two smaller primary dendrites (arrowheads). In C, there is one large primary dendrite and two smaller primary dendrites (arrowheads). Extensive branching from the primary dendrites is present in all cells. There are more branches in the arbors with larger primary dendrites. There is branching from the secondary dendrites in most dendritic trees, particularly those with larger primary segments. Scale bar = 100 μm.
Figure 5.
Two-dimensional composite photomicrograph of the dendritic arbor of a rat lateral nucleus principal neuron. Each of the primary dendrites (arrowheads) branch extensively. Secondary dendrite branching is present in some instances. Inset: High-magnification image of a secondary dendrite showing spine features. The spines are small to moderate in size, very densely packed, and frequently mushroom shaped (arrowheads indicate exemplars). Scale bars = 50 μm; 10 μm in inset.
Figure 6.
A–D: Two-dimensional composite photomicrographs of the dendritic arbors of four rat lateral nucleus principal neurons. Each neuron has four to six primary dendrites (arrowheads), with some variability in size. Each of the primary dendrites branches extensively. Secondary dendrite branching is present in some instances. Scale bar = 50 μm.
Figure 7.
Two-dimensional composite photomicrographs of the dendritic arbors of macaque (A,B) and rat (C–F) lateral nucleus principal neurons at the same scale. The macaque dendritic arbors extend farther from the soma, and have more branches, than the rat dendritic arbors. Scale bar = 100 μm.
In both species, there were typically one to three primary dendrites that were much thicker at their origins than throughout the remaining primary dendrites (e.g., Figs. 4A,C, 6A,C). The larger primary dendrites did not display any consistent orientation within the nucleus. There were sharp local deflections of nearly 90° in the path of some dendrites in both species, a feature rarely reported for neurons in the neocortex. The primary branches of the dendritic arbors typically had very sparse spines, which most commonly had a “stubby” morphology. On the secondary and tertiary branches, spines were densely packed and frequently had a “mushroom-shaped” morphology, with an infrequent “stubby” morphology (Figs. 3, 5).
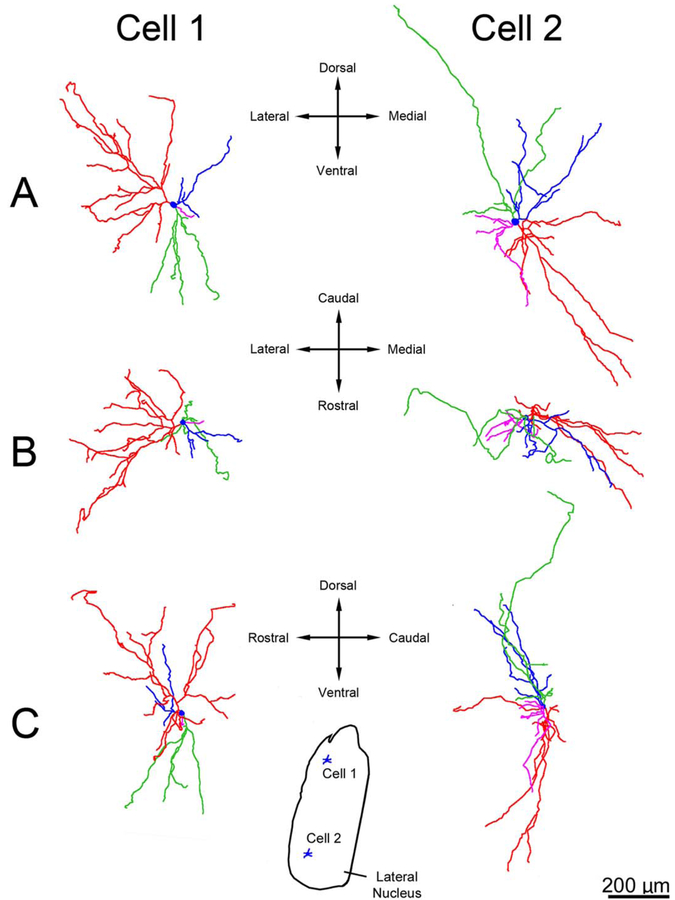
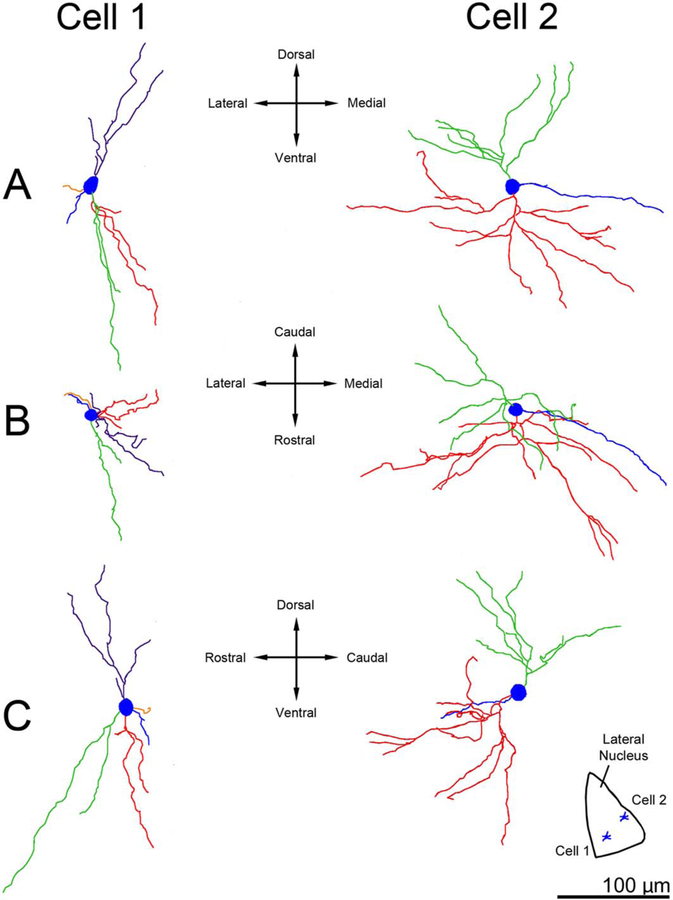
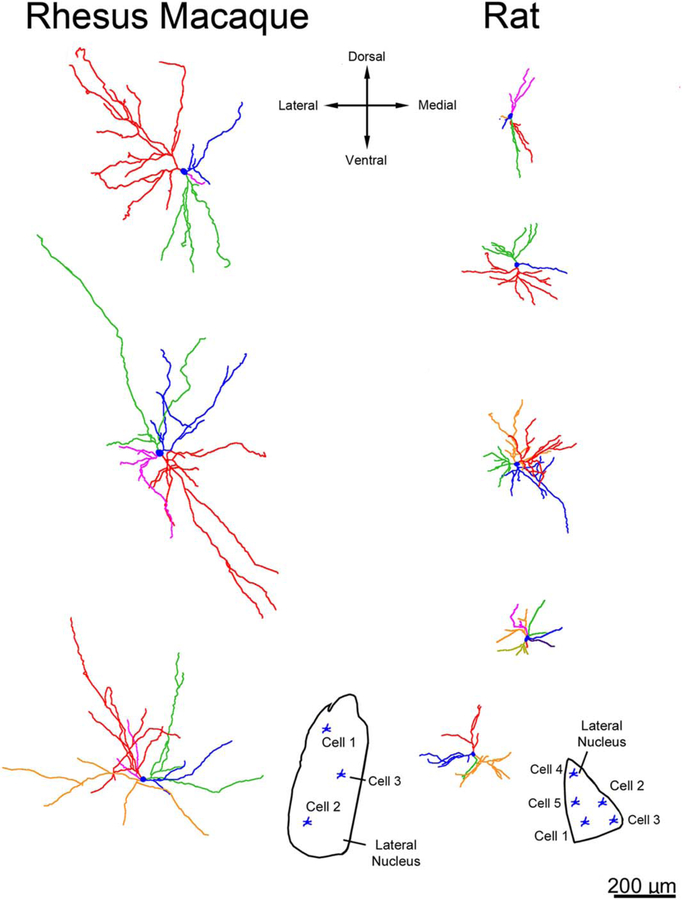
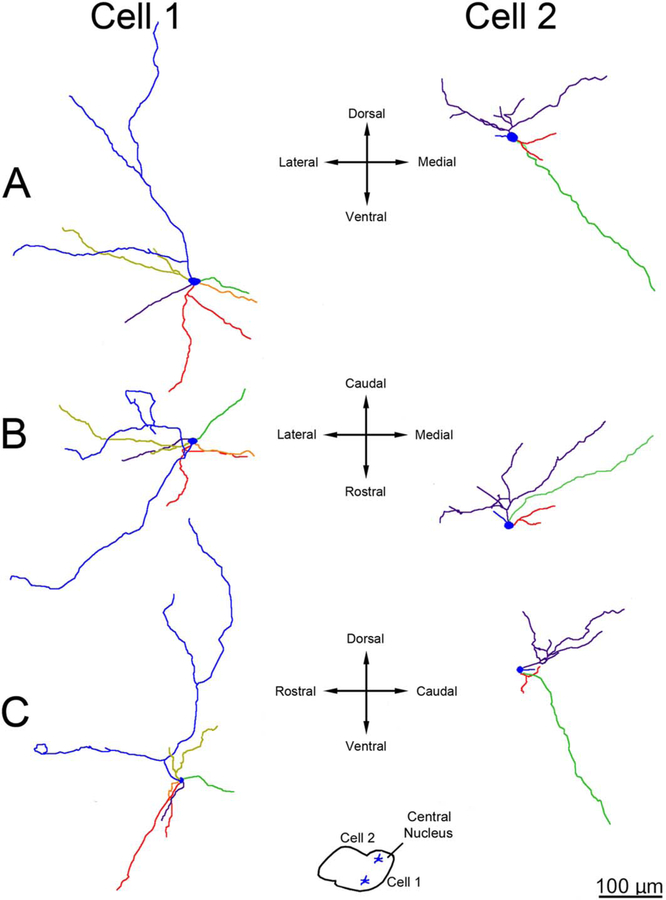
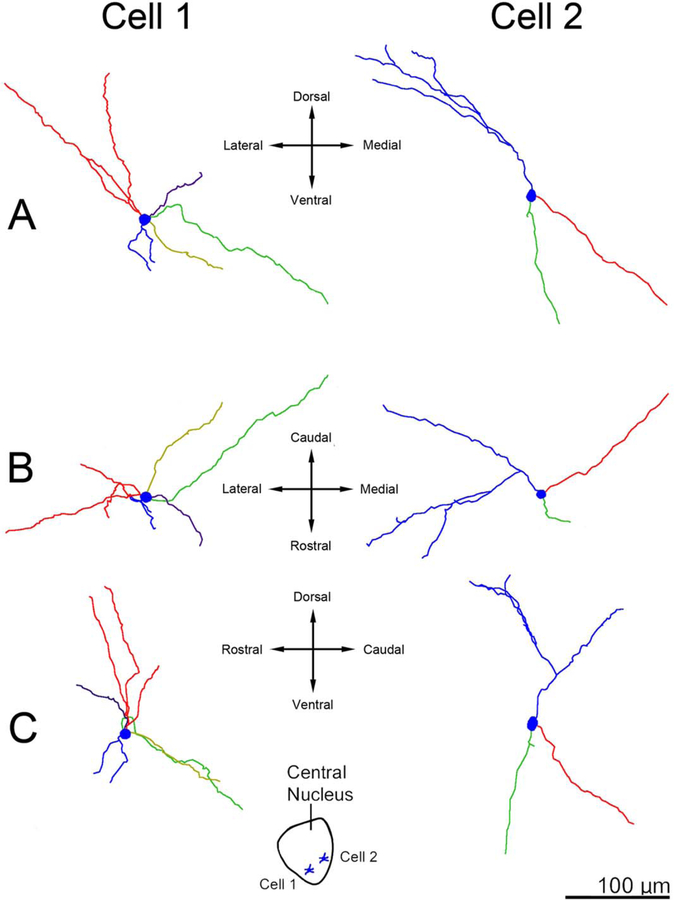
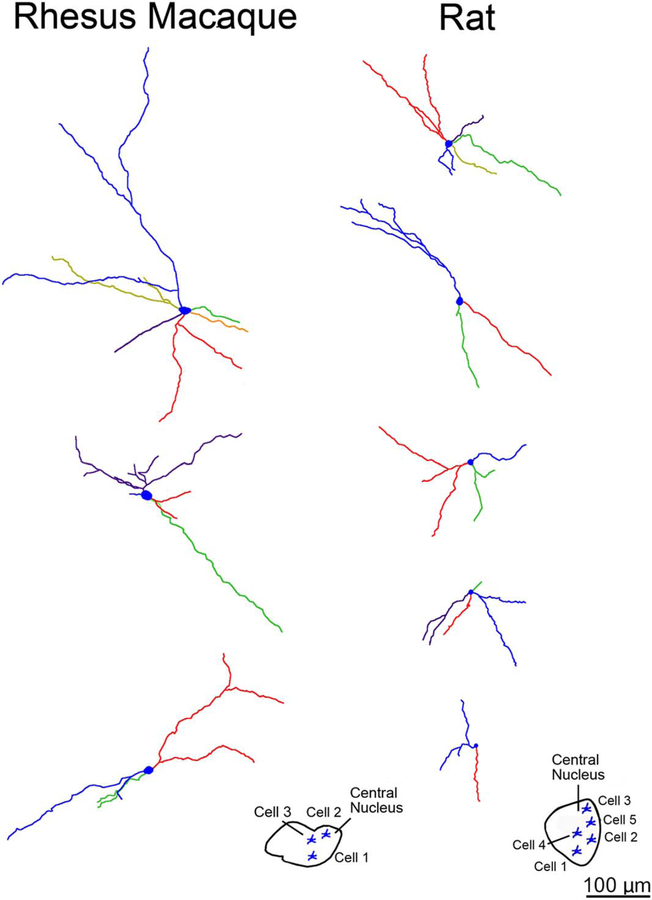
Examining lateral nucleus neurons in three-dimensional Neurolucida renderings, we observed that multiple dendritic branches emanating from a single primary dendrite often had terminations that were clustered closely together in both macaque (Fig. 8) and rat (Fig. 9). In fact, terminal dendritic arbors clustered more closely in the lateral nucleus than in the central nucleus (nearest neighbor distance of 72 μm vs. 112 μm in macaque, P < 0.001; 46 μm vs. 83 μm in rat, P < 0.001). We also observed greater branching and larger dendritic arbors in macaque relative to rat (Fig. 10).
Figure 8.
Three-dimensional reconstructions showing examples of principal neuron dendritic arbor structure in rhesus macaque lateral nucleus. A: Appearance of the dendritic arbors from a rostral viewpoint. B: Appearance of the dendritic arbors from a dorsal viewpoint. C: Appearance of the dendritic arbors from a lateral viewpoint. The color coding indicates individual dendritic trees. Several dendritic trees, such as the green tree in cell 1 and the red tree in cell 2, have a majority of terminations that are clustered relatively closely together. Cell locations within the lateral nucleus are indicated in the center inset. Only dendrites and cell bodies are illustrated; axons are not included. Scale bar = 200 μm.
Figure 9.
Three-dimensional reconstructions showing examples of principal neuron dendritic arbor structure in rat lateral nucleus. A: Appearance of the dendritic arbors from a rostral viewpoint. B: Appearance of the dendritic arbors from a dorsal viewpoint. C: Appearance of the dendritic arbors from a lateral viewpoint. The color coding indicates individual dendritic trees. Several dendritic trees, such as the red and purple trees in cell 1, have a majority of terminations that are clustered relatively closely together. Cell locations are indicated in the insets. Only dendrites and cell bodies are illustrated; axons are not included. Scale bar = 100 μm.
Figure 10.
Three-dimensional reconstructions showing examples of principal neuron dendritic arbor structure in rhesus macaque and rat lateral nucleus from a rostral viewpoint at equivalent scale. The color coding indicates individual dendritic trees. The macaque dendritic arbors extend farther from the soma, and branch more frequently, than the rat dendritic arbors. Cell locations are indicated in the insets. Only dendrites and cell bodies are illustrated; axons are not included. Scale bar = 200 μm.
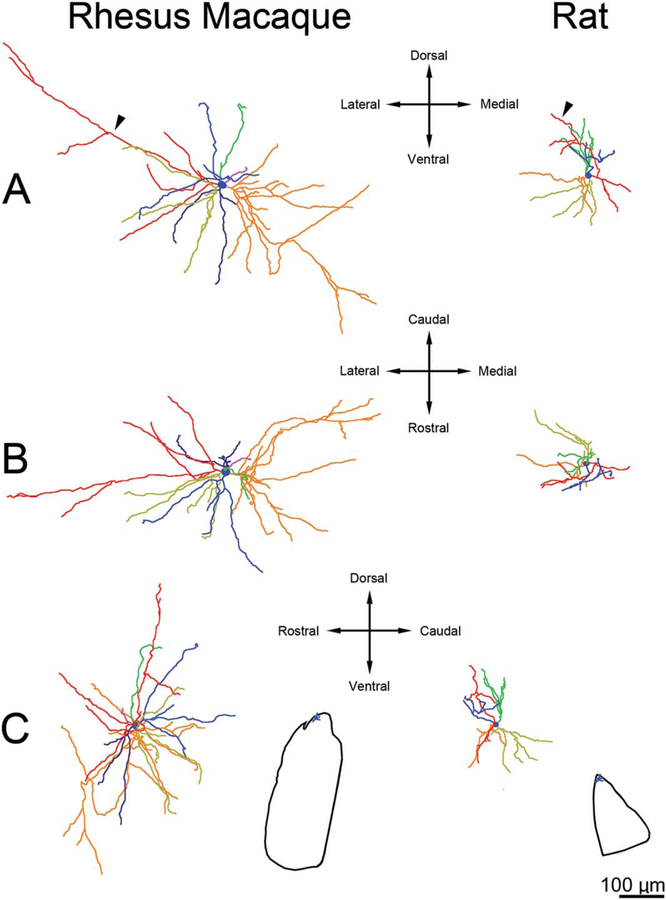
Three of the lateral nucleus principal neurons that we studied extended a dendrite into the external capsule (n = 2 rhesus macaque, n = 1 rat). These neurons exhibited unusual dendritic features relative to most lateral nucleus neurons. The arbors were more evenly distributed around the cell and branched less frequently (Fig. 11). A few dendrites circled the cell body closely, which was not observed in other lateral nucleus neurons (Fig. 11).
Figure 11.
Three-dimensional reconstructions showing examples of dendritic arbors of principal lateral nucleus neurons that extend a dendrite into the external capsule. A: Appearance of the dendritic arbors from a rostral viewpoint. B: Appearance of the dendritic arbors from a dorsal viewpoint. C: Appearance of the dendritic arbors from a lateral viewpoint. Cell locations within the lateral nucleus are indicated in the insets. In each instance, the neurons are located at the dorsal end of the nucleus. The color-coding indicates individual dendritic trees. The dendrite that contacts the external capsule is colored red. The red dendrite in cell 2 demonstrates an unusual morphology, curving extensively to occupy nearly 180° of the space around the cell body. The dendritic arbors in each cell appear relatively evenly spaced around the cell body, in contrast to other lateral nucleus dendritic arbors that focus on a subset of the volume around the cell body. Only dendrites and cell bodies are illustrated; axons are not included. Scale bar = 100 μm.
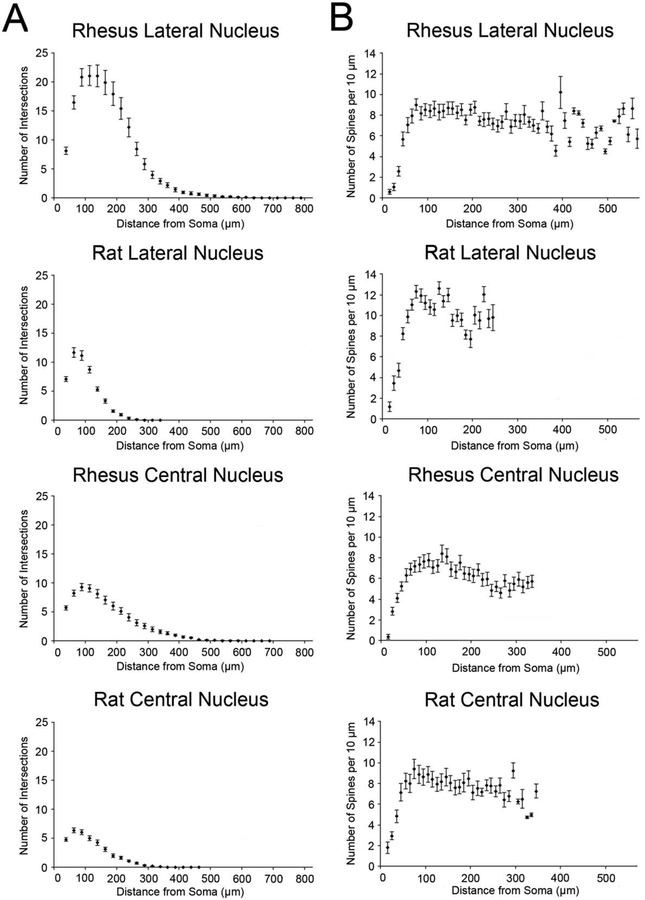
Comparing species, total dendritic length was approximately 2.5-fold greater in the rhesus macaque relative to rat (6,009 μm vs. 2,473 μm; Table 1). The greater dendritic length was accounted for by more dendritic branches (63.9 vs. 33.6 branches; P < 0.001) and greater average branch length (92 μm vs. 54 μm; P < 0.001; Fig. 12). We performed a Sholl analysis to examine dendritic branching at distance intervals from the neuronal soma. In macaque, there was a peak branch density of 21.2 branches at a distance of 100 μm from the soma, whereas, in the rat, there was a peak of 11.8 branches at a distance of 50 μm (Fig. 12). One aspect of dendritic structure that was not different between species was tortuosity (P = 0.84). This is a ratio that describes the deviation from a straight dendritic branch (see Materials and Methods). There was also no significant difference in the number of primary dendrites between species (5.1 in macaque vs. 4.5 in rat; P = 0.31).
TABLE 1.
Quantitative Dendritic Arbor Features in Young Adult Rhesus Macaque and Rat Lateral and Central Amygdala
| Mean | Ratio | |||||||
|---|---|---|---|---|---|---|---|---|
| Rhesus macaque lateral nucleus | Rat lateral nucleus | Rhesus macaque central nucleus | Rat central nucleus | Lateral nucleus macaque/rat | Central nucleus macaque/rat | Macaque lateral/central | Rat lateral/central | |
| Primary dendrite number | 5.1 | 4.5 | 4.2 | 3.7 | 1.14 | 1.14 | 1.21 | 1.22 |
| SD | 1.6 | 1.4 | 1.4 | 1.3 | ||||
| Total branch number | 63.9 | 33.6 | 20.9 | 15.3 | 1.90 | 1.37 | 3.05 | 2.20 |
| SD | 25.2 | 11.6 | 7.6 | 7.4 | ||||
| Average branch length (μm) | 92.6 | 53.9 | 120.4 | 87.8 | 1.72 | 1.37 | 0.77 | 0.61 |
| SD | 23.2 | 9.8 | 32.2 | 27.9 | ||||
| Average dendrite length (μm) | 1,226 | 440 | 622 | 358 | 2.79 | 1.74 | 1.97 | 1.23 |
| SD | 603 | 222 | 267 | 163 | ||||
| Total dendrite length (μm) | 6,009 | 1,786 | 2,473 | 1,232 | 3.36 | 2.01 | 2.43 | 1.45 |
| SD | 2,648 | 658 | 1,037 | 517 | ||||
| Average dendrite diameter (μm) | 1.21 | 1.16 | 1.34 | 1.25 | 1.05 | 1.07 | 0.90 | 0.93 |
| SD | 0.17 | 0.20 | 0.23 | 0.20 | ||||
| Total dendrite volume (μm3) | 8,570 | 2,087 | 4,047 | 1,726 | 4.11 | 2.34 | 2.12 | 1.21 |
| SD | 5,182 | 901 | 1,911 | 1,190 | ||||
| Distance between nearest dendrite terminals (μm) | 72.4 | 46.0 | 112.8 | 83.6 | 1.57 | 1.35 | 0.64 | 0.55 |
| SD | 19.7 | 10.4 | 30.2 | 28.8 | ||||
| Average terminal distance from soma (μm) | 237 | 135 | 242 | 170 | 1.75 | 1.43 | 0.98 | 0.80 |
| SD | 61 | 32 | 58 | 47 | ||||
| Somal volume (μm3) | 3,233 | 1,992 | 1,977 | 1,336 | 1.62 | 1.48 | 1.63 | 1.49 |
| SD | 1,037 | 914 | 888 | 793 | ||||
| Somal roundness (1 = perfectly round) | 0.72 | 0.71 | 0.69 | 0.74 | 1.00 | 0.94 | 1.03 | 0.96 |
| SD | 0.11 | 0.10 | 0.11 | 0.10 | ||||
| Total neuronal volume occupied (μm3) | 11,803 | 4,079 | 6,025 | 3,063 | 2.89 | 1.97 | 1.96 | 1.33 |
| SD | 5,827 | 1,611 | 2,522 | 1,895 | ||||
| Dendrite tortuosity (1 = perfectly straight) | 1.23 | 1.31 | 1.15 | 1.19 | 0.94 | 0.97 | 1.07 | 1.10 |
| SD | 0.12 | 0.45 | 0.06 | 0.11 | ||||
| Average branch angle (degrees) | 46.9 | 50.5 | 48.2 | 49.9 | 0.93 | 0.97 | 0.97 | 1.01 |
| SD | 4.2 | 5.8 | 6.5 | 10.0 | ||||
| Uncorrected spine density (spines per μm) | 0.58 | 0.76 | 0.52 | 0.62 | 0.77 | 0.85 | 1.11 | 1.23 |
| SD | 0.18 | 0.23 | 0.21 | 0.30 | ||||
| Corrected spine density (spines per μm) | 0.72 | 0.97 | 0.65 | 0.80 | 0.74 | 0.81 | 1.11 | 1.21 |
| SD | 0.22 | 0.30 | 0.25 | 0.39 | ||||
| Spine length (μm) | 2.24 | 1.96 | 2.39 | 1.99 | 1.14 | 1.20 | 0.94 | 0.98 |
| SD | 0.60 | 0.76 | 0.55 | 0.50 | ||||
| Proportion of “mature” dendrites | 0.78 | 0.77 | 0.77 | 0.81 | 1.01 | 0.95 | 1.01 | 0.95 |
| SD | 0.09 | 0.18 | 0.09 | 0.13 | ||||
SD, standard deviation.
Figure 12.
A: Sholl plots of the number of dendritic branches at intervals of 25 μm from the soma. B: Sholl plots of the corrected number of spines per 10 μm of dendritic arbor at intervals of 10 μm from the soma. For all cell types, spine density is low in the first several intervals, which predominantly contain primary dendrites. After a peak in spine density, a small decline is evident with increasing distance from the cell body that appears to be consistent across species and nuclei.
Spine density was 22% lower on macaque lateral nucleus neurons relative to those of the rat (0.56 spines/μm vs. 0.75 spines/μm; P = 0.001). In both species, Sholl analysis revealed peaks in spine density at an intermediate distance from the neuronal soma, with a slight decline at greater distances (Fig. 12). Spine density was lower in macaque than in rat on both proximal and distal dendrites (Fig. 12). In macaque, the peak spine density was 9.0 spines/10 μm dendrite at a distance of 60–70 μm (Fig. 12). In rat, the peak density was 12.6 spines/10 μm dendrite at a distance of 110–120 μm (Fig. 12). There was no significant difference between species in either average spine length (P = 0.29) or the proportion of spines demonstrating a “mature” morphology (P = 0.70). “Mature” morphology spines were defined as spines with stubby, mushroom, branching, and detached morphologies.
Neuronal somal volume was larger by 62% in rhesus macaque relative to rat (3,230 μm3 vs. 1,990 μm3; P = 0.001). Somal volume was significantly correlated with dendritic length (P < 0.001), branch number (P < 0.001), average dendritic diameter (P < 0.001), and total dendritic volume (P < 0.001).
Central nucleus principal neurons in the rhesus macaque and rat
In the rhesus macaque, central nucleus principal neuron dendritic arbors consistently demonstrated limited branching at both primary and secondary levels (Figs. 13, 14). Compared with the lateral nucleus, the dendrites were relatively straighter, and there was little clustering of their terminations. These features were also observed in the rat, which was distinguished by having even less dendritic branching (Figs. 15, 16). Central nucleus principal neuron dendrites extended farther from the soma in macaque than in rat (Fig. 17). However, the difference was less pronounced than in the lateral nucleus. In both species, some of the central nucleus neurons extended a single long, straight dendrite into the medial nucleus (Figs. 18, 19). Other than this feature, the dendrites did not display any consistent orientation relative to the boundary of the nucleus (Figs. 18–20).
Figure 13.
A: High-magnification composite, two-dimensional photomicrograph of the dendritic arbor of a rhesus macaque central nucleus principal neuron. Dendritic branching is far more limited than in the rhesus lateral nucleus neurons, but the longest dendrites extend a comparable distance from the soma. The dendrites also appear relatively straighter, although some sharp deviations are still observed. B: High-magnification image of a secondary dendrite showing spine features. The spines are large, less dense than in both rhesus lateral nucleus and rat central nucleus, and frequently mushroom shaped (arrowheads indicate exemplars). C: Example of an infrequent large mushroom-shaped spine (arrowhead) measuring several micrometers in length from a rhesus macaque central nucleus neuron. The surrounding dendritic area is relatively spine sparse, but smaller mushroom-shaped spines are visible. Scale bars = 50 μm in A; 10 μm in C (applies to B,C).
Figure 14.
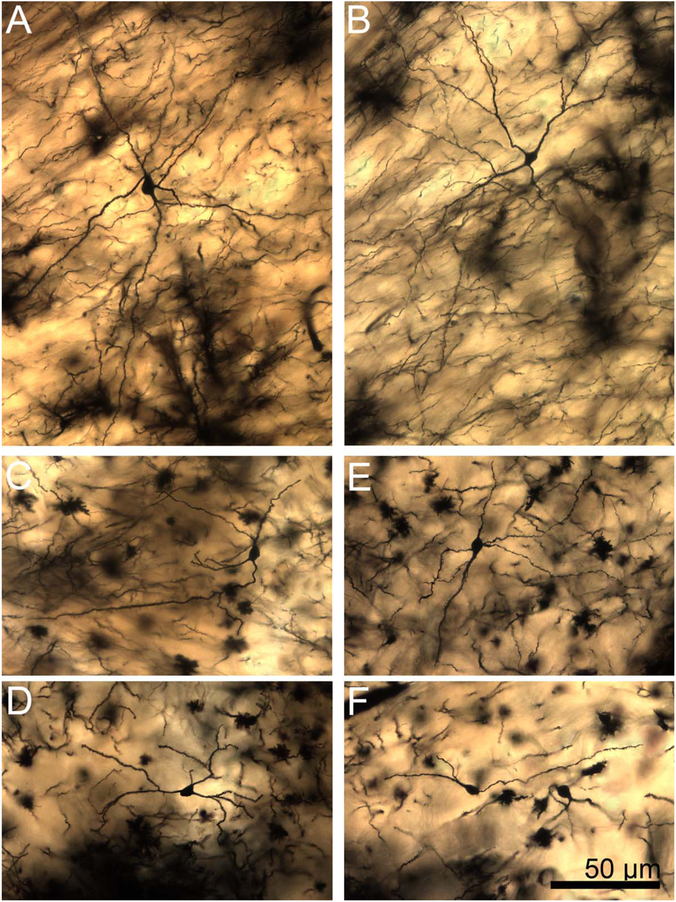
A–D: Two-dimensional composite photomicrographs of the dendritic arbors of four rhesus macaque central nucleus principal neurons. Dendritic branching is limited, but several dendrites extend long distances from the soma. The dendrites also appear relatively straighter than lateral nucleus neurons, especially in examples B,D. Scale bar = 100 μm.
Figure 15.
High-magnification composite, two-dimensional photomicrograph of the dendritic arbor of a rat central nucleus principal neuron. Only a single branching dendrite is present, and all dendrites are relatively straight, with a few notable local deviations. Inset: High-magnification image of a secondary dendrite showing spine features. The spines are small to medium-sized, densely packed, and frequently mushroom shaped (arrowheads indicate exemplars). Scale bars = 50 μm; 10 μm in inset.
Figure 16.
A–D: Two-dimensional, composite photomicrographs of the dendritic arbors of four rat central nucleus principal neurons. Dendritic branching is far more limited than in rat lateral nucleus neurons, but the longest dendrites extend a nearly comparable distance from the soma. Scale bar = 100 μm.
Figure 17.
Two-dimensional composite photomicrographs of the dendritic arbors of rhesus (A,B) and rat (C–F) central nucleus principal neurons at an equivalent scale. Several of the longest macaque dendrites extend farther than the longest rat dendrites. However, the arbors are closer in size than in lateral nucleus neurons. Scale bar = 50 μm.
Figure 18.
Three-dimensional reconstructions showing principal neuron dendritic arbor structure in the rhesus macaque medial central nucleus. A: Appearance of the dendritic arbors from a rostral viewpoint. B: Appearance of the dendritic arbors from a dorsal viewpoint. C: Appearance of the dendritic arbors from a lateral viewpoint. The color coding indicates individual dendritic trees. The arbors are less tortuous relative to comparable cells in the lateral nucleus and have much more limited branching, and the dendritic terminations do not cluster. Cell locations are indicated in the center inset. The green dendritic tree in cell 2 is an example of a long dendrite extending into the medial nucleus. Only dendrites and the cell body are illustrated; axons are not included. Scale bar = 100 μm.
Figure 19.
Three-dimensional reconstructions showing principal neuron dendritic arbor structure in the rat medial central nucleus. A: Appearance of the dendritic arbors from a rostral viewpoint. B: Appearance of the dendritic arbors from a dorsal viewpoint. C: Appearance of the dendritic arbors from a lateral viewpoint. The color coding indicates individual dendritic trees. Cell locations are indicated in the center inset. The red dendrite in cell 2 is an example of a long dendrite extending into the medial nucleus. Only dendrites and the cell body are illustrated; axons are not included. Scale bar = 100 μm.
Figure 20.
Three-dimensional reconstructions showing principal neuron dendritic arbor structure in rhesus macaque and rat central nucleus from a rostral viewpoint at equivalent scale. The color coding indicates individual dendrites. The arbors extend farther from the soma in macaque than in rat. However, there is less difference in size between the species than in the lateral nucleus. Cell locations are indicated in the insets. Only dendrites and cell bodies are illustrated; axons are not included. Scale bar = 100 μm.
The primary branches of the dendritic arbors in these neurons had sparse spines, often with a “stubby” morphology, or no spines at all. On secondary and tertiary branches, spine density was moderate to high, and spines frequently had a “mushroom” morphology (Figs. 13, 15). Approximately 90% of central nucleus neurons had occasional mushroom-shaped spines with a stalk several micrometers in length (Fig. 13). These spines were typically on distal dendrites and were often surrounded by relatively spine-sparse segments.
Compared with the lateral nucleus, principal neurons in the medial division of the central nucleus had dendrites with few branches (20.9 branches vs. 63.9 in the macaque; P < 0.001). Individual dendritic branches, however, were significantly longer in the central nucleus (120 μm vs. 92 μm, P < 0.001). As a result, the average three-dimensional distance from the soma at which dendrites terminated was equivalent in macaque central and lateral nuclei (242 μm vs. 237 μm; Figs. 3, 13). The dendrites of medial central nucleus neurons were less tortuous than lateral nucleus dendrites in the rhesus macaque (− 7%, P = 0.002) but not in the rat (see, e.g., Fig. 14B,D).
Comparing species, the dendritic arbors in the principal neurons of the medial division of the central nucleus were approximately 50% longer in rhesus macaques than in rats (1,786 μm vs. 1,232 μm; P < 0.001; Figs. 17, 20). The number of branches was 37% greater (20.9 vs. 15.3 branches; P = 0.001), and the average length of branches was also 37% greater (120 μm vs. 88 μm; P < 0.001). Sholl analysis revealed a peak dendritic branch density of 9.3 branches at a distance of 75 μm from the soma in macaque (Fig. 12). In rat, there was a peak of 6.4 branches at a distance of 50 μm (Fig. 12).
Neuronal somal volume was larger by 48% in macaques relative to rats (1,980 μm3 vs. 1,340 μm3; P < 0.001; Table 1). As in the lateral nucleus, there were no significant species differences in dendritic features such as tortuosity (P = 0.18) or primary dendrite number (P = 0.31). Average spine length was increased (+20%; P = 0.01) in the macaque, but spine density was similar in both species (Fig. 12). In macaque, Sholl analysis revealed a peak spine density of 8.4 spines/10 μm dendrite at a distance of 120–130 μm (Fig. 12). In rat, the highest density was 9.5 spines/10 μm dendrite at a distance of 110–120 μm (Fig. 12).
DISCUSSION
Principal neuron dendritic arbors are larger in the rhesus macaque compared with the rat in both the lateral nucleus and the medial division of the central nucleus of the amygdala. This enlargement is more pronounced in the lateral nucleus than in the central nucleus. Although dendritic arbor size differences do not fully account for evolutionary volumetric changes between nuclei, the alterations that we observe parallel the changes in volume in these structures. The brain, and neocortex specifically, have expanded nearly 1,000 times in size during the course of mammalian evolution from basal insectivores, such as the tree shrew, to humans (Stephan and Andy, 1977; Stephan et al., 1981). By comparison, the amygdala has expanded approximately 300-fold between insectivores and humans. In our experimental species, the rhesus macaque brain is about 50 times larger than the rodent brain, whereas the amygdala has expanded by 20-fold (Chareyron et al., 2011; Stephan and Andy, 1977; Stephan et al., 1981, 1987). Within the amygdala, the lateral and basal nuclei are enlarged 35-fold between the rat and the rhesus macaque (Chareyron et al., 2011), which is much greater than the roughly eightfold enlargement observed in the central nucleus (Chareyron et al., 2011).
What drives the differential enlargement of these nuclei? Does it reflect factors specific to the evolutionary groups of these species or just greater scaling of the basal and lateral nuclei with total brain volume? We tested this question via regression analysis of prior volumetric data from a wide range of rodents, nonprimate insectivores, and primates (Stephan et al., 1981, 1987). The increasing share of the amygdala occupied by the basolateral nuclei is a consistent feature across primates (P < 0.001) rather than scaling primarily with brain size (P = 0.15). In fact, the smallest primate brains had proportionally larger basolateral nuclei than even the largest insectivore brains. Thus, the differential enlargement of the amygdala appears to be a function of phylogenetic differences between experimental species rather than simply a linear scaling with increased brain volume.
The phylogenetic differences in the volume of the lateral and central nuclei are paralleled by differences in cell number. The lateral nucleus shows an increase of 13-fold in neuron number between rat and rhesus macaque (Chareyron et al., 2011). In the central nucleus, however, there is only a 2.3-fold increase in neuron number (Chareyron et al., 2011). These increases in neuron number are smaller proportionally than the increases in nuclear volume between species. In other words, neuronal density is reduced in the rhesus macaque lateral and central nuclei relative to the rat (Chareyron et al., 2011).
We studied dendritic arbors in the lateral and central nuclei to determine whether there are phylogenetic differences in their structure. The total length of the dendritic tree of principal neurons in the macaque lateral nucleus was about 6,000 μm, compared with about 2,500 μm in the rat, a 2.5-fold increase. The total dendritic length of neurons in the medial division of the central nucleus showed less extensive phylogenetic changes. A typical dendritic tree in the rat central nucleus was about 1,800 μm in the macaque and about 1,200 μm in the rat, a difference of approximately 50%.
What changes led to the greater dendritic lengths in the principal neurons of the macaque amygdala? For the lateral nucleus, we observed a 70% increase in the average branch length and a 90% increase in the number of dendritic branches between rat and rhesus macaque. These values are consistent with previous Sholl analyses of dendrite branch number in these species (Herzog, 1982; Rai et al., 2005; Rao et al., 2009). For the central nucleus, we observed increases of 40% in both the number of branches and the average branch length.
The fact that increases in dendritic branch number and length were observed in both nuclei raises a question: how consistent are these alterations across the macaque brain relative to the rat? For the entorhinal cortex, we reported increases of 40–100% in branch number and 40–90% in total dendritic length in rhesus macaque relative to rat (Buckmaster et al., 2004). The precise size of these increases varied with cortical layer. For the CA1 field of the hippocampus, we observed only a 10% increase in average branch number between rhesus macaque and rat (Altemus et al., 2005; Ishizuka et al., 1995). However, there was an increase of 50% in the total length of the dendritic arbors (Altemus et al., 2005; Ishizuka et al., 1995). These findings raise the possibility that dendritic arbor size and branch number may be increased between rat and macaque in an idiosyncratic fashion across many regions of the brain.
Alongside the changes in dendritic arbor structure, spine density in the rhesus macaque lateral nucleus was 20% lower than in the rat. Compared with nearby cortical regions, the spine densities that we observed in the macaque amygdala were slightly lower than those reported for layer III pyramidal neurons in inferior temporal area TEO (Elston and Rosa, 1998) and much lower than the densities reported for areas TE and STP (Elston et al., 1999). Our reported spine densities are also far lower than those reported for prefrontal cortex (Elston et al., 2005) but are slightly higher than those reported in neurons for primary visual and auditory cortex (Elston et al., 2005, b; Elston and Rosa, 1998). We also observed that spines were 20% longer, on average, in the central nucleus of the macaque vs. the rat. However, the relative proportions of spines showing mature morphologies did not differ between the two species in either nucleus.
To determine the total number of inputs received by each neuron, we multiplied the average spine density by total dendritic length. This approach estimates that there are 4,300 spines on the average lateral nucleus principal neuron in the rhesus macaque. This is more than double the estimated 1,700 spines on the average rat lateral nucleus neuron. In the central nucleus, by contrast, there are about 1,600 spines on the average rhesus macaque neuron compared with 1,000 spines in the rat, an increase of 60%. How do these changes affect the total number of spines across the lateral and central nuclei? By multiplying these values by prior estimates of neuron number (Chareyron et al., 2011), we find that total spines in the lateral nucleus increase approximately 35-fold between rat and rhesus macaque (2.0 × 10⁸ spines vs. 6.9 × 10⁹ spines, respectively). This increase is roughly proportional to the volumetric increase between species in the lateral nucleus (Chareyron et al., 2011). Turning to the central nucleus, our approach estimates a roughly threefold increase in total spine numbers between species (1.27 × 10⁸ vs. 4.75 × 10⁸; Chareyron et al., 2011). This is actually much lower than the volumetric increase between species in this nucleus (Chareyron et al., 2011).
Despite the increases in total dendritic length in rhesus macaque amygdala, other qualitative dendritic features were consistent across species. In the lateral nucleus, these included highly branched dendrites, aspiny primary dendritic branches, and large somal volumes relative to the central nucleus. These observations are consistent with “type I” or “spiny projection” neuron features previously reported for the lateral nucleus in a wide array of species, from opossum to human (Braak and Braak, 1983; Hall, 1972; Herzog, 1982; Kamal and Tombol, 1975; McDonald, 1982b, 1984; McDonald and Culberson, 1981; Millhouse and DeOlmos, 1983; Rowniak et al., 2003; Tombol and Szafranska-Kosmal, 1972; Washburn and Moises, 1992). We also observed that the terminations of dendrites were more closely clustered in the lateral nucleus than in the central nucleus. In other words, many primary dendrites in these cells focus their branches on a physically constrained region of the lateral nucleus. Because the lateral nucleus receives sensory input that is topographically organized (Pitkanen et al., 1995, 1998; Stefanacci and Amaral, 2000, 2002; Turner and Herkenham, 1981), the organization of dendrites would tend to maintain the unimodal processing of sensory information. Clearly, we did not observe lateral nucleus neurons that had dendrites extending throughout the full dorsoventral extent of the nucleus.
There were also consistent differences in dendritic structure in the lateral nucleus neurons that extended a dendrite into the external capsule. A few of the dendrites of these neurons branched extensively and circled the soma in a highly tortuous fashion. The dendrites that extended away from the soma were much more evenly distributed around the cell than in other lateral nucleus neurons. Now that this morphologically distinct population has been identified, it will be interesting to investigate whether it exhibits differences in connectivity and electrophysiological function.
For the medial division of the central nucleus, we also observed several dendritic features that were consistent across species. These included a lower number of branches, longer branches, and straighter branches than in the lateral nucleus. These observations are consistent with prior observations of principal neuron morphology in the medial division of the central nucleus of rat and cat (Hall, 1972; Kamal and Tombol, 1975; McDonald, 1982a; Tombol and Szafranska-Kosmal, 1972). Thus, despite dendritic enlargement between rhesus macaque and rat, some elements of dendritic structure appear to be relatively conserved. For some of the central nucleus dendritic arbors, we observed single dendrites that extended into the medial nucleus. Therefore, connections directed to the medial nucleus may influence central nucleus function more than was previously appreciated. We also infrequently observed exceptionally long mushroom-shaped spines on the dendritic arbors of some of these neurons. It is unclear whether these spines constitute a population that is functionally distinct from the short mushroom-shaped spines that are far more frequent in these cells.
The amygdala undergoes substantial enlargement over the course of mammalian evolution. Many studies of amygdala function employ either the rat or the rhesus macaque as experimental models. Thus, it would be valuable to determine the extent to which neuronal features differ between these species. We observed enlargement in rhesus macaque dendritic arbors relative to rat as a result of increased branch number and branch length. This enlargement was greater in the lateral nucleus than in the central nucleus. What features of macaque brain structure and behavior might have driven this evolutionary change? One major factor may be phylogenetic changes in the number of cortical inputs received by the lateral nucleus. In the macaque, the lateral nucleus receives major inputs from the thalamus and higher-order unimodal sensory regions such as TE, TEO, superior temporal gyrus, temporal polar cortex, and posterior regions of the insular cortex (Aggleton et al., 1980; Amaral et al., 1992; Stefanacci and Amaral, 2000, 2002; Webster et al., 1991). It also receives inputs from polysensory association cortices such as the orbitofrontal cortex, medial prefrontal cortex, cingulate cortex, and insular cortex (for review see Freese and Amaral, 2009). These regions of the brain are all disproportionately enlarged in macaques relative to rodents (Stephan et al., 1981; Super and Uylings, 2001). The rat lateral nucleus, by contrast, receives a much more significant portion of inputs from secondary unimodal sensory regions such as SII (McDonald, 1998). It still receives many inputs from the rodent analogues of the regions that project to the lateral nucleus in macaque, but these regions are greatly reduced in size. Thus, the lateral nucleus in the macaque likely receives far more inputs, particularly from the greatly expanded neocortex, than in the rat. The expansion of dendritic trees on the neurons of the macaque lateral nucleus thus likely reflects the greater integrative role that these neurons must play with the far greater cortical input that is available to them. The lateral nucleus also demonstrates delayed synaptogenesis relative to the central nucleus (Humphrey, 1968; Ulfig et al., 2003). Delayed development has been associated with greater evolutionary volumetric expansion in other brain regions, such as the thalamus (Finlay et al., 2001).
In the medial division of the central nucleus, by contrast, the bulk of the incoming projections are from the basal, accessory basal, and lateral central nuclei (Cassell et al., 1999; Fudge and Tucker, 2009; Pare et al., 1995). These structures show less phylogenetic enlargement than the cortical regions that provide much of the input to the lateral nucleus (Chareyron et al., 2011; Stephan and Andy, 1977; Stephan et al., 1987). As a result, the principal neurons in the medial division of the central nucleus have less of an increase in the number of inputs to accommodate. Additionally, the primary role of the medial division of the central nucleus is as an effector that activates visceral and autonomic regions of the hypothalamus and brainstem (LeDoux et al., 1988; Price, 1986; Price and Amaral, 1981; Veening et al., 1984). Although there is obviously some integrative activity within the central nucleus, it functions more as a trigger than as an evaluative region. Understanding the organization of dendritic processes in the primate amygdala is a first step in determining how the amygdala processes complex information in order to carry out its protective function. These data may also prove valuable in evaluating potential morphological alterations that lead to involvement of the amygdala in numerous psychiatric disorders.
ACKNOWLEDGMENTS
We thank Jeff Bennett for his numerous contributions, including tissue acquisition and assistance with tissue processing. We thank Ana-Maria Iosif for statistical advice during preparation of the manuscript.
Funding Acknowledgments: This work was supported by National Institutes of Health grants R01 MH41479 and F32 MH088275.
Footnotes
CONFLICT OF INTEREST STATEMENT
The authors have no conflicts of interest.
LITERATURE CITED
- Adolphs R 2003. Cognitive neuroscience of human social behaviour. Nat Rev Neurosci 4:165–178. [DOI] [PubMed] [Google Scholar]
- Aggleton JP, Burton MJ, Passingham RE. 1980. Cortical and subcortical afferents to the amygdala of the rhesus monkey (Macaca mulatta). Brain Res 190:347–368. [DOI] [PubMed] [Google Scholar]
- Altemus KL, Lavenex P, Ishizuka N, Amaral DG. 2005. Morphological characteristics and electrophysiological properties of CA1 pyramidal neurons in macaque monkeys. Neuroscience 136:741–756. [DOI] [PubMed] [Google Scholar]
- Amaral DG. 2003. The amygdala, social behavior, and danger detection. Ann N Y Acad Sci 1000:337–347. [DOI] [PubMed] [Google Scholar]
- Amaral DG, Price JL, Pitkanen A, Carmichael ST. 1992. Anatomical organization of the primate amygdaloid complex In: Aggleton JP, editor. The amygdala: neurobiological aspects of emotion, memory, and mental dysfunction. New York: John Wiley & Sons; p 1–66. [Google Scholar]
- Ambroggi F, Ishikawa A, Fields HL, Nicola SM. 2008. Basolateral amygdala neurons facilitate reward-seeking behavior by exciting nucleus accumbens neurons. Neuron 59: 648–661. [DOI] [PMC free article] [PubMed] [Google Scholar]
- Balleine BW, Killcross S. 2006. Parallel incentive processing: an integrated view of amygdala function. Trends Neurosci 29:272–279. [DOI] [PubMed] [Google Scholar]
- Braak H, Braak E. 1983. Neuronal types in the basolateral amygdaloid nuclei of man. Brain Res Bull 11:349–365. [DOI] [PubMed] [Google Scholar]
- Buckmaster PS, Alonso A, Canfield DR, Amaral DG. 2004. Dendritic morphology, local circuitry, and intrinsic electrophysiology of principal neurons in the entorhinal cortex of macaque monkeys. J Comp Neurol 470:317–329. [DOI] [PubMed] [Google Scholar]
- Cassell MD, Freedman LJ, Shi C. 1999. The intrinsic organization of the central extended amygdala. Ann N Y Acad Sci 877:217–241. [DOI] [PubMed] [Google Scholar]
- Chareyron LJ, Banta Lavenex P, Amaral DG, Lavenex P. 2011. Stereological analysis of the rat and monkey amygdala. J Comp Neurol 519:3218–3239. [DOI] [PMC free article] [PubMed] [Google Scholar]
- Dall’Oglio A, Ferme D, Brusco J, Moreira JE, Rasia-Filho AA. 2010. The “single-section” Golgi method adapted for formalin-fixed human brain and light microscopy. J Neurosci Methods 189:51–55. [DOI] [PubMed] [Google Scholar]
- Davis M, Shi C. 2000. The amygdala. Curr Biol 10:R131. [DOI] [PubMed] [Google Scholar]
- Elston GN, Rosa MG. 1998. Morphological variation of layer III pyramidal neurones in the occipitotemporal pathway of the macaque monkey visual cortex. Cereb Cortex 8:278–294. [DOI] [PubMed] [Google Scholar]
- Elston GN, Tweedale R, Rosa MG. 1999. Cortical integration in the visual system of the macaque monkey: large-scale morphological differences in the pyramidal neurons in the occipital, parietal and temporal lobes. Proc Biol Sci 266:1367–1374. [DOI] [PMC free article] [PubMed] [Google Scholar]
- Elston GN, Benavides-Piccione R, Defelipe J. 2005. A study of pyramidal cell structure in the cingulate cortex of the macaque monkey with comparative notes on inferotemporal and primary visual cortex. Cereb Cortex 15:64–73. [DOI] [PubMed] [Google Scholar]
- Elston GN, Oga T, Okamoto T, Fujita I. 2010a. Spinogenesis and pruning from early visual onset to adulthood: an intracellular injection study of layer III pyramidal cells in the ventral visual cortical pathway of the macaque monkey. Cereb Cortex 20:1398–1408. [DOI] [PubMed] [Google Scholar]
- Elston GN, Okamoto T, Oga T, Dornan D, Fujita I. 2010b. Spinogenesis and pruning in the primary auditory cortex of the macaque monkey (Macaca fascicularis): an intracellular injection study of layer III pyramidal cells. Brain Res 1316:35–42. [DOI] [PubMed] [Google Scholar]
- Finlay BL, Darlington RB, Nicastro N. 2001. Developmental structure in brain evolution. Behav Brain Sci 24:263–278; discussion 278–308. [PubMed] [Google Scholar]
- Freese J, Amaral DG. 2009. Neuroanatomy of the primate amygdala In: Whalen PJ, Phelps EA, editors. The human amygdala. New York: The Guilford Press. [Google Scholar]
- Fudge JL, Tucker T. 2009. Amygdala projections to central amygdaloid nucleus subdivisions and transition zones in the primate. Neuroscience 159:819–841. [DOI] [PMC free article] [PubMed] [Google Scholar]
- Hall E 1972. The amygdala of the cat: a Golgi study. Z Zellforsch Mikrosk Anat 134:439–458. [DOI] [PubMed] [Google Scholar]
- Herzog AG. 1982. The relationship of dendritic branching complexity to ontogeny and cortical connectivity in the pyramidal cells of the monkey amygdala: a Golgi study. Brain Res 256:73–77. [DOI] [PubMed] [Google Scholar]
- Humphrey T 1968. The development of the human amygdala during early embryonic life. J Comp Neurol 132:135–165. [DOI] [PubMed] [Google Scholar]
- Ishizuka N, Cowan WM, Amaral DG. 1995. A quantitative analysis of the dendritic organization of pyramidal cells in the rat hippocampus. J Comp Neurol 362:17–45. [DOI] [PubMed] [Google Scholar]
- Jabes A, Lavenex PB, Amaral DG, Lavenex P. 2010. Quantitative analysis of postnatal neurogenesis and neuron number in the macaque monkey dentate gyrus. Eur J Neurosci 31:273–285. [DOI] [PMC free article] [PubMed] [Google Scholar]
- Kamal AM, Tombol T. 1975. Golgi studies on the amygdaloid nuclei of the cat. J Hirnforsch 16:175–201. [PubMed] [Google Scholar]
- Lavenex P, Suzuki WA, Amaral DG. 2002. Perirhinal and parahippocampal cortices of the macaque monkey: projections to the neocortex. J Comp Neurol 447:394–420. [DOI] [PubMed] [Google Scholar]
- Lavenex P, Suzuki WA, Amaral DG. 2004. Perirhinal and parahippocampal cortices of the macaque monkey: intrinsic projections and interconnections. J Comp Neurol 472: 371–394. [DOI] [PubMed] [Google Scholar]
- Lavenex PB, Amaral DG, Lavenex P. 2006. Hippocampal lesion prevents spatial relational learning in adult macaque monkeys. J Neurosci 26:4546–4558. [DOI] [PMC free article] [PubMed] [Google Scholar]
- LeDoux J 1998. Fear and the brain: where have we been, and where are we going? Biol Psychiatry 44:1229–1238. [DOI] [PubMed] [Google Scholar]
- LeDoux JE, Iwata J, Cicchetti P, Reis DJ. 1988. Different projections of the central amygdaloid nucleus mediate autonomic and behavioral correlates of conditioned fear. J Neurosci 8:2517–2529. [DOI] [PMC free article] [PubMed] [Google Scholar]
- LeDoux JE, Cicchetti P, Xagoraris A, Romanski LM. 1990. The lateral amygdaloid nucleus: sensory interface of the amygdala in fear conditioning. J Neurosci 10:1062–1069. [DOI] [PMC free article] [PubMed] [Google Scholar]
- McDonald AJ. 1982a. Cytoarchitecture of the central amygdaloid nucleus of the rat. J Comp Neurol 208:401–418. [DOI] [PubMed] [Google Scholar]
- McDonald AJ. 1982b. Neurons of the lateral and basolateral amygdaloid nuclei: a Golgi study in the rat. J Comp Neurol 212:293–312. [DOI] [PubMed] [Google Scholar]
- McDonald AJ. 1984. Neuronal organization of the lateral and basolateral amygdaloid nuclei in the rat. J Comp Neurol 222:589–606. [DOI] [PubMed] [Google Scholar]
- McDonald AJ. 1998. Cortical pathways to the mammalian amygdala. Prog Neurobiol 55:257–332. [DOI] [PubMed] [Google Scholar]
- McDonald AJ, Culberson JL. 1981. Neurons of the basolateral amygdala: a Golgi study in the opossum (Didelphis virginiana). Am J Anat 162:327–342. [DOI] [PubMed] [Google Scholar]
- Millhouse OE, DeOlmos J. 1983. Neuronal configurations in lateral and basolateral amygdala. Neuroscience 10:1269–1300. [DOI] [PubMed] [Google Scholar]
- Pare D, Smith Y, Pare JF. 1995. Intra-amygdaloid projections of the basolateral and basomedial nuclei in the cat: Phaseolus vulgaris-leucoagglutinin anterograde tracing at the light and electron microscopic level. Neuroscience 69:567–583. [DOI] [PubMed] [Google Scholar]
- Peters A, Kaiserman-Abramof IR. 1970. The small pyramidal neuron of the rat cerebral cortex. The perikaryon, dendrites and spines. Am J Anat 127:321–355. [DOI] [PubMed] [Google Scholar]
- Pezawas L, Meyer-Lindenberg A, Drabant EM, Verchinski BA, Munoz KE, Kolachana BS, Egan MF, Mattay VS, Hariri AR, Weinberger DR. 2005. 5-HTTLPR polymorphism impacts human cingulate-amygdala interactions: a genetic susceptibility mechanism for depression. Nat Neurosci 8:828–834. [DOI] [PubMed] [Google Scholar]
- Pitkanen A, Amaral DG. 1991. Demonstration of projections from the lateral nucleus to the basal nucleus of the amygdala: a PHA-L study in the monkey. Exp Brain Res 83:465–470. [DOI] [PubMed] [Google Scholar]
- Pitkanen A, Stefanacci L, Farb CR, Go GG, LeDoux JE, Amaral DG. 1995. Intrinsic connections of the rat amygdaloid complex: projections originating in the lateral nucleus. J Comp Neurol 356:288–310. [DOI] [PubMed] [Google Scholar]
- Pitkanen A, Savander V, LeDoux JE. 1997. Organization of intra-amygdaloid circuitries in the rat: an emerging framework for understanding functions of the amygdala. Trends Neurosci 20:517–523. [DOI] [PubMed] [Google Scholar]
- Pitkanen A, Tuunanen J, Kalviainen R, Partanen K, Salmenpera T. 1998. Amygdala damage in experimental and human temporal lobe epilepsy. Epilepsy Res 32:233–253. [DOI] [PubMed] [Google Scholar]
- Pitkanen A, Pikkarainen M, Nurminen N, Ylinen A. 2000. Reciprocal connections between the amygdala and the hippocampal formation, perirhinal cortex, and postrhinal cortex in rat. A review. Ann N Y Acad Sci 911:369–391. [DOI] [PubMed] [Google Scholar]
- Price JL. 1986. Subcortical projections from the amygdaloid complex. Adv Exp Med Biol 203:19–33. [DOI] [PubMed] [Google Scholar]
- Price JL, Amaral DG. 1981. An autoradiographic study of the projections of the central nucleus of the monkey amygdala. J Neurosci 1:1242–1259. [DOI] [PMC free article] [PubMed] [Google Scholar]
- Price JL, Russchen FT, Amaral DG. 1987. The limbic region. II: The amygdaloid complex In: Bjorklund A, Hokfelt T, Swanson LW, editors. Handbook of chemical neuroanatomy, vol 5: integrated systems of the CNS, part I. Amsterdam: Elsevier; p 279–388. [Google Scholar]
- Rai KS, Murthy KD, Rao MS, Karanth KS. 2005. Altered dendritic arborization of amygdala neurons in young adult rats orally intubated with Clitorea ternatea aqueous root extract. Phytother Res 19:592–598. [DOI] [PubMed] [Google Scholar]
- Rao KGM, Rao SM, Rao SG. 2009. Enhancement of amygdaloid neuronal dendritic arborization by fresh leaf juice of Centella asiatica (Linn) during growth spurt period in rats. Evid-Based Compl Alt 6:203–210. [DOI] [PMC free article] [PubMed] [Google Scholar]
- Rauch SL, Shin LM, Wright CI. 2003. Neuroimaging studies of amygdala function in anxiety disorders. Ann N Y Acad Sci 985:389–410. [DOI] [PubMed] [Google Scholar]
- Rizvi TA, Ennis M, Behbehani MM, Shipley MT. 1991. Connections between the central nucleus of the amygdala and the midbrain periaqueductal gray: topography and reciprocity. J Comp Neurol 303:121–131. [DOI] [PubMed] [Google Scholar]
- Roozendaal B, McEwen BS, Chattarji S. 2009. Stress, memory and the amygdala. Nat Rev Neurosci 10:423–433. [DOI] [PubMed] [Google Scholar]
- Rowniak M, Szteyn S, Robak A. 2003. A comparative study of the mammalian amygdala: a Golgi study of the basolateral amygdala. Fol Morphol 62:331–339. [PubMed] [Google Scholar]
- Sah P, Lopez De Armentia M. 2003. Excitatory synaptic transmission in the lateral and central amygdala. Ann N Y Acad Sci 985:67–77. [DOI] [PubMed] [Google Scholar]
- Schiess MC, Callahan PM, Zheng H. 1999. Characterization of the electrophysiological and morphological properties of rat central amygdala neurons in vitro. J Neurosci Res 58:663–673. [PubMed] [Google Scholar]
- Schumann CM, Hamstra J, Goodlin-Jones BL, Lotspeich LJ, Kwon H, Buonocore MH, Lammers CR, Reiss AL, Amaral DG. 2004. The amygdala is enlarged in children but not adolescents with autism; the hippocampus is enlarged at all ages. J Neurosci 24:6392–6401. [DOI] [PMC free article] [PubMed] [Google Scholar]
- Shabel SJ, Janak PH. 2009. Substantial similarity in amygdala neuronal activity during conditioned appetitive and aversive emotional arousal. Proc Natl Acad Sci U S A 106: 15031–15036. [DOI] [PMC free article] [PubMed] [Google Scholar]
- Shenton ME, Dickey CC, Frumin M, McCarley RW. 2001. A review of MRI findings in schizophrenia. Schizophr Res 49:1–52. [DOI] [PMC free article] [PubMed] [Google Scholar]
- Spitzer JJ. 1982. A fast and efficient algorithm for the estimation of parameters in models with the Box-and-Cox transformation. J Am Statist Assoc 77:760–766. [Google Scholar]
- Stefanacci L, Amaral DG. 2000. Topographic organization of cortical inputs to the lateral nucleus of the macaque monkey amygdala: a retrograde tracing study. J Comp Neurol 421:52–79. [DOI] [PubMed] [Google Scholar]
- Stefanacci L, Amaral DG. 2002. Some observations on cortical inputs to the macaque monkey amygdala: an anterograde tracing study. J Comp Neurol 451:301–323. [DOI] [PubMed] [Google Scholar]
- Stefanacci L, Farb CR, Pitkanen A, Go G, LeDoux JE, Amaral DG. 1992. Projections from the lateral nucleus to the basal nucleus of the amygdala: a light and electron microscopic PHA-L study in the rat. J Comp Neurol 323: 586–601. [DOI] [PubMed] [Google Scholar]
- Stephan H, Andy OJ. 1977. Quantitative comparison of the amygdala in insectivores and primates. Acta Anat 98: 130–153. [DOI] [PubMed] [Google Scholar]
- Stephan H, Frahm H, Baron G. 1981. New and revised data on volumes of brain structures in insectivores and primates. Fol Primatol 35:1–29. [DOI] [PubMed] [Google Scholar]
- Stephan H, Frahm HD, Baron G. 1987. Comparison of brain structure volumes in Insectivora and primates. VII. Amygdaloid components. J Hirnforsch 28:571–584. [PubMed] [Google Scholar]
- Stirling RV, Bliss TV. 1978. Observations on the commissural projection to the dentate gyrus in the Reeler mutant mouse. Brain Res 150:447–465. [DOI] [PubMed] [Google Scholar]
- Super H, Uylings HB. 2001. The early differentiation of the neocortex: a hypothesis on neocortical evolution. Cereb Cortex 11:1101–1109. [DOI] [PubMed] [Google Scholar]
- Tombol T, Szafranska-Kosmal A. 1972. A golgi study of the amygdaloid complex in the cat. Acta Neurobiol Exp 32: 835–848. [PubMed] [Google Scholar]
- Turner B, Herkenham M. 1981. An autoradiographic study of thalamo-amygdaloid connections in the rat. Anat Rec 199:A260–A260. [Google Scholar]
- Ulfig N, Setzer M, Bohl J. 2003. Ontogeny of the human amygdala. Ann N Y Acad Sci 985:22–33. [DOI] [PubMed] [Google Scholar]
- Veening JG, Swanson LW, Sawchenko PE. 1984. The organization of projections from the central nucleus of the amygdala to brainstem sites involved in central autonomic regulation: a combined retrograde transport-immunohistochemical study. Brain Res 303:337–357. [DOI] [PubMed] [Google Scholar]
- Washburn MS, Moises HC. 1992. Electrophysiological and morphological properties of rat basolateral amygdaloid neurons in vitro. J Neurosci 12:4066–4079. [DOI] [PMC free article] [PubMed] [Google Scholar]
- Webster MJ, Ungerleider LG, Bachevalier J. 1991. Connections of inferior temporal areas TE and TEO with medial temporal-lobe structures in infant and adult monkeys. J Neurosci 11:1095–1116. [DOI] [PMC free article] [PubMed] [Google Scholar]
- Zilles K, Armstrong E, Schleicher A, Kretschmann H-J. 1988. The human pattern of gyrification in the cerebral cortex. Anat Embryol 179:173–179. [DOI] [PubMed] [Google Scholar]


