Abstract
Background:
Little is known about short- and long-term pain and functional activity after surgery for pelvic organ prolapse.
Objective:
To describe postoperative pain and functional activity after transvaginal native tissue reconstructive surgery with apical suspension and retropubic synthetic midurethral sling and to compare these outcomes between patients receiving two common transvaginal prolapse repairs, uterosacral ligament and sacrospinous ligament vaginal vault suspension.
Study Design:
This planned secondary analysis of a 2×2 factorial randomized trial included 374 women randomized to receive uterosacral (n=188) or sacrospinous (n=186) vaginal vault suspension to treat both Stages 2–4 apical vaginal prolapse and stress urinary incontinence between 2008 and 2013 at 9 medical centers. Participants were also randomized to receive perioperative pelvic muscle therapy or usual care. All patients received transvaginal native tissue repairs and a midurethral sling. Participants completed the Surgical Pain Scales (0–10 numeric rating scales; higher scores = greater pain) and Activity Assessment Scale (0–100; higher score = higher activity) prior to surgery and at 2 weeks, 4–6 weeks, and 3 months postoperatively. The SF-36 was completed at baseline, 6, 12 and 24 months after surgery; the Bodily Pain, Physical Functioning and Role-Physical subscales were used for this analysis (higher scores = less disability). Self-reported pain medication use was also collected.
Results:
Before surgery, average pain at rest and during normal activity were (adjusted mean ± standard error) 2.24 ± 0.23 and 2.76 ± 0.25; both increased slightly from baseline at 2 weeks (+0.65, p<0.001 and +0.74, p=0.007 respectively) then decreased below baseline at 3 months (−0.87 and −1.14 respectively, p<0.001), with no differences between surgical groups. Pain during exercise/strenuous activity and worst pain decreased below baseline levels at 4–6 weeks (−1.26, p=0.014 and −0.95, p=0.002) and 3 months (−1.97 and −1.50, p<0.001) without differences between surgical groups. Functional activity as measured by the Activity Assessment Scale improved from baseline at 4–6 weeks (+9.24, p<0.001) and 3 months (+13.79, p<0.001). SF-36 Bodily Pain, Physical Functioning, and Role-Physical Scales demonstrated significant improvements from baseline at 6, 12 and 24 months (24 months: +5.62, +5.79, and +4.72 respectively, p<0.001 for each) with no differences between groups. Use of narcotic pain medications was reported by 14.3% of participants prior to surgery, 53.7% at 2 and 26.1% at 4–6 weeks post-operatively; thereafter, use was similar to baseline rates until 24 months when it decreased to 6.8%. Use of non-narcotic pain medication was reported by 48.1% of participants prior to surgery, 68.7% at 2 weeks and similar to baseline at 3 months; thereafter use dropped steadily to 26.6% at 2 years. Uterosacral ligament suspension resulted in less new or worsening buttock pain than sacrospinous suspension at 4–6 weeks postoperatively (4.6% vs. 10.5%, p=0.043) but no difference in groin or thigh pain.
Conclusion:
Pain and functional activity improve for up to 2 years after native tissue reconstructive surgery with uterosacral or sacrospinous vaginal vault suspension and midurethral sling for stage 2–4 pelvic organ prolapse. On average, immediate postoperative pain is low and improves to below baseline levels by 4–6 weeks.
This trial is registered at (clinicaltrials.gov under Registration # NCT00597935
Keywords: functional activity, pelvic floor disorders, pelvic organ prolapse, postoperative pain, sacrospinous ligament fixation, stress urinary incontinence, uterosacral ligament suspension, vaginal reconstructive surgery
Introduction
In recent years, there has been increasing emphasis on enhancing recovery after surgery, with goals of improving patient post-operative experience and return of function. Pelvic floor disorders are common conditions for which one in five women in the United States will undergo surgery by age 80.1 With over 300,000 surgical procedures for pelvic organ prolapse performed each year, urogynecological patient outcomes are of unique interest in women’s healthcare.2 However, little is known about postoperative pain or activity for these procedures.
While surgery for pelvic organ prolapse can be performed using multiple approaches including robotic, laparoscopic and vaginal approaches with and without mesh augmentation, 80–90% are performed transvaginally without mesh (i.e., transvaginal native tissue repair).2–5 The two most common native tissue procedures for correcting apical prolapse are the sacrospinous ligament fixation (SSLF) and the uterosacral ligament suspension (ULS).6 Post-operative pain, namely gluteal and posterior thigh pain, is well described for women undergoing SSLF, and generally resolves within 6 weeks for the majority of patients.7,8 Post-operative neuropathic pain has also been described for patients undergoing ULS; however, these reports are primarily focused on pain as an immediate post-operative complication but not on outcomes potentially related to the pain, such as return to activity, pain medication use, and functional status.9,10 Beyond these reported adverse events, there are few data available on the short- and long-term pain and functional activity after surgery for pelvic organ prolapse, limiting the ability of clinicians to fully counsel their patients.
The objective of this planned secondary analysis is to describe postoperative pain and functional activity after transvaginal native tissue reconstructive surgery with apical suspension and to compare these outcomes between patients randomized to receive ULS or SSLF.
Materials and Methods
This is a planned analysis of secondary outcomes of the Operations and Pelvic Muscle Training in the Management of Apical Support Loss (OPTIMAL) trial, a multicenter clinical trial conducted by the Eunice Kennedy Shriver National Institute for Childhood Health and Human Development (NICHD) Pelvic Floor Disorders Network at 9 clinical sites. Details of this study have been previously published.8,11 Briefly, the OPTIMAL trial was 2×2 factorial designed trial comparing two native tissue vaginal prolapse apical suspensions (ULS vs. SSLF) with midurethral sling surgery in women with ≥ stage 2 uterine or vaginal prolapse and stress urinary incontinence and perioperative behavioral therapy with pelvic floor muscle training (PMT) vs. usual perioperative care. The study had 2 primary aims: 1) to compare surgical outcomes of SSLF to ULS 24 months after vaginal surgery for apical or uterine prolapse and stress incontinence and 2) to evaluate the impact of a perioperative behavioral-pelvic muscle therapy program on urinary and prolapse outcomes. Each clinical site’s institutional review board approved the study and all participants completed a research informed consent process. Each enrolled patient first underwent a 1:1 perioperative behavioral and pelvic muscle therapy vs. usual care randomization followed by a second 1:1 surgical randomization. All participants received a transvaginal native-tissue (non-mesh) pelvic organ prolapse repair and a synthetic mesh retropubic midurethral sling (tension-free vaginal tape, Ethicon). Participants randomized to PMT received an individualized program that included one visit 2–4 weeks prior to surgery, and four post-operative visits (2, 4–6, 8, and 12 weeks after surgery). Each participant received a standardized postoperative instruction sheet encouraging them to resume light activities including stretching, walking, climbing stairs, cooking, clerical work as soon as they felt comfortable with the activity while asking them to refrain from activities that caused a feeling of pressure in the pelvic or vaginal area, including heavy lifting or vigorous exercise for 6 weeks after surgery.
Participants were masked to surgical treatment assignment and underwent standardized evaluations by masked assessors at baseline, 2- and 4–6 weeks, 3-, 6-, 12- and 24-months including administration of validated patient-reported outcome measures. The Surgical Pain Scales (SPS) and Activity Assessment Scale (AAS) were administered at baseline, 2 weeks, 4–6 weeks and 3 months after surgery.12,13 The SPS were designed for use in the perioperative period and assess pain at rest, pain during normal activities, pain during strenuous activities/exercise and pain unpleasantness/worst pain using 4 numerical rating scales (0–10) with higher scores indicating worse pain.13 The AAS is a measure of functional activity also designed for use in the perioperative period.12 The AAS includes 13 items covering a broad sample of sedentary, movement-related, and graded-intensity physical activities. Respondents were asked to rate the degree of difficulty performing each of these activities in the previous 24 hours on a 5-point scale from “no difficulty” to “not able to do it.” A “did not perform for other reasons” response item is also included but not scored. The AAS has 3 subscales: sedentary activities, ambulatory activities, and work/exercise activities. The AAS total and subscale scores are transformed to produce a range of zero to 100, with higher values indicating greater functional activity.
Subjects completed the SF-36 at baseline, 6, 12, 24 months after surgery.14 For this analysis, we assessed the SF-36 Bodily Pain, Physical Functioning, and Role Limitations-Physical subscales. Each subscale is scored 0–100 with higher scores indicating better health and is norm-based so that 50 is the population mean and 10 is the population standard-deviation. Patients also self-reported medication use at baseline and each follow-up visit. For this analysis, pain medication was classified into two groups: narcotic and non-narcotic (i.e. nonsteroidal anti-inflammatory drugs and acetaminophen). Other medications that may modify pain response such as gabapentin, benzodiazepines or steroids were not included in this classification. At 2 and 4–6 weeks post-surgery, participants were asked if they developed any new or worsening pain in the leg/thigh, buttock or groin since surgery including severity (mild, moderate or severe) and need for additional narcotic pain medications or other therapies.
Statistical analyses were conducted on a modified intent to treat (mITT) population that included all participants that were randomized to both the PMT and surgical interventions, and for whom the outcome was assessed. Baseline SPS, AAS and subscales, and SF-36 scores were compared between surgical treatment groups using general linear models, and postoperative changes from baseline were compared between groups using general linear mixed models. All models controlled for PMT treatment assignment, interaction between surgery and PMT, concomitant hysterectomy, age at randomization, race, ethnicity, insurance status, and study visit; interactions between surgical and PMT assignments and visit were included in the general linear mixed models. The correlation between repeated measures on the same participant was modeled using a compound symmetry covariance structure. Because the surgical randomization was stratified by surgeon, surgeon was evaluated as a random effect and retained in the model if statistically significant at an alpha level of 0.05. If the interaction between surgical and PMT groups was statistically significant at an alpha level of 0.05, the surgical groups were compared within each PMT group. Use of narcotic and non-narcotic pain medications were modeled using comparable generalized linear mixed models with a logit link. New or worsening pain, moderate or severe pain, pain requiring narcotic pain medications, and pain requiring other treatment were compared between surgical groups using Fisher’s exact tests and unadjusted odds ratios (ORs) and 95% confidence intervals (CIs).
Results
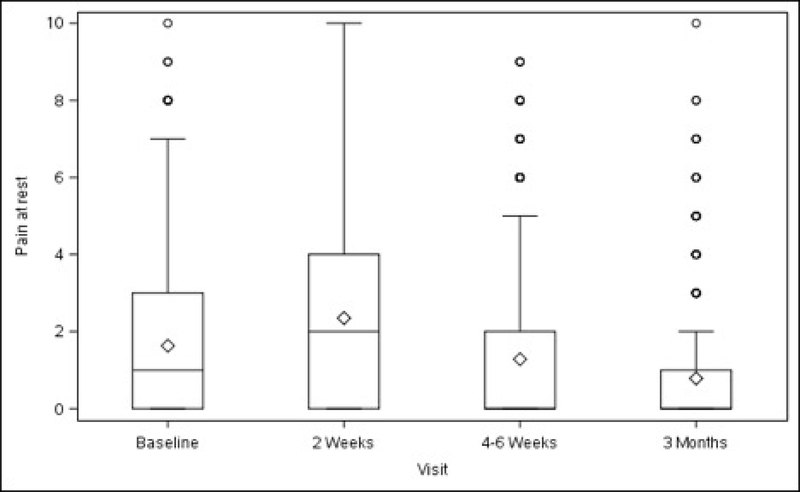
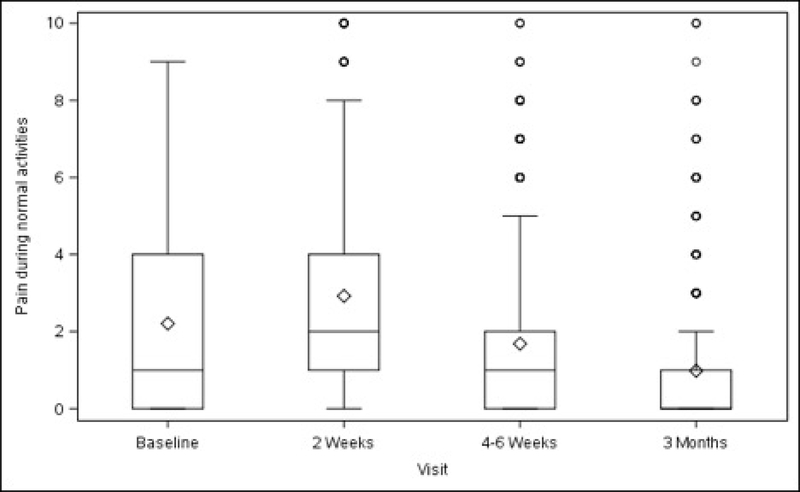
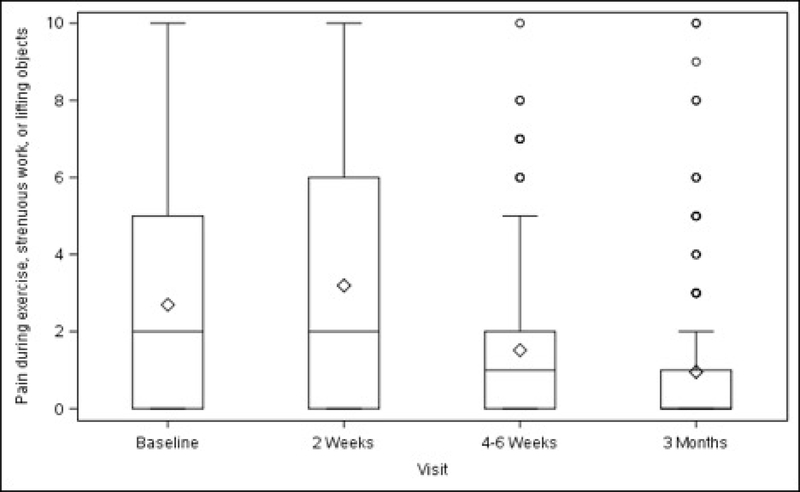
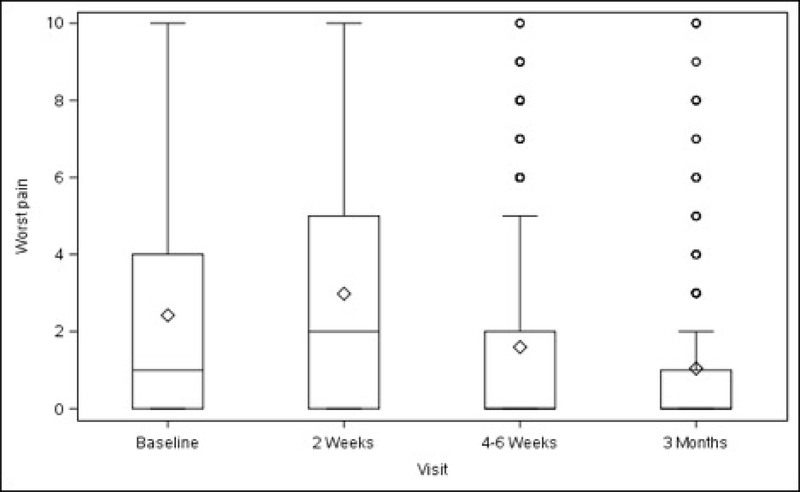
Overall, average pain scores (adjusted mean ± standard error) at rest and during normal activity before surgery were 2.24 ± 0.23 (minimum to maximum 0–10) and 2.76 ± 0.25 (minimum to maximum 0–9), respectively (Table 1, Figure 1). Compared with baseline values, both scores increased slightly at 2 weeks after surgery (rest, +0.65, p<0.001; normal activity, +0.74, p=0.007) then decreased below baseline at 3 months (rest, −0.87, p<0.001; normal activity, −1.14, p<0.001). Pain experienced during exercise/strenuous activity (performed post-operatively by a minority of participants – see Table 1) decreased below baseline levels at 4–6 weeks after surgery (−1.26, p=0.014), with this reduction persisting at 3 months (−1.97, p<0.001). “Worst pain” also decreased from baseline at 4–6 weeks (−0.95, p=0.002) and at 3 months (−1.50, p<0.001). The change in pain scores for each activity and time point spanned values of –10 to +10 (data not shown).
Table 1.
Surgical Pain Scales from Baseline to 3 Months After Surgery Modeling Outcome as Change from Baseline 1
| All Surgical Treatments (N=371) | ULS Surgical Treatment (N=185) | SSLF Surgical Treatment (N=186) | Surgical Treatment Difference | ||||||
|---|---|---|---|---|---|---|---|---|---|
| Variable | Time Frame | Adjusted Mean (SE, N) | Adjusted P-value 2 | Adjusted Mean (SE, N) | Adjusted P-value 2 | Adjusted Mean (SE, N) | Adjusted P-value 2 | Adjusted Mean Difference (95% CI) 3 | Adjusted P-value 3 |
| Pain at Rest 4 | |||||||||
| Baseline | 2.24 (0.23, 369) | -- | 2.20 (0.25, 184) | -- | 2.28 (0.26, 185) | -- | −0.08 (−0.53, 0.36) | 0.711 | |
| 2 week change | 0.65 (0.23, 354) | 0.004 | 0.57 (0.26, 177) | 0.027 | 0.72 (0.26, 177) | 0.006 | −0.15 (−0.65, 0.35) | 0.551 | |
| 4–6 week change | −0.41 (0.23, 362) | 0.068 | −0.53 (0.26, 181) | 0.039 | −0.29 (0.26, 181) | 0.259 | −0.24 (−0.73, 0.26) | 0.347 | |
| 3 month change | −0.87 (0.23, 340) | <0.001 | −0.93 (0.26, 168) | <0.001 | −0.81 (0.26, 172) | 0.002 | −0.12 (−0.63, 0.39) | 0.644 | |
| Pain during Normal Activities 5 | |||||||||
| Baseline | 2.76 (0.25, 368) | -- | 2.66 (0.28, 183) | -- | 2.86 (0.28, 185) | -- | −0.20 (−0.69, 0.30) | 0.435 | |
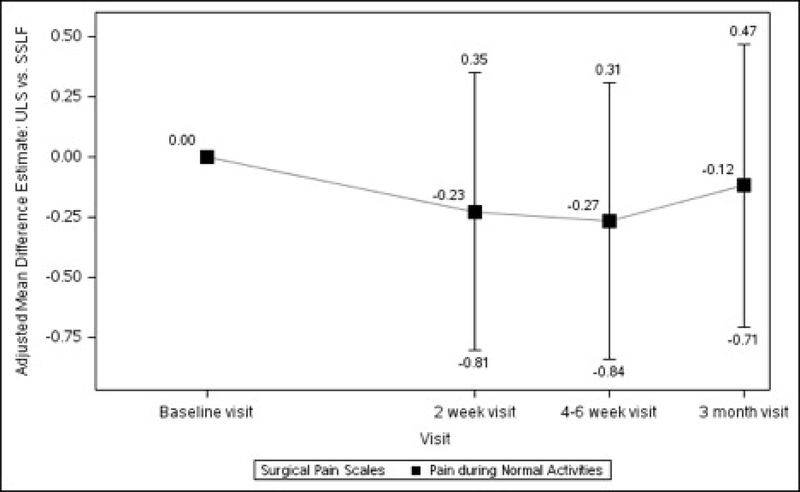
| 2 week change | 0.74 (0.27, 353) | 0.007 | 0.63 (0.31, 176) | 0.042 | 0.85 (0.31, 177) | 0.006 | −0.23 (−0.81, 0.35) | 0.440 | |
| 4–6 week change | −0.46 (0.27, 362) | 0.087 | −0.60 (0.31, 180) | 0.052 | −0.33 (0.31, 182) | 0.287 | −0.27 (−0.84, 0.31) | 0.362 | |
| 3 month change | −1.14 (0.27, 338) | <0.001 | −1.20 (0.31, 167) | <0.001 | −1.08 (0.31, 171) | 0.001 | −0.12 (−0.71, 0.47) | 0.686 | |
| Pain during Exercise, Strenuous Activities | |||||||||
| Baseline | 3.71 (0.42, 211) | -- | 3.66 (0.47, 94) | -- | 3.76 (0.45, 117) | -- | −0.10 (−0.87, 0.67) | 0.794 | |
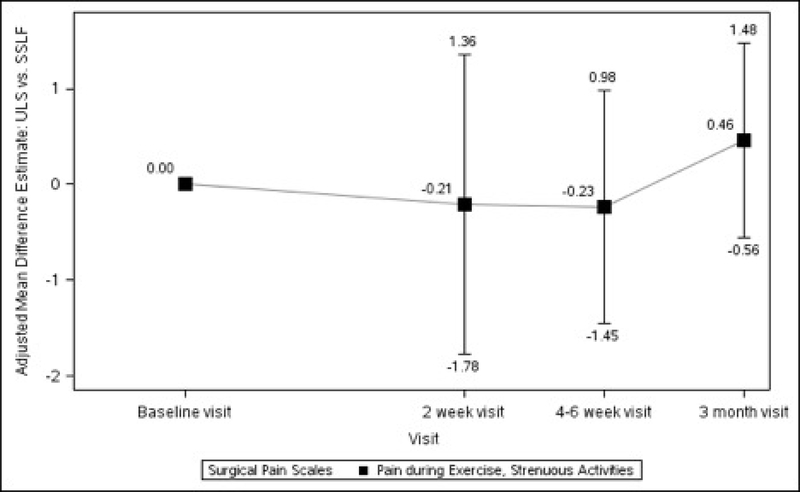
| 2 week change | −0.36 (0.57, 42) | 0.527 | −0.47 (0.74, 17) | 0.527 | −0.26 (0.65, 25) | 0.693 | −0.21 (−1.78, 1.36) | 0.793 | |
| 4–6 week change | −1.26 (0.51, 83) | 0.014 | −1.38 (0.62, 35) | 0.028 | −1.14 (0.56, 48) | 0.043 | −0.23 (−1.45, 0.98) | 0.703 | |
| 3 month change | −1.97 (0.48, 132) | <0.001 | −1.74 (0.55, 60) | 0.002 | −2.20 (0.54, 72) | <0.001 | 0.46 (−0.56, 1.48) | 0.376 | |
| Worst Pain 6 | |||||||||
| Baseline | 2.98 (0.29, 368) | -- | 2.91 (0.32, 183) | -- | 3.05 (0.32, 185) | -- | −0.14 (−0.70, 0.42) | 0.620 | |
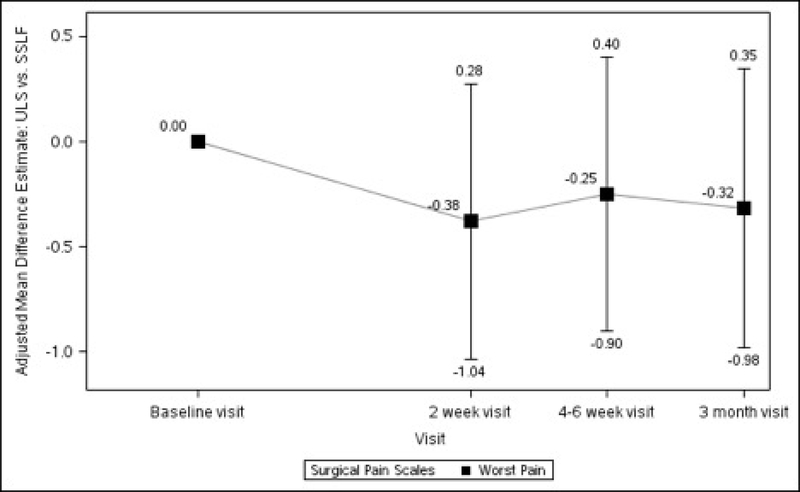
| 2 week change | 0.42 (0.30, 350) | 0.168 | 0.23 (0.34, 175) | 0.506 | 0.61 (0.35, 175) | 0.082 | −0.38 (−1.04, 0.28) | 0.256 | |
| 4–6 week change | −0.95 (0.30, 361) | 0.002 | −1.08 (0.34, 179) | 0.002 | −0.83 (0.35, 182) | 0.017 | −0.25 (−0.90, 0.40) | 0.449 | |
| 3 month change | −1.50 (0.30, 338) | <0.001 | −1.66 (0.35, 166) | <0.001 | −1.35 (0.35, 172) | <0.001 | −0.32 (−0.98, 0.35) | 0.350 | |
The analyses for each outcome of interest were performed on the modified intent to treat population (mITT) which includes all participants that were eligible, gave consent, were randomized to both the PMT and surgical interventions, and for whom the outcome was assessed (i.e. non-missing). For analyses assessing each outcome’s change from baseline to a follow-up visit, all adjusted means, mean differences, standard errors, 95% confidence intervals, and p-values for outcomes were obtained from general linear models adjusting for randomized surgical intervention, randomized PMT intervention, visit, interaction between visit and randomized surgical intervention, interaction between visit and randomized PMT intervention, and three-way interaction between visit and randomized surgical intervention and randomized PMT intervention, concomitant hysterectomy, age at surgical randomization, race (white, black, other), ethnicity, public insurance, and private insurance while controlling for a random surgeon effect (if found statistically significant) and repeated subject visits. All tests were conducted at a significance level of 0.05.
This adjusted p-value corresponds to the test assessing if there was a statistically significant change from baseline.
This adjusted p-value corresponds to the test assessing if there was a statistically significant difference in the outcome between the two surgical treatments.
The effect of surgery varies across the PMT groups and across visits (p=0.006). See table 2 for the effect of randomized surgical intervention within the PMT and non-PMT groups.
The effect of surgery varies across the PMT groups and across visits (p=0.001). See table 2 for the effect of randomized surgical intervention within the PMT and non-PMT groups.
The effect of surgery varies across the PMT groups and across visits (p=0.001). See table 2 for the effect of randomized surgical intervention within the PMT and non-PMT groups.
Figures 1A–1D. Surgical Pain Scales from Baseline to 3 Months After Surgery (Unadjusted).
Figure 1A. Pain at Rest
Figure 1B. Pain during Normal Activities
Figure 1C. Pain during exercise, strenuous work, or lifting objects
Figure 1D. Worst Pain
Baseline pain scores were similar between patients who received ULS and those who underwent SSLF: at rest (2.20 ± 0.25 vs 2.28 ± 0.26, p=0.711) and with normal activity (2.66 ± 0.28 vs 2.86 ± 0.28, p=0.435). There were no statistically significant differences between the 2 surgical groups in changes in pain scores at rest, with normal activity, during exercise/strenuous activity, or for worst pain experienced at 2 weeks, 4–6 weeks or 3 months after surgery (Table 1, Figure 2).
Figures 2A–2D. Difference in Surgical Pain Scale scores between surgical interventions, from Baseline to 3 Months After Surgery, Modeling Outcome as Change from Baseline1.
Figure 2A. Pain at Rest Difference between Surgical Interventions across Visits
Figure 2B. Pain during Normal Activities Difference between Surgical Interventions across Visits
Figure 2C. Pain during Exercise, Strenuous Activities Difference between Surgical Interventions across Visits
Figure 2D. Worst Pain Difference between Surgical Interventions across Visits
1The analyses for each outcome of interest were performed on the modified intent to treat population (mITT) which includes all participants that were eligible, gave consent, were randomized to both the PMT and surgical interventions, and for whom the outcome was assessed (i.e. non-missing). For analyses assessing each outcome’s change from baseline to a follow-up visit, all adjusted means, mean differences, standard errors, 95% confidence intervals, and p-values for outcomes were obtained from general linear models adjusting for randomized surgical intervention, randomized PMT intervention, visit, interaction between visit and randomized surgical intervention, interaction between visit and randomized PMT intervention, and three-way interaction between visit and randomized surgical intervention and randomized PMT intervention, concomitant hysterectomy, age at surgical randomization, race (white, black, other), ethnicity, public insurance, and private insurance while controlling for a random surgeon effect (if found statistically significant) and repeated subject visits. All tests were conducted at a significance level of 0.05.
In the PMT group, pain at rest demonstrated a statistically significant improvement at 3 months in the ULS but not the SSLF group (Table 2). Improvement in pain during normal activities and worst pain was also noted at 3 months after surgery for both surgeries, with greater improvements in the ULS group compared to SSLF (Table 2). Among patients randomized to usual postoperative care (non-PMT), pain at rest, pain during normal activities, and worst pain improved at 3 months with greater improvements in the SSLF group for pain at rest (Table 2).
Table 2.
Surgical Pain Scales from Baseline to 3 Months After Surgery in PMT and non-PMT groups Modeling Outcome as Change from Baseline 1
| PMT GROUP | NON-PMT GROUP | ||||||||||||
|---|---|---|---|---|---|---|---|---|---|---|---|---|---|
| ULS Surgical Treatment (N=90) | SSLF Surgical Treatment (N=95) | Surgical Treatment Difference | ULS Surgical Treatment (N=95) | SSLF Surgical Treatment (N=91) | Surgical Treatment Difference | ||||||||
| Variable | Time Frame | Adjusted Mean (SE, N) | Adjusted P-value 2 | Adjusted Mean (SE, N)) | Adjusted P-value 2 | Adjusted Mean Difference (95% CI) 3 | Adjusted P-value 3 | Adjusted Mean (SE, N) | Adjusted P-value 2 | Adjusted Mean (SE, N) | Adjusted P-value 2 | Adjusted Mean Difference (95% CI) 3 | Adjusted P-value 3 |
| Pain at Rest | |||||||||||||
| Baseline | 2.12 (0.30, 90) | -- | 2.60 (0.30, 95) | -- | −0.48 (−1.11, 0.14) | 0.129 | 2.28 (0.30, 94) | -- | 1.96 (0.31, 90) | -- | 0.32 (−0.31, 0.95) | 0.322 | |
| 2 week change | 0.46 (0.31, 86) | 0.142 | 0.52 (0.31, 90) | 0.099 | −0.06 (−0.76, 0.65) | 0.872 | 0.68 (0.32, 91) | 0.032 | 0.93 (0.32, 87) | 0.004 | −0.25 (−0.95, 0.46) | 0.496 | |
| 4–6 week change | −0.63 (0.31, 89) | 0.043 | −0.76 (0.31, 93) | 0.015 | 0.12 (−0.57, 0.82) | 0.726 | −0.43 (0.32, 92) | 0.174 | 0.17 (0.32, 88) | 0.597 | −0.60 (−1.31, 0.10) | 0.095 | |
| 3 month change | −0.60 (0.32, 83) | 0.057 | −1.37 (0.31, 87) | <0.001 | 0.77 (0.05, 1.48) | 0.036 | −1.26 (0.32, 85) | <0.001 | −0.26 (0.32, 85) | 0.423 | −1.00 (−1.72, −0.29) | 0.006 | |
| Pain during Normal Activities | |||||||||||||
| Baseline | 2.55 (0.33, 90) | -- | 2.99 (0.33, 95) | -- | −0.44 (−1.14, 0.25) | 0.208 | 2.78 (0.34, 93) | -- | 2.72 (0.34, 90) | -- | 0.05 (−0.65, 0.75) | 0.880 | |
| 2 week change | 0.48 (0.37, 86) | 0.192 | 0.78 (0.37, 90) | 0.035 | −0.30 (−1.12, 0.52) | 0.472 | 0.77 (0.38, 90) | 0.041 | 0.93 (0.38, 87) | 0.015 | −0.16 (−0.98, 0.67) | 0.710 | |
| 4–6 week change | −0.59 (0.37, 89) | 0.110 | −0.60 (0.37, 94) | 0.101 | 0.01 (−0.80, 0.83) | 0.972 | −0.61 (0.38, 91) | 0.107 | −0.06 (0.38, 88) | 0.878 | −0.55 (−1.37, 0.27) | 0.189 | |
| 3 month change | −0.74 (0.37, 83) | 0.046 | −1.52 (0.37, 87) | <0.001 | 0.77 (−0.06, 1.60) | 0.067 | −1.65 (0.38, 84) | <0.001 | −0.64 (0.38, 84) | 0.096 | −1.01 (−1.85, −0.18) | 0.017 | |
| Worst Pain | |||||||||||||
| Baseline | 2.72 (0.37, 90) | -- | 3.14 (0.37, 95) | -- | −0.42 (−1.20, 0.37) | 0.296 | 3.09 (0.38, 93) | -- | 2.96 (0.39, 90) | -- | 0.14 (−0.66, 0.93) | 0.735 | |
| 2 week change | 0.13 (0.41, 85) | 0.755 | 0.63 (0.42, 89) | 0.132 | −0.50 (−1.43, 0.43) | 0.294 | 0.33 (0.42, 90) | 0.438 | 0.59 (0.43, 86) | 0.167 | −0.26 (−1.19, 0.67) | 0.579 | |
| 4–6 week change | −0.88 (0.41, 89) | 0.034 | −1.25 (0.41, 94) | 0.003 | 0.37 (−0.55, 1.29) | 0.430 | −1.28 (0.42, 90) | 0.003 | −0.41 (0.42, 88) | 0.338 | −0.87 (−1.80, 0.06) | 0.066 | |
| 3 month change | −1.05 (0.42, 82) | 0.013 | −1.72 (0.42, 87) | <0.001 | 0.67 (−0.27, 1.60) | 0.162 | −2.27 (0.43, 84) | <0.001 | −0.97 (0.43, 85) | 0.024 | −1.30 (−2.24, −0.36) | 0.007 | |
The analyses for each outcome of interest were performed on the modified intent to treat population (mITT) which includes all participants that were eligible, gave consent, were randomized to both the PMT and surgical interventions, and for whom the outcome was assessed (i.e. non-missing). For analyses assessing each outcome’s change from baseline to a follow-up visit, all adjusted means, mean differences, standard errors, 95% confidence intervals, and p-values for outcomes were obtained from general linear models adjusting for randomized surgical intervention, randomized PMT intervention, visit, interaction between visit and randomized surgical intervention, interaction between visit and randomized PMT intervention, and three-way interaction between visit and randomized surgical intervention and randomized PMT intervention, concomitant hysterectomy, age at surgical randomization, race (white, black, other), ethnicity, public insurance, and private insurance while controlling for a random surgeon effect (if found statistically significant) and repeated subject visits. All tests were conducted at a significance level of 0.05.
This adjusted p-value corresponds to the test assessing if there was a statistically significant change from baseline.
This adjusted p-value corresponds to the test assessing if there was a statistically significant difference in the outcome between the two surgical treatments.
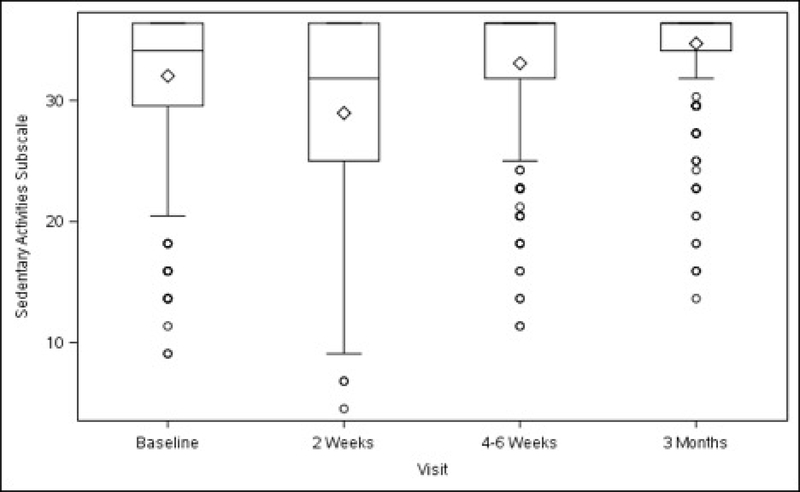
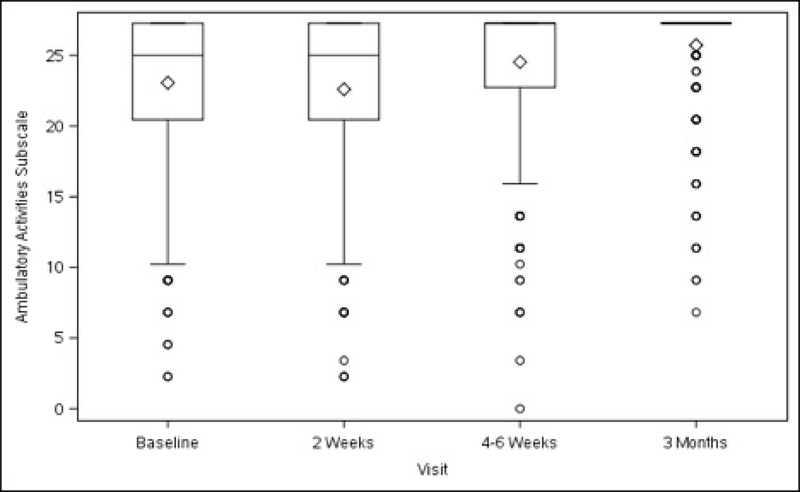
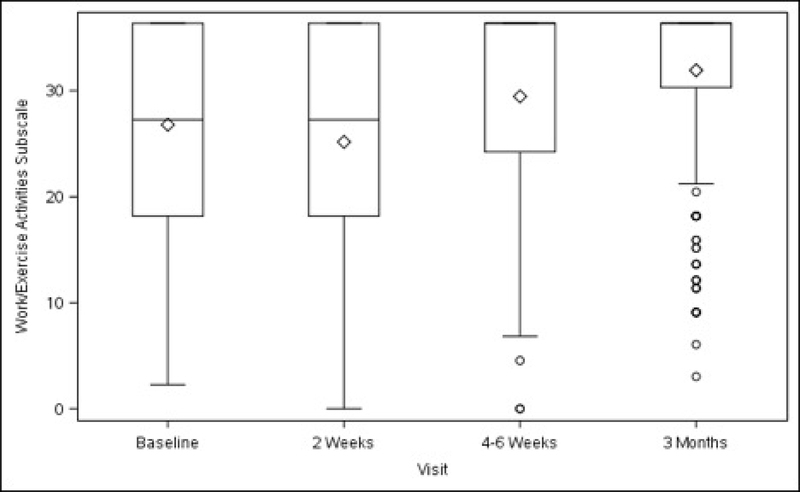
Functional activity, as measured by the overall scores on the AAS, improved in the total study population at 4–6 weeks (+9.24 ± 1.92, p<0.001), and further improved at 3 months (+13.79 ± 1.94, p<0.001) after surgery, compared with baseline. (Table 3) Compared with pre-surgery levels, there was a transient decrease in sedentary activity at 2 weeks. Scores increased at 4–6 weeks (+2.27 ± 0.70, p=0.001) and at 3 months (+3.68 ± 0.71, p<0.001). Scores for the two remaining subscales (ambulatory and work/exercise) also improved at 4–6 weeks (+2.49 ± 0.62, p<0.001; +4.64 ± 1.09, p<0.001, respectively) and at 3 months (+3.65 ± 0.63, p<0.001; +7.11 ± 1.10, p<0.001, respectively) (Table 3).
Table 3.
Activity Assessment Scale Changes from Baseline to 3 Months After Surgery Modeling Outcome as Change from Baseline1
| All Surgical Treatments (N=373) | ULS Surgical Treatment (N=187) | SSLF Surgical Treatment (N=186) | Surgical Treatment Difference | |||||||
|---|---|---|---|---|---|---|---|---|---|---|
| Variable | Time Frame | Statistic | Estimate | Adjusted P-value 2 | Estimate | Adjusted P-value 2 | Estimate | Adjusted P-value 2 | Adjusted Mean Difference (95% CI) 3 | Adjusted P-value 3 |
| Overall AAS Score 4 | ||||||||||
| Baseline | Adjusted Mean (SE, N) | 78.03 (1.80, 370) | -- | 78.10 (1.99, 185) | -- | 77.96 (2.00, 185) | -- | 0.15 (−3.26, 3.56) | 0.931 | |
| Baseline | Min to Max | 25 to 100 | 25 to 100 | 25 to 100 | ||||||
| 2 week change | Adjusted Mean (SE, N) | −0.30 (1.93, 344) | 0.878 | 2.48 (2.19, 170) | 0.258 | −3.07 (2.20, 174) | 0.163 | 5.55 (1.47, 9.63) | 0.008 | |
| 2 week change | Min to Max | −77 to 73 | −74 to 73 | −77 to 54 | ||||||
| 4–6 week change | Adjusted Mean (SE, N) | 9.24 (1.92, 364) | <0.001 | 9.73 (2.17, 182) | <0.001 | 8.76 (2.18, 182) | <0.001 | 0.97 (−3.06, 4.99) | 0.638 | |
| 4–6 week change | Min to Max | −53 to 73 | −51 to 73 | −53 to 54 | ||||||
| 3 month change | Adjusted Mean (SE, N) | 13.79 (1.94, 332) | <0.001 | 14.11 (2.20, 168) | <0.001 | 13.47 (2.22, 164) | <0.001 | 0.64 (−3.49, 4.76) | 0.762 | |
| 3 month change | Min to Max | −42 to 63 | −42 to 63 | −42 to 58 | ||||||
| Sedentary Activities Scale 5 | ||||||||||
| Baseline | Adjusted Mean (SE, N) | 30.41 (0.64, 370) | -- | 30.35 (0.71, 185) | -- | 30.47 (0.71, 185) | -- | −0.12 (−1.33, 1.09) | 0.845 | |
| Baseline | Min to Max | 9 to 36 | 9 to 36 | 9 to 36 | ||||||
| 2 week change | Adjusted Mean (SE, N) | −1.79 (0.70, 355) | 0.012 | −0.48 (0.80, 177) | 0.547 | −3.10 (0.80, 178) | <0.001 | 2.62 (1.13, 4.10) | 0.001 | |
| 2 week change | Min to Max | −30 to 27 | −30 to 27 | −25 to 18 | ||||||
| 4–6 week change | Adjusted Mean (SE, N) | 2.27 (0.70, 365) | 0.001 | 2.54 (0.80, 182) | 0.002 | 2.00 (0.80, 183) | 0.013 | 0.54 (−0.94, 2.02) | 0.472 | |
| 4–6 week change | Min to Max | −20 to 27 | −18 to 27 | −20 to 23 | ||||||
| 3 month change | Adjusted Mean (SE, N) | 3.68 (0.71, 336) | <0.001 | 4.00 (0.81, 168) | <0.001 | 3.37 (0.81, 168) | <0.001 | 0.62 (−0.89, 2.14) | 0.418 | |
| 3 month change | Min to Max | −18 to 27 | −18 to 27 | −18 to 23 | ||||||
| Ambulatory Activities Scale | ||||||||||
| Baseline | Adjusted Mean (SE, N) | 21.47 (0.58, 371) | -- | 21.58 (0.65, 185) | -- | 21.36 (0.65, 186) | -- | 0.22 (−0.89, 1.32) | 0.701 | |
| Baseline | Min to Max | 2 to 27 | 2 to 27 | 5 to 27 | ||||||
| 2 week change | Adjusted Mean (SE, N) | 0.64 (0.62, 355) | 0.303 | 1.27 (0.70, 176) | 0.072 | 0.01 (0.71, 179) | 0.986 | 1.26 (−0.05, 2.57) | 0.059 | |
| 2 week change | Min to Max | −20 to 25 | −20 to 25 | −20 to 20 | ||||||
| 4–6 week change | Adjusted Mean (SE, N) | 2.49 (0.62, 366) | <0.001 | 2.63 (0.70, 182) | <0.001 | 2.35 (0.71, 184) | 0.001 | 0.28 (−1.02, 1.57) | 0.675 | |
| 4–6 week change | Min to Max | −20 to 25 | −20 to 25 | −18 to 20 | ||||||
| 3 month change | Adjusted Mean (SE, N) | 3.65 (0.63, 337) | <0.001 | 3.58 (0.71, 168) | <0.001 | 3.72 (0.71, 169) | <0.001 | −0.14 (−1.46, 1.19) | 0.841 | |
| 3 month change | Min to Max | −16 to 23 | −16 to 18 | −14 to 23 | ||||||
| Work/Exercise Activities Scale | ||||||||||
| Baseline | Adjusted Mean (SE, N) | 24.76 (0.97, 369) | -- | 24.93 (1.08, 184) | -- | 24.59 (1.08, 185) | -- | 0.34 (−1.50, 2.18) | 0.715 | |
| Baseline | Min to Max | 2 to 36 | 3 to 36 | 2 to 36 | ||||||
| 2 week change | Adjusted Mean (SE, N) | 0.42 (1.11, 310) | 0.703 | 1.43 (1.26, 154) | 0.257 | −0.58 (1.27, 156) | 0.645 | 2.01 (−0.40, 4.43) | 0.102 | |
| 2 week change | Min to Max | −36 to 32 | −36 to 23 | −36 to 32 | ||||||
| 4–6 week change | Adjusted Mean (SE, N) | 4.64 (1.09, 352) | <0.001 | 4.48 (1.24, 177) | <0.001 | 4.81 (1.25, 175) | <0.001 | −0.33 (−2.66, 1.99) | 0.778 | |
| 4–6 week change | Min to Max | −32 to 30 | −27 to 27 | −32 to 30 | ||||||
| 3 month change | Adjusted Mean (SE, N) | 7.11 (1.10, 329) | <0.001 | 7.05 (1.25, 167) | <0.001 | 7.17 (1.26, 162) | <0.001 | −0.11 (−2.49, 2.26) | 0.925 | |
| 3 month change | Min to Max | −25 to 32 | −18 to 27 | −25 to 32 | ||||||
The analyses for each outcome of interest were performed on the modified intent to treat population (mITT) which includes all participants that were eligible, gave consent, were randomized to both the PMT and surgical interventions, and for whom the outcome was assessed (i.e. non-missing). For analyses assessing each outcome’s change from baseline to a follow-up visit, all adjusted means, mean differences, standard errors, 95% confidence intervals, and p-values for outcomes were obtained from general linear models adjusting for randomized surgical intervention, randomized PMT intervention, visit, interaction between visit and randomized surgical intervention, interaction between visit and randomized PMT intervention, and three-way interaction between visit and randomized surgical intervention and randomized PMT intervention, concomitant hysterectomy, age at surgical randomization, race (white, black, other), ethnicity, public insurance, and private insurance while controlling for a random surgeon effect (if found statistically significant) and repeated subject visits. All tests were conducted at a significance level of 0.05.
This adjusted p-value corresponds to the test assessing if there was a statistically significant change from baseline.
This adjusted p-value corresponds to the test assessing if there was a statistically significant difference in the outcome between the two surgical treatments.
The effect of surgery varies across the PMT groups and across visits (p=0.042). See table 4 for the effect of randomized surgical intervention within the PMT and non-PMT groups.
The effect of surgery varies across the PMT groups and across visits (p=0.011). See table 4 for the effect of randomized surgical intervention within the PMT and non-PMT groups
There were no significant differences in overall AAS scores before surgery between patients randomized to ULS and SSLF (78.10 ± 1.99 vs. 77.96 ± 2.00, p=0.931). Aside from an overall and sedentary subscale score indicating less activity in the SSLF group at 2 weeks, there were no significant differences in any of the subsequent time points (4–6 weeks nor 3 months) in either the overall or any subscale score between surgeries (Table 3).
For patients assigned to PMT, overall AAS scores improved at 4–6 weeks and were maintained at 3 months. Scores for the sedentary activities subscale also demonstrated improvement 3 months postoperatively, with more improvement in the ULS than the SSLF group. Patients in the non-PMT group had improved scores for overall AAS and for the sedentary activities subscale, that persisted at 3 months after surgery, without differences between the surgical groups (Table 4).
Table 4.
Activity Assessment Scales from Baseline to 3 Months After Surgery in PMT and non-PMT groups Modeling Outcome as Change from Baseline 1
| PMT GROUP | NON-PMT GROUP | ||||||||||||
|---|---|---|---|---|---|---|---|---|---|---|---|---|---|
| ULS Surgical Treatment (N=90) | SSLF Surgical Treatment (N=95) | Surgical Treatment Difference | ULS Surgical Treatment (N=97) | SSLF Surgical Treatment (N=91) | Surgical Treatment Difference | ||||||||
| Variable | Time Frame | Estimate | Adjusted P-value 2 | Estimate | Adjusted P-value 2 | Adjusted Mean Difference (95% CI) 3 | Adjusted P-value 3 | Estimate | Adjusted P-value 2 | Estimate | Adjusted P-value 2 | Adjusted Mean Difference (95% CI) 3 | Adjusted P-value 3 |
| Overall AAS Score | |||||||||||||
| Baseline | 79.66 (2.33, 89) | -- | 76.94 (2.31, 94) | -- | 2.72 (−2.13, 7.56) | 0.271 | 76.55 (2.36, 96) | -- | 78.97 (2.38, 91) | -- | −2.42 (−7.24, 2.40) | 0.324 | |
| Baseline | 38 to 100 | 25 to 100 | 25 to 100 | 38 to 100 | |||||||||
| 2 week change | 3.03 (2.63, 83) | 0.250 | −1.67 (2.62, 87) | 0.525 | 4.70 (−1.11,10.51) | 0.113 | 1.92 (2.65, 87) | 0.470 | −4.48 (2.66, 87) | 0.094 | 6.40 (0.64, 12.15) | 0.029 | |
| 2 week change | −62 to 56 | −77 to 50 | −74 to 73 | −77 to 54 | |||||||||
| 4–6 week change | 7.66 (2.61, 88) | 0.004 | 10.14 (2.59, 92) | <0.001 | −2.48 (−8.20, 3.25) | 0.396 | 11.79 (2.62, 94) | <0.001 | 7.39 (2.65, 90) | 0.006 | 4.41 (−1.27, 10.09) | 0.128 | |
| 4–6 week change | −51 to 56 | −50 to 50 | −39 to 73 | −53 to 54 | |||||||||
| 3 month change | 10.89 (2.65, 81) | <0.001 | 15.69 (2.64, 82) | <0.001 | −4.80 (−10.67, 1.07) | 0.109 | 17.33 (2.66, 87) | <0.001 | 11.26 (2.69, 82) | <0.001 | 6.07 (0.27, 11.88) | 0.040 | |
| 3 month change | −42 to 56 | −42 to 58 | −10 to 63 | −34 to 54 | |||||||||
| Sedentary Activities Scale | |||||||||||||
| Baseline | 30.86 (0.83, 89) | -- | 29.86 (0.82, 94) | -- | 1.00 (−0.73, 2.72) | 0.256 | 29.84 (0.84, 96) | -- | 31.08 (0.85, 91) | -- | −1.24 (−2.95, 0.48) | 0.157 | |
| Baseline | 14 to 36 | 9 to 36 | 9 to 36 | 16 to 36 | |||||||||
| 2 week change | −0.45 (0.96, 85) | 0.640 | −2.77 (0.95, 90) | 0.004 | 2.32 (0.20, 4.44) | 0.032 | −0.51 (0.96, 92) | 0.597 | −3.42 (0.97, 88) | 0.001 | 2.91 (0.81, 5.01) | 0.007 | |
| 2 week change | −25 to 23 | −25 to 18 | −30 to 27 | −23 to 11 | |||||||||
| 4–6 weekchange | 1.74 (0.96, 88) | 0.069 | 2.92 (0.95, 93) | 0.002 | −1.17 (−3.27, 0.93) | 0.273 | 3.34 (0.96, 94) | 0.001 | 1.09 (0.97, 90) | 0.263 | 2.26 (0.17, 4.34) | 0.034 | |
| 4–6weekchange | −18 to 23 | −14 to 23 | −14 to 27 | −20 to 16 | |||||||||
| 3 month change | 2.75 (0.97, 81) | 0.005 | 4.38 (0.96, 84) | <0.001 | −1.63 (−3.78, 0.52) | 0.138 | 5.25 (0.98, 87) | <0.001 | 2.37 (0.98, 84) | 0.017 | 2.88 (0.75, 5.01) | 0.008 | |
| 3 month change | −18 to 23 | −14 to 23 | −7 to 27 | −18 to 16 | |||||||||
The analyses for each outcome of interest were performed on the modified intent to treat population (mITT) which includes all participants that were eligible, gave consent, were randomized to both the PMT and surgical interventions, and for whom the outcome was assessed (i.e. non-missing). For analyses assessing each outcome’s change from baseline to a follow-up visit, all adjusted means, mean differences, standard errors, 95% confidence intervals, and p-values for outcomes were obtained from general linear models adjusting for randomized surgical intervention, randomized PMT intervention, visit, interaction between visit and randomized surgical intervention, interaction between visit and randomized PMT intervention, and three-way interaction between visit and randomized surgical intervention and randomized PMT intervention, concomitant hysterectomy, age at surgical randomization, race (white, black, other), ethnicity, public insurance, and private insurance while controlling for a random surgeon effect (if found statistically significant) and repeated subject visits. All tests were conducted at a significance level of 0.05.
This adjusted p-value corresponds to the test assessing if there was a statistically significant change from baseline.
This adjusted p-value corresponds to the test assessing if there was a statistically significant difference in the outcome between the two surgical treatments.
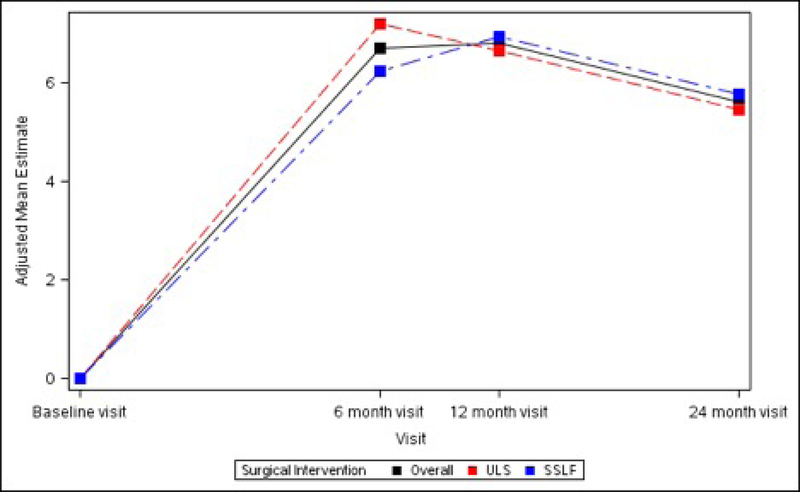
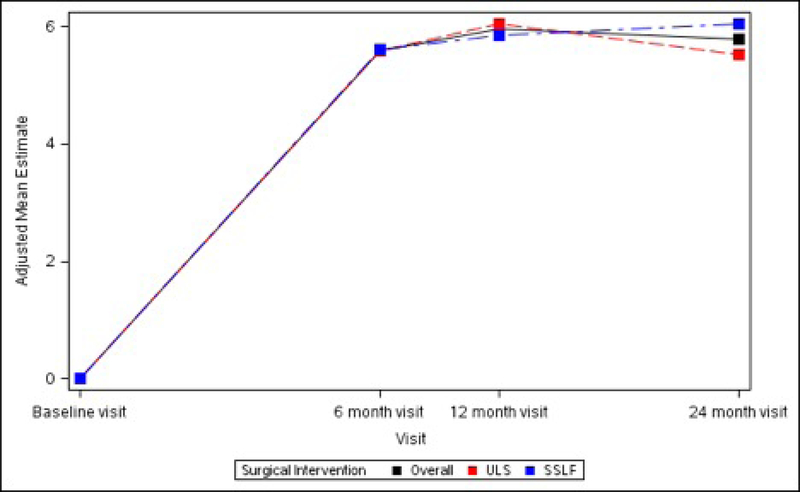
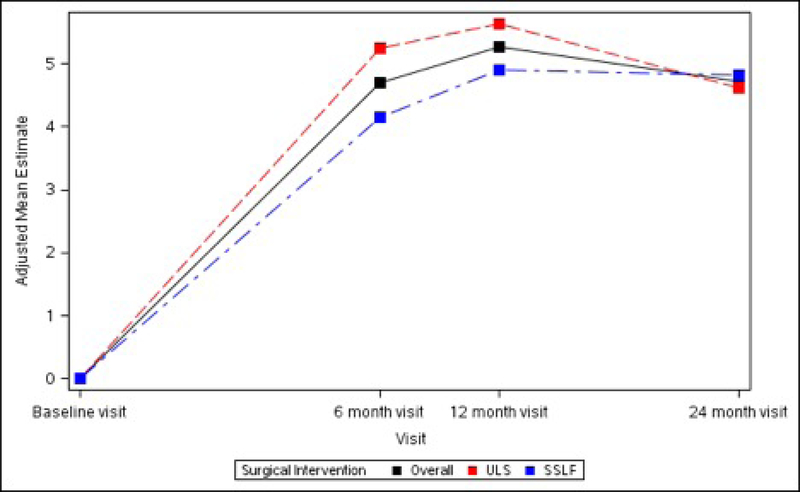
The SF-36 Bodily Pain, Physical Functioning and Role-Physical Scales all demonstrated significant improvements from baseline at 6 months (+6.72 ± 1.34, +5.60 ± 1.11 and +4.70 ± 1.11 respectively, p<0.001 for each), 12 months (+6.80 ± 1.34, +5.96 ± 1.11 and +5.26 ± 1.11 respectively, p<0.001 for each) and 24 months (+5.62 ± 1.35, +5.79 ± 1.12 and +4.72 ± 1.12 respectively, p<0.001 for each). No significant differences between ULS and SSLF surgery groups were noted at any timepoint after surgery. (Table 5; Figure 4)
Table 5.
Long-term Pain and Activity After Surgery SF36 Scale Changes from Baseline to 3 Months After Surgery Modeling Outcome as Change from Baseline 1
| All Surgical Treatments (N=374) | ULS Surgical Treatment (N=188) | SSLF Surgical Treatment (N=186) | Surgical Treatment Difference | |||||||
|---|---|---|---|---|---|---|---|---|---|---|
| Variable | Time Frame | Statistic | Estimate | Adjusted P-value 2 | Estimate | Adjusted P-value 2 | Estimate | Adjusted P-value 2 | Adjusted Mean Difference (95% CI) 3 | Adjusted P-value 3 |
| SF-36 Bodily Pain Scale4 | ||||||||||
| Baseline | Adjusted Mean (SE, N) | 43.20 (1.28, 361) | -- | 43.70 (1.39, 179) | -- | 42.70 (1.42, 182) | -- | 1.00 (−1.24, 3.25) | 0.381 | |
| 6 month change | Adjusted Mean (SE, N) | 6.72 (1.34, 332) | <0.001 | 7.20 (1.46, 165) | <0.001 | 6.23 (1.49, 167) | <0.001 | 0.97 (−1.47, 3.41) | 0.436 | |
| 12 month change | Adjusted Mean (SE, N) | 6.80 (1.34, 320) | <0.001 | 6.65 (1.46, 161) | <0.001 | 6.95 (1.50, 159) | <0.001 | −0.30 (−2.77, 2.17) | 0.812 | |
| 24 month change | Adjusted Mean (SE, N) | 5.62 (1.35, 298) | <0.001 | 5.47 (1.48, 149) | <0.001 | 5.77 (1.51, 149) | <0.001 | −0.31 (−2.84, 2.23) | 0.812 | |
| SF-36 Physical Functioning Scale4 | ||||||||||
| Baseline | Adjusted Mean (SE, N) | 39.02 (1.14, 365) | -- | 39.45 (1.25, 182) | -- | 38.59 (1.28, 183) | -- | 0.86 (−1.30, 3.03) | 0.434 | |
| 6 month change | Adjusted Mean (SE, N) | 5.60 (1.11, 337) | <0.001 | 5.58 (1.24, 168) | <0.001 | 5.61 (1.27, 169) | <0.001 | −0.03 (−2.33, 2.27) | 0.979 | |
| 12 month change | Adjusted Mean (SE, N) | 5.96 (1.11, 322) | <0.001 | 6.05 (1.24, 162) | <0.001 | 5.86 (1.28, 160) | <0.001 | 0.19 (−2.13, 2.51) | 0.875 | |
| 24 month change | Adjusted Mean (SE, N) | 5.79 (1.12, 301) | <0.001 | 5.53 (1.25, 151) | <0.001 | 6.05 (1.29, 150) | <0.001 | −0.52 (−2.88, 1.84) | 0.668 | |
| SF-36 Role Physical Scale4 | ||||||||||
| Baseline | Adjusted Mean (SE, N) | 41.40 (1.18, 364) | -- | 41.44 (1.30, 182) | -- | 41.35 (1.33, 182) | -- | 0.09 (−2.16, 2.34) | 0.939 | |
| 6 month change | Adjusted Mean (SE, N) | 4.70 (1.11, 336) | <0.001 | 5.25 (1.24, 168) | <0.001 | 4.16 (1.27, 168) | 0.001 | 1.09 (−1.24, 3.41) | 0.360 | |
| 12 month change | Adjusted Mean (SE, N) | 5.26 (1.11, 321) | <0.001 | 5.63 (1.24, 163) | <0.001 | 4.89 (1.29, 158) | <0.001 | 0.74 (−1.61, 3.09) | 0.537 | |
| 24 month change | Adjusted Mean (SE, N) | 4.72 (1.12, 300) | <0.001 | 4.62 (1.26, 150) | <0.001 | 4.83 (1.29, 150) | <0.001 | −0.21 (−2.61, 2.19) | 0.862 | |
The analyses for each outcome of interest were performed on the modified intent to treat population (mITT) which includes all participants that were eligible, gave consent, were randomized to both the PMT and surgical interventions, and for whom the outcome was assessed (i.e. non-missing). All analyses are performed as intent to treat analyses, and therefore, each outcome will be compared across each participant’s randomized surgical intervention. In addition, analyses were performed assessing each outcome’s change from baseline to follow-up visit. All adjusted means, mean differences, standard errors, 95% confidence intervals, and p-values for outcomes were obtained from general linear models adjusting for randomized surgical intervention, randomized PMT intervention, visit, all pairwise interactions between visit and the two randomized interventions, three-way interaction between visit and the two randomized interventions, concomitant hysterectomy, age at surgical randomization, race (white, black, other), ethnicity, public insurance, and private insurance while controlling for a random surgeon effect (if found statistically significant) and repeated subject visits. All tests were conducted at a significance level of 0.05.
This adjusted p-value corresponds to the test assessing if there was a statistically significant change from baseline.
This adjusted p-value corresponds to the test assessing if there was a statistically significant difference in the outcome between the two surgical treatments.
For the SF-36 Scales, higher scores indicate better functioning and/or less pain.
Figures 4A – 4C. Long-term Pain and Activity After Surgery SF36 Scale Changes from Baseline to 3 Months After Surgery Modeling Outcome as Change from Baseline1.
Figure 4A. SF-36 Bodily Pain Scale Change from Baseline across Visits by Surgical Interventions
Figure 4B. SF-36 Physical Functioning Scale Change from Baseline across Visits by Surgical Interventions
Figure 4C. SF-36 Role Physical Scale Change from Baseline across Visits by Surgical Interventions
1The analyses for each outcome of interest were performed on the modified intent to treat population (mITT) which includes all participants that were eligible, gave consent, were randomized to both the PMT and surgical interventions, and for whom the outcome was assessed (i.e. non-missing). For analyses assessing each outcome’s change from baseline to a follow-up visit, all adjusted means, mean differences, standard errors, 95% confidence intervals, and p-values for outcomes were obtained from general linear models adjusting for randomized surgical intervention, randomized PMT intervention, visit, interaction between visit and randomized surgical intervention, interaction between visit and randomized PMT intervention, and three-way interaction between visit and randomized surgical intervention and randomized PMT intervention, concomitant hysterectomy, age at surgical randomization, race (white, black, other), ethnicity, public insurance, and private insurance while controlling for a random surgeon effect (if found statistically significant) and repeated subject visits. All tests were conducted at a significance level of 0.05.
Groin and leg/thigh pain were reported at 2 weeks by 8.7% and 8.5%, respectively, and at 4–6 weeks by 3.8% and 5.2%, respectively, with no differences between surgical groups. However, compared with SSLF, ULS resulted in lower odds of new or worsening buttock pain at 2 weeks (ULS 14/185 (7.6%) vs SSLF, 43/181 (23.8%), [OR 0.26, 95% CI: 0.13–0.52], p<0.001) and 4–6 weeks (ULS 8/173 (4.6%) vs SSLF, 18/171 (10.5%), [OR 0.41, conservative 95% CI: 0.15–1.03], p=0.043) after surgery, and lesser odds of requiring narcotic medication for groin, leg or buttock pain at 2 weeks (ULS 12/182 (6.6%) vs SSLF, 26/180 (14.4%), [OR 0.42, 95% CI: 0.190.90], p=0.017). At 4–6 weeks, no patient in the ULS group had groin, leg or buttock pain requiring pain medications while 8 of 167 in the SSLF (4.8%) did so, p=0.003. Women in the SSLF group experienced more moderate to severe buttock pain at 2 weeks (ULS 13/169 (7.7%) vs SSLF, 37/166 (22.3%), [OR 0.29, 95% CI: 0.14–0.59], p<0.001); at 4–6 weeks, this difference was no longer statistically significant (3.6% vs. 7.0%, p=0.216).
Use of narcotic pain medications was reported by 14.3% (46/322) of participants prior to surgery, 53.7% (173/322) at 2 and 26.1% (84/322) at 4–6 weeks post-operatively. Thereafter, use was similar to baseline rates until 24 months when it decreased to 6.8% (22/322). Use of non-narcotic pain medication was reported by 48.1% (152/316) prior to surgery, 68.7% (217/316) at 2 weeks and similar to baseline at 3 months (45.3%, 143/316). Thereafter non-narcotic use dropped steadily to 26.6% (84/316) at 2 years. There were no significant differences in narcotic or non-narcotic use between surgical groups at any study time point.
Comment
Principal Findings
Four to six weeks after native tissue transvaginal prolapse repair with concomitant midurethral sling for stress urinary incontinence treatment, most women report pain levels below and functional activity levels above their baseline. Transient surgical pain in the immediate post-operative period (less than 1 week) is expected with varying degrees reported in the literature.15–18 We found that pain improved as early as 4–6 weeks after surgery, including pain at rest, with normal activity, with exercise, and worst pain. Importantly, some improvements in pain were sustained throughout the 2-year study follow-up period.
Results
Although the peri-operative pain patterns were similar in both surgical groups, there was one key difference: SSLF was associated with a greater odds of buttock pain compared to ULS. Compared to a prior report of 15% buttock pain at 6 weeks, we found a slightly lower rate of buttock pain (7.6% at 4–6 weeks)7; this difference may be related to our definition of only new or worsening buttock pain. Several of our findings suggest that there may be a pain control benefit to peri-operative PMT in women undergoing ULS. For instance, at 3 months participants randomized to ULS with PMT reported better improvement in pain at rest. In this study, we did not inquire specifically about groin, leg/thigh or buttocks pain after the 4–6 weeks postoperative questionnaire; while the rate was lower at 4–6 weeks than at 2 weeks, we do not know the long-term trajectory. A larger sample would be required to investigate the impact of persistent buttock pain on long-term functional activity.
The proportion of women that took prescribed narcotic pain medication reflects the prescribing practices during this study. We do not know the indication for which women took pain medication prior to surgery. The relatively high use of pain medication at baseline in our cohort may be associated with conditions other than pelvic organ prolapse, such as painful joints or chronic low back pain, conditions that are associated both with pain medication use and also common in older women who are at risk for pelvic floor disorders. It has also been shown that women who undergo surgery for prolapse are more likely to report a history of heavy work than women without prolapse, which could also be associated with back and joint pain requiring pain medications use.19 A recent study found that in women who underwent minimally invasive urogynecologic procedures, baseline chronic pain was a risk factor for higher rates of post-operative narcotic pain medication use; however, on average patients only used one third of the narcotics prescribed.20 In our surgical cohort, self-reported narcotic pain medication use returned to approximately baseline (14.3%) by 3 months after surgery (17.7%) with a further reduction to 6.8% at 2 years, suggesting that the surgical intervention did not increase, and may have decreased, long-term narcotic use.
Clinical and Research Implications
Most clinicians do not consider pain to be a major symptom of pelvic organ prolapse. We found it intriguing that reports of pain levels fell below a relatively low pain level at baseline, suggesting that there may be a mild sensation that affected patients interpret as pain, that is effectively resolved with native tissue vaginal repair. The reduced pain seen at 4–6 weeks and 3 months post-operatively by surgical pain scales support this possibility. Additional studies to evaluate any associations between pain and pelvic organ prolapse may further refine this relationship.
Beyond peri-operative pain control, functional activity and resumption of usual activities play an important role in patient satisfaction. Significant and clinically meaningful improvements from baseline were seen in the SF-36 Bodily Pain Scale, Physical Functioning Scale and Role-Physical Scale in our analysis. Our findings are consistent with prior reports. Whiteside et al. reported that patients with activity related goals preferred surgery and that post-operative activity improved overall and for each subscale of the Activity Assessment Scale.21 In a prospective cohort of women undergoing sacrocolpopexy for apical prolapse, at 1 year one third of the women reported increased exercise intensity and most reported that prolapse no longer interfered with activities.22 In a comparison of obliterative versus reconstructive procedures for prolapse in women 65 years or older, similar significant and clinically important improvements in the bodily pain and social functioning were also noted.23
Strengths and Limitations
The strengths of this study are that it is an analysis of a large, multi-centered randomized clinical trial. The study population is well characterized and validated instruments were used pre and post-operatively to assess pain and activity outcomes. Participants and outcome assessors were masked to surgical treatment assignment. This is a significant strength over most other studies comparing surgical procedures for pelvic organ prolapse, however it is possible that some participants may have become unmasked based upon their postoperative experience (i.e. unilateral buttock pain). Much of the existing literature on pain and functional activity after pelvic organ prolapse surgery focuses on the immediate post-operative period and there is a lack of consistent methods used for evaluating peri-operative pain and activity. This study includes the use of Surgical Pain Scales and Activity Assessment Scales that provide more detailed information about the circumstances under which pain is experienced and specifically characterizes various activities. All patients received standardized postoperative instructions that included limiting heavy lifting or exercise, however we have no information on compliance with those instructions or how these standardized instructions may have impacted postoperative pain or functional activity. Pain medication use by participant’s self-report is also a study limitation.
Conclusions
In conclusion, pain and functional activity improve for up to 2 years after native tissue reconstructive surgery with uterosacral or sacrospinous vaginal vault suspension and midurethral sling for stage 2–4 pelvic organ prolapse. Additionally, on average, immediate postoperative pain is low and improves to below baseline levels by 4–6 weeks. The course of post-operative pain and activity following vaginal reconstructive surgery with concomitant midurethral sling is reassuring. We would anticipate further improvements to this favorable course with less opioid prescribing, consistent with improvements in patient care seen broadly since our study was initiated. As the oldest minimally invasive route of reconstruction for pelvic organ prolapse, this evidence bolsters the well-deserved reputation of this minimally morbid approach and highlights benefits of treatment of coexisting prolapse and stress urinary incontinence, reducing pain and improving functional activity more than previously recognized.
Figures 3A–3D. Activity Assessment Scales from Baseline to 3 Months After Surgery (Unadjusted).
Figure 3A. Activity Assessment Scale Total
Figure 3B. Sedentary Activities Subscale
Figure 3C. Ambulatory Activities Subscale
Figure 3D. Work/Exercise Activities Subscale
AJOG at a Glance.
Why was this study conducted?
Little is known about both short- and long-term pain and functional activity after transvaginal surgery for pelvic organ prolapse.
What are the key findings?
In women undergoing two types of commonly performed transvaginal, native-tissue prolapse repairs with concomitant retropubic midurethral sling, pain and functional activity improve for up to 2 years. On average, immediate postoperative pain is low and improves to below baseline levels by 4–6 weeks.
What does this study add to what is already known?
Clinicians can use the information from this study to counsel women about pain and functional activity for the first two years after transvaginal surgery for prolapse.
Acknowledgements
Cleveland Clinic, Cleveland OH
Anna Frick, MD
John Eric Jelovsek, MD
Betsy O’Dougherty
Marie FR Paraiso, MD
Ly Pung, RN
Beri M Ridgeway, MD
Cheryl Williams
Duke University, Durham NC
Cindy L Amundsen, MD
Ingrid Harm-Ernandes
Mary Raynor
Nazema Y Siddiqui, MD
Anthony G Visco, MD
Alison C Weidner, MD
Jennifer M Wu, MD
Kaiser Permanente – Downey
John Nguyen, MD
Kaiser Permanente – Bellflower
Sharon Jakus-Waldman, MD
Kaiser Permanente – San Diego
Gouri Diwadkar, MD
Lynn M Hall
Linda M Mackinnon
Shawn A Menefee, MD
Jasmine Tan-Kim, MD
Gisselle Zazueta-Damian
Loyola University, Chicago - IL
Elizabeth Mueller, MD
Mary Tulke
University of Pittsburgh, Magee-Womens Research Institute
Diane Borello-France
RTI International
Lauren Klein Warren
Daryl Matthews
Amanda Shaffer
Tamara T Terry
Jutta Thornberry
Dennis Wallace
Ryan E Whitworth
Kevin A Wilson
Vanderbilt University
Katherine Hartmann, MD
University of Alabama at Birmingham
Alicia Ballard
Julie Burge
Kathryn L Burgio, PhD
Kathy Carter
Patricia S Goode, MD
Alayne D Markland, MD
Lisa S Pair
Candace Parker-Autry, MD
Holly E Richter, PhD, MD
R Edward Varner, MD
Tracey S Wilson
University of California at San Diego
Michael E Albo, MD
Cara Grimes, MD
Emily S Lukacz, MD
Charles W Nager, MD
University of Michigan
Yang Wang Casher
Yeh-Hsin Chen
Donna DiFranco
Bev Marchant
Cathie Spino
John T Wei, MD
University of Utah Medical Center
Jan Baker
Yvonne Hsu
Maria Masters
Amy Orr
University of Texas-Southwestern
Shanna Atnip
Elva Kelly Moore
David Rahn, MD
Joseph Schaffer, MD
Northwest Texas Physician Group, Amarillo, TX
Susan F Meikle, MD
PFDN Data Safety and Monitoring Board members:
Kay Dickersin, Johns Hopkins Bloomberg School of Public Health
Luohua Jiang, Texas A&M Health Science University
Missy Lavender, Women’s Health Foundation
Kate O’Dell, UMass Memorial Medical Center
Kate Ryan, National Women’s Health Network
Paul Tulikangas, University of Connecticut Hartford Hospital
Lan Kong, Penn State University College of Medicine
Donna McClish, Virginia Commonwealth University
Leslie Rickey, Yale New Haven Hospital
David Shade, The Johns Hopkins University
Ashok Tuteja, University of Utah
Susan Yount, Frontier Nursing University, Lexington KY
Grant Support: Supported by grants from the Eunice Kennedy Schriver National Institute of Child Health and Human Development and the NIH Office of Research on Women’s Health (2 UG1 HD041261-16, 2 UG1 HD054214, 2 UG1 HD041267-17, 2 UG1 HD054241, 2 U24 HD069031, U01 HD041249, U10 HD041250, U10 HD041261, U10 HD041267, U10 HD054136, U10 HD054214, U10 HD054215, U01 HD069031, and U10 HD054241)
Footnotes
Condensation
Pain and functional activity improve for up to 2 years after native tissue reconstructive surgery with uterosacral or sacrospinous vaginal vault suspension for pelvic organ prolapse
Disclosure of potential Conflicts of Interest: Barber, royalties from Elsevier and UpToDate; Brubaker, editorial stipends from JAMA, Female Pelvic Medicine and Reconstructive Surgery journal and UpToDate, honorarium from American Board of Obstetrics and Gynecology; Dyer, research funding from Pelvalon, Sunnyvale CA; Nygaard, editorial stipend from Elsevier; Gantz – Research funding received from Boston Scientific on behalf of the NICHD Pelvic Floor Disorders Network; the following authors have no potential conflicts of interest: Wai, Ellington
Publisher's Disclaimer: This is a PDF file of an unedited manuscript that has been accepted for publication. As a service to our customers we are providing this early version of the manuscript. The manuscript will undergo copyediting, typesetting, and review of the resulting proof before it is published in its final citable form. Please note that during the production process errors may be discovered which could affect the content, and all legal disclaimers that apply to the journal pertain.
References
- 1.Wu JM, Matthews CA, Conover MM, Pate V, Jonsson Funk M. Lifetime risk of stress urinary incontinence or pelvic organ prolapse surgery. Obstet Gynecol 2014;123:1201–6. [DOI] [PMC free article] [PubMed] [Google Scholar]
- 2.FDA. Urogynecologic surgical mesh:update on the safety and effectiveness of transvaginal mesh placement for pelvic organ prolapse, 2011. [Google Scholar]
- 3.Boyles SH, Weber AM, Meyn L. Procedures for pelvic organ prolapse in the United States, 1979–1997. Am J Obstet Gynecol 2003;188:108–15. [DOI] [PubMed] [Google Scholar]
- 4.Brown JS, Waetjen LE, Subak LL, Thom DH, Van den Eeden S, Vittinghoff E. Pelvic organ prolapse surgery in the United States, 1997. Am J Obstet Gynecol 2002;186:712–6. [DOI] [PubMed] [Google Scholar]
- 5.Olsen AL, Smith VJ, Bergstrom JO, Colling JC, Clark AL. Epidemiology of surgically managed pelvic organ prolapse and urinary incontinence. Obstet Gynecol 1997;89:501–6. [DOI] [PubMed] [Google Scholar]
- 6.Maher C, Feiner B, B K, S C. Surgical management of pelvic organ prolapse in women. Cochrane Database Syst Rev 2013;4: CD004014. [DOI] [PubMed] [Google Scholar]
- 7.Unger CA, Walters MD. Gluteal and posterior thigh pain in the postoperative period and the need for intervention after sacrospinous ligament colpopexy. Female Pelvic Med Reconstr Surg 2014;20:208–11. [DOI] [PubMed] [Google Scholar]
- 8.Barber MD, Brubaker L, Burgio KL, et al. Comparison of 2 transvaginal surgical approaches and perioperative behavioral therapy for apical vaginal prolapse: the OPTIMAL randomized trial. JAMA 2014;311:1023–34. [DOI] [PMC free article] [PubMed] [Google Scholar]
- 9.Lowenstein L, Dooley Y, Kenton K, Mueller E, Brubaker L. Neural pain after uterosacral ligament vaginal suspension. Int Urogynecol J Pelvic Floor Dysfunct 2007;18:109–10. [DOI] [PubMed] [Google Scholar]
- 10.Chung CP, Kuehl TJ, Larsen WI, Yandell PM, Shull BL. Recognition and management of nerve entrapment pain after uterosacral ligament suspension. Obstet Gynecol 2012;120:292–5. [DOI] [PubMed] [Google Scholar]
- 11.Barber MD, Brubaker L, Menefee S, et al. Operations and pelvic muscle training in the management of apical support loss (OPTIMAL) trial: design and methods. Contemp Clin Trials 2009;30:178–89. [DOI] [PMC free article] [PubMed] [Google Scholar]
- 12.Barber MD, Kenton K, Janz NK, et al. Validation of the activities assessment scale in women undergoing pelvic reconstructive surgery. Female Pelvic Med Reconstr Surg 2012;18:205–10. [DOI] [PMC free article] [PubMed] [Google Scholar]
- 13.Barber MD, Janz N, Kenton K, et al. Validation of the surgical pain scales in women undergoing pelvic reconstructive surgery. Female Pelvic Med Reconstr Surg 2012;18:198–204. [DOI] [PMC free article] [PubMed] [Google Scholar]
- 14.Ware JE Jr., Sherbourne CD. The MOS 36-item short-form health survey (SF-36). I. Conceptual framework and item selection. Med Care 1992;30:473–83. [PubMed] [Google Scholar]
- 15.Anger JT, Mueller ER, Tarnay C, et al. Robotic compared with laparoscopic sacrocolpopexy: a randomized controlled trial. Obstet Gynecol 2014;123:5–12. [DOI] [PMC free article] [PubMed] [Google Scholar]
- 16.Shatkin-Margolis A, Crisp CC, Morrison C, Pauls RN. Predicting Pain Levels Following Vaginal Reconstructive Surgery: Who Is at Highest Risk? Female Pelvic Med Reconstr Surg 2018;24:172–5. [DOI] [PubMed] [Google Scholar]
- 17.Willis-Gray MG, Husk KE, Brueseke TJ, Wu JM, Dieter AA. Predictors of Opioid Administration in the Acute Postoperative Period. Female Pelvic Med Reconstr Surg 2018. [DOI] [PubMed] [Google Scholar]
- 18.Botros C, Letko J, Gafni-Kane A, Botros S, Lozo S, Sand P. Postoperative pain and perceptions of recuperation after suture- and mesh-based apical sacrospinous ligament suspension. Int J Gynaecol Obstet 2017;139:95–9. [DOI] [PubMed] [Google Scholar]
- 19.Nygaard IE, Shaw JM. Physical activity and the pelvic floor. Am J Obstet Gynecol 2016;214:164–71. [DOI] [PMC free article] [PubMed] [Google Scholar]
- 20.Swenson CW, Kelley AS, Fenner DE, Berger MB. Outpatient Narcotic Use After Minimally Invasive Urogynecologic Surgery. Female Pelvic Med Reconstr Surg 2016;22:377–81. [DOI] [PMC free article] [PubMed] [Google Scholar]
- 21.Whiteside JL, Johnson JD, Spratt KF. Goals, symptoms, signs, and treatments among women with pelvic floor disorders. Female Pelvic Med Reconstr Surg 2014;20:104–10. [DOI] [PubMed] [Google Scholar]
- 22.Nygaard I, Handa VL, Brubaker L, et al. Changes in physical activity after abdominal sacrocolpopexy for advanced pelvic organ prolapse. Am J Obstet Gynecol 2008;198:570 e1–5. [DOI] [PMC free article] [PubMed] [Google Scholar]
- 23.Barber MD, Amundsen CL, Paraiso MF, Weidner AC, Romero A, Walters MD. Quality of life after surgery for advanced pelvic organ prolapse in elderly women: obliterative and reconstructive vaginal surgery. Int Urogynecol J 2007. July;18(7):799–806. [DOI] [PubMed] [Google Scholar]


