Abstract
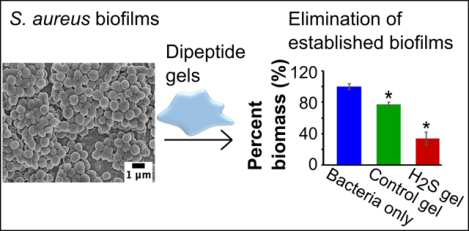
As a gasotransmitter, hydrogen sulfide (H2S) has been studied to treat wounds and inflammation, but its potential antimicrobial effects in this context have not been evaluated. An H2S-releasing dipeptide hydrogel (S-FE), and several non-H2S-releasing control dipeptides, (C-FE, C-GE, FBA-FE, and FE where S = S-aroylthiooxime, an H2S donor; C = control, an oxime incapable of H2S release; FBA = 4-formylbenzamide, also incapable of H2S release; and E, F, G = glutamic acid, phenylalanine, and glycine, respectively), were studied to correlate differences in their chemical structures and H2S-releasing abilities with their antimicrobial effects on Staphylococcus aureus bacteria. Dipeptides with Phe (S-FE, C-FE, and FE) self-assembled into nanoribbons in water and displayed β-sheet formation and enhanced fluorescence, while the other two dipeptides (FBA-FE and C-GE) did not form assemblies in water. In vitro experiments with Staphylococcus aureus, which is a commonly found bacterium associated with wounds, showed significant antimicrobial effects from some of the dipeptides. Dipeptide S-FE inhibited bacterial growth more effectively than any of the controls, thereby limiting biofilm formation or disrupting established biofilms. These antimicrobial H2S-releasing dipeptide hydrogels provide a promising new approach to treat wound infections.
Graphical Abstract
1. Introduction
Bacterial infections threaten human health in tissues throughout the body, comprising many different diseases. For example, bacterial infections range from dental caries and tonsillitis in the mouth to otitis media in the ears to prostatitis and endocarditis in the organs to ulcers and burn wound infections on the skin.1 Many types of bacteria can cause infections, where they attach to surfaces and form biofilms, protecting themselves by limiting direct contact from the host immune system or antimicrobial agents,2 making the treatment of infections challenging. Among various bacterial infections, burn wound infections are some of the most traumatic, prevalent, and difficult to treat. In the United States, about 486,000 burn injuries were reported by the Centers for Disease Control and Prevention between 2011 and 2015,3, 4 and worldwide there are approximately 180,000 deaths caused by burns annually.5 Even though burn injuries have a high survival rate (97 %),3 burn wounds are susceptible to infections, which not only lead to chronic inflammation and impair wound recovery, but also increase morbidity and mortality,6 with 70% of morbidity caused by infections.7 Staphylococcus aureus and Pseudomonas aeruginosa are the two most common pathogens isolated from infected burn wounds,7, 8 and they are common in other types of bacterial infections as well. The difficulties of treating wound infections, along with rising bacterial resistance to antimicrobial agents, create a need for novel methods to treat burn wounds and manage infections.
Delivery of hydrogen sulfide (H2S) could promote wound healing and reduce infections. H2S is endogenously produced with specific biological functions, joining nitric oxide (NO) and carbon monoxide (CO) in the group of signalling gasses called gasotransmitters.9, 10 H2S plays several physiological roles, including regulating ion channels, affecting the production of other gasotransmitters, and promoting vasodilation. Through these pathways, delivery of exogenous H2S has been investigated as a potential therapeutic strategy due to the ability of this gas to promote angiogenesis,11 increase cell proliferation and migration,12, 13 and reduce inflammation.14,15 Specifically, H2S can increase blood perfusion to the wound,16 which may help clear bacterial infections and accelerate the healing process by increasing neutrophil migration through the activation of KATP channels.13, 17 Outside the host-pathogen interaction, one mechanism by which H2S may exert an antimicrobial benefit is through the inhibition of cellular respiration, which is especially important for a facultative anaerobic bacteria like S. aureus. H2S also interacts with oxygen to form reactive sulfur species like hydropolysulfides and persulfides. For example, formation of the potent antimicrobial pentathionic acid (H2S5O6) is a mechanism by which H2S may react with oxygen to impart bactericidal benefits.18 Recently, it has been discovered that reactive sulfur species impact the virulence regulator of S. aureus, MgrA.19 Finally, it has also recently been discovered that disruption of CsoR-like sulfurtransferase repressor (CstR), which is sensor that regulates sulfur homeostasis for S. aureus, can further influence virulence gene expression.20 These effects indicate that H2S delivery may be an excellent strategy for burn wound treatment, but efforts to use H2S in wound healing thus far have focused primarily on the anti-inflammatory,21, 22 or protective effects of H2S against organ injuries.22, 23 Given that wound healing involves challenges in both promoting healing processes and preventing infections, we aimed here to evaluate the ability of H2S to reduce infections in this context.
Many delivery methods have been reported for therapeutic application of H2S;24–27 however, for clinical application of burn wounds and infection treatments, controlled release and localized delivery are two factors that need extra attention. Controllable H2S release is necessary because burst release of H2S could lead to an inflammatory response, which has been observed using sulfide salts in a mouse model of sepsis and a rat stroke model.28, 29 Localized delivery is vital because treatment of burn wounds and dermal infections would require application of H2S to specific areas, which eliminates systemic delivery methods like inhalation, oral administration, and intravenous injection. For this reason, H2S-releasing materials with controlled release (from minutes to a few hours) and dose are better candidates compared with sulfide salts and pure H2S gas.
Recognizing the need for H2S-releasing materials, our lab has begun exploring peptide-based hydrogels for H2S delivery. Peptide hydrogels are intrinsically biodegradable and biocompatible in many contexts, and they can be designed and synthesized by solid phase peptide synthesis. Hydrogel formation is induced by non-covalent interactions like hydrogen bonding, aromatic stacking, hydrophobic interactions, and charge screening.30 To prepare H2S-releasing hydrogels, we rely on S-aroylthiooximes (SATOs), which are compounds that release H2S in response to thiol triggers (Scheme S1).31–33 By connecting a SATO group to a short peptide sequence, we have shown that aromatic peptide amphiphile (APA) hydrogels release H2S in a controllable manner,33–35 and are non-toxic and in some cases cytoprotective to mammalian cell lines,35–38 making these peptide-based, H2S-releasing hydrogels suitable for bioengineering purposes.36, 38 Considering the gap in research in treating infections using H2S, combined with the ability of H2S-releasing APA hydrogels to localize release of the gas, we aimed to investigate the antimicrobial effects of H2S using APA hydrogels against one of the most common pathogens, S. aureus. In this work, we designed a new SATO-based APA with the peptide sequence Phe-Glu (FE), using it to form a hydrogel for localized H2S release to disrupt S. aureus growth and biofilm formation.
2. Experimental
2.1. Materials:
Peptides were synthesized via Fmoc-based solid-phase peptide synthesis using Rink Amide MBHA resin. Amino acids and resin were purchased from P3BioSystems, and all other reagents were purchased and used as received. Phosphate-buffered saline (PBS) was used for evaluation of the hydrogels and bacterial studies. Nutrient Broth 1 (NB1), Bacto™ Agar, and Tryptic Soy broth (TSB) were purchased from commercial vendors and used as received. Pooled human plasma containing sodium heparin (Innovative Research) was used to promote clinically similar characteristics and adhesion of S. aureus biofilms to surfaces. Two Staphylococcus aureus variants were purchased: UAMS-1 (ATCC 49230) and a bioluminescent version (Xen 29) (Perkin Elmer 119240).
2.2. Preparation of H2S-releasing SATO dipeptide (S-FE) and non-H2S-releasing control dipeptides (C-FE, C-GE, FBA-FE, and FE)
An aldehyde-terminated peptide with the sequence FBA-Phe-Glu (FBA-FE, FBA = 4-formylbenzamide) was synthesized via solid-phase peptide synthesis using methods described previously.39 SATO-Phe-Glu (S-FE) was prepared by reaction of the peptide-aldehyde with S-benzoylthiohydroxylamine (Figure S1) following published procedures.33, 39 An oxime-containing dipeptide (control-Phe-Glu (C-FE)), which does not release H2S, was produced by reacting FBA-FE with O-benzylhydroxylamine hydrochloride in DMSO (Figure S1). FBA-FE, control-Gly-Glu (C-GE) and Phe-Glu (FE) were also prepared via similar procedures. All dipeptides were purified by preparative HPLC following a published procedure.39
2.3. Transmission electron microscopy (TEM)
Peptide solutions with concentrations of 36 mM (50 μL) were prepared in 0.05 M pH 6.0 phosphate buffer and allowed to self-assemble for 18 h before diluting to 500 μM in DI water. The diluted peptide solution (10 μL) was cast onto carbon-coated copper TEM grids (Electron Microscopy Sciences) and allowed to stand for 10 min before wicking away excess water with filter paper. Next, water (10 μL) was added to the grids for 40 s to wash the samples and then wicked away. Finally, 2 wt% uranyl acetate solution in water (10 μL) was dropped on to the grids to stain the samples for 6 min before removing the excess by wicking. Sample grids were allowed to air-dry overnight before imaging. All images were taken on a Phillips EM420 TEM with a slow scanning CCD camera.
2.4. Thioflavin-T assay (ThT)
Self-assembled dipeptides with concentrations of 36 mM were prepared in pH 6.0 PBS (1X) and allowed to sit for 2 h. ThT (0.02 mg/mL) was dissolved in pH 7.4 PBS (1X) to make the working solution. Each dipeptide sample was diluted to 1 mM with 0.02 mg/mL ThT solution, and then excited at 440 nm using an Agilent Cary Eclipse fluorescence spectrometer (Agilent Technologies). The emission wavelength ranged from 470 to 550 nm, with a scanning speed of 600 nm/min. Control experiments included each peptide without ThT and a ThT only solution, and these controls were tested under the same fluorescence conditions.
2.5. Fourier-transform infrared spectroscopy
A Nicolet 8700 IR spectrometer equipped with an attenuated total reflectance (ATR) accessory (Thermo Fisher Scientific) was used for Fourier-transform infrared (FTIR) spectroscopy. Deuterated phosphate buffer was prepared by dissolving NaOH in D2O to make a 0.01 M solution, and then adjusting the pD to 6.4 using D3PO4. All samples were dissolved in this deuterated phosphate buffer at 36 mM (2 wt%), and a background scan of deuterated phosphate buffer was subtracted before every measurement. Each spectrum is an average of 64 scans with frequency ranging from 1600 to 1700 cm−1.
2.6. Circular dichroism
For each dipeptide, a stock solution (36 mM) was made by dissolving corresponding amounts of the pure dipeptides in 50 μL of pH 6.0 PBS (1X). For experiments under dilute conditions (0.1 mM), samples were prepared by adding 2 μL of the 36 mM peptide stock solution into 718 μL of DI water, then sonicating for 1 min to break up any self-assembled structures, and finally immediately measuring the CD spectrum. The rest of the peptide stock solution (36 mM) was allowed to mature (2 h) for self-assembly development, then 2 μL of the peptide solution was mixed with 718 μL of DI water just before the CD measurement to preserve the supramolecular structures while at 0.1 mM concentration. CD spectra were recorded on a Jasco J-815 CD spectrometer (Jasco Inc.) at rt, with N2 flow and scan range set at 120 mL/min and 250–190 nm, respectively. The scan rate was 50 nm/min with an 8 s response time. All tests were taken in a 1 mm CD cuvette.
2.7. Fluorescence spectra
For each dipeptide, 1 mg of pure sample was dissolved in 50 μL of pH 6.0 PBS (1X) and allowed to self-assemble for 2 h. Samples were transferred to a quartz cuvette (Starna Cells, 16.40F-Q-10/Z15), and an Agilent Cary Eclipse fluorescence spectrometer (Agilent Technologies) was used for fluorescence spectroscopy. The scanning speed was set to 120 nm/min with 1 nm data pitch, and the excitation and emission slits were 10 nm and 20 nm, respectively. The excitation wavelength (λex) was set to 290 nm, and the emission range was 300–530 nm.
2.8. H2S detection using an H2S sensitive electrode probe
H2S release profiles of the hydrogels were determined using an H2S-sensitive electrode probe (World Precision Instruments). Each dipeptide sample (1 mg) was dissolved in 50 μL of pH 6.0 PBS (1X), and then transferred to the gel-holding well in a specially designed vial.34 The peptide solutions in the well were allowed to self-assemble for 2 h to form hydrogels, and then 7.2 μL of 500 mM cysteine (Cys) was added to the top of the hydrogels to trigger H2S release. The well was quickly covered by a Breathe-EASIER membrane (Diversified Biotech), and sealed with an O-ring. PBS (5 mL, 1X, pH 7.4) was added to the vial to trap any released H2S, and an electrode probe (World Precision Instruments, ISO-H2S-100) was submerged into the PBS solution to detect the real-time H2S concentration. Signals were recorded by LabScribe software (World Precision Instruments).
2.9. Rheology
The rheological properties of two dipeptide hydrogels with SATO and oxime functionalities, S-FE and C-FE, were studied using an AR-G2 rheometer (TA Instruments) equipped with a Peltier plate and a 20 mm measuring top geometry. The gap between the top geometry and bottom plate was 500 μm, and the temperature was kept at 37 °C. For each dipeptide, 5 mg of sample was dissolved in 250 μL of PBS (1X, pH 6.0), then this solution was transferred to the Peltier plate by a micropipette and allowed to stand for 10 min before measurement. Each rheological procedure consisted of two time-sweeps and a steady-state shear to check both the rheological properties and the recoverability of the hydrogel. The first time-sweep was measured at 0.5% strain with a frequency of 1 Hz, followed by a 30 s steady-state shear (500/s) to completely disassemble the hydrogel. Next, a second 45 min time-sweep was applied to observe the recovery of the hydrogel under the same conditions as the first time-sweep.
2.10. Determining the effect of Cys on bacterial growth
Cysteine was used to trigger H2S release from the SATO-containing peptide hydrogels. To confirm that Cys did not have an inherent antimicrobial effect, we tested Cys on the growth of Xen29. The Xen29 bacteria were grown in an overnight culture in Nutrient broth 1 (NB1) at 37 °C, and a 500 mM l-cysteine solution was made by dissolving l-cysteine powder in DI water. The Xen29 culture was diluted to an OD600 (optical density at 600 nm) of approximately 0.1, which correlates to 1×10⁸ colony forming units per mL (CFU/mL). Cys solution (1440 μL) was added to the Xen29 culture. A control group using sterile water instead of Cys solution was prepared in the same manner. Samples of both treatments were incubated in an orbital shaker at 37 °C for 24 h with a shaking speed of 166 rpm. Serial dilutions were carried out, and bacteria were plated on NB1 agar plates. Finally, all plates were incubated at 37 °C overnight to form colonies, and the number of CFUs was enumerated.
2.11. Effects of H2S-releasing dipeptides on planktonic S. aureus bacterial cultures
S-FE or the various control molecules were dissolved in pH 6.0 PBS (1X) at a concentration of 36 mM. Next, 14.4 μL of 500 mM Cys in sterile water was added to 100 μL of the S-FE or control gels to induce H2S release. This was then added to 20 μL of UAMS-1 bacterial culture (1×10⁸ CFU/mL) in 280 μL TSB. A bacteria-only group was also prepared by adding 100 μL of pH 6.0 PBS (1X) to bacterial culture instead of the S-FE hydrogel. Five samples were prepared for all groups and incubated at 37 °C in a tube revolver for 4 h. After incubation, 10 μL of the bacterial culture was taken from each sample, serially diluted, plated on TSB agar plates, and cultured in an incubator for 18 h to quantify the bacterial burden by counting the number of CFUs/mL.
For each treatment group, the remaining bacterial cultures were added to a 96-well plate, then incubated for 48 h at 37 °C to form biofilms. The masses of the biofilms were quantified using a crystal violet (CV) staining assay.40 Before CV staining, the biofilms were washed twice with sterile water to remove gel remnants and planktonic bacteria and then heat-fixed at 60 °C for 60 min. Next, the biofilms were stained for 15 min using 0.1% CV in water. The stained biofilms were washed and air-dried for 24 h, and then 100 μL of solubilizing solution (200 μM sodium citrate in 50% ethanol in water) was added to each well. The mixtures of biofilms and solubilizing solution were shaken (8 rpm) at rt for 30 min then diluted before quantifying the absorptions of the CV-stained biofilms at 590 nm, using the absorption of the solubilizing solution as the background.
2.12. Effects of H2S-releasing dipeptides on S. aureus bacterial biofilms
The experimental groups included S-FE, C-FE, FBA-FE, C-GE, and FE. Each was tested against a control group treated with PBS only. One aspect of the experiment was to test the effect of the dipeptides on established biofilms. The other aspect of the experiment evaluated the ability of the dipeptides as a prophylactic in biofilm formation. UAMS-1 S. aureus was used for its superior ability to form biofilm in vitro compared to Xen 29. To enhance biofilm robustness and adhesion, human plasma in sodium bicarbonate (at 20%) was added to the wells of tissue culture plates prior to inoculation, as described previously, with a few modifications.41 The human plasma solution was added to the wells of tissue culture plates then incubated at 4 °C overnight. The solution was removed, then plates were allowed to dry for 2 h in a sterile hood. To grow biofilms, UAMS-1 overnight culture was diluted to an OD600 of approximately 0.1, which correlates to 6.7×10⁷ CFU/mL, in TSB broth with 10% human plasma. Next, 1 mL of the bacterial broth was added to the plasma coated wells and incubated for 24 h at 37 ˚C. For established biofilms, each treatment was added directly to the biofilm. For prophylactic analysis, each treatment was added to a stock of planktonic UAMS-1, in TSB containing 10% human plasma, at a ratio of 1:5. The planktonic treatment mixtures were then added to the designated plasma coated wells, and statically incubated at 37 °C to develop biofilms. After 24 h, all biofilms were gently washed and stained using the CV assay described above.
2.13. Scanning Electron Microscopy (SEM) imaging
To form biofilms for SEM, glass coverslips (5 mm) were coated with 20% human plasma solution in a 24-well plate and air-dried in a sterile hood. Then, the UAMS-1 overnight culture was diluted to 0.1 OD at 600 nm in TSB broth with 10% human plasma, and 1 mL of the diluted culture was added to each coverslip, followed by a 24 h incubation at 37 ˚C. The biofilms were gently washed once with sterile water, and then treated with PBS, C-FE, or S-FE. Established biofilms received a mixture of each treatment that had been previously added to a stock of TSB, containing 10% human plasma, at a ratio of 1:5. Additionally, as described above, Cys in PBS was added to the biofilm and prophylactic groups, as well as to a PBS only control. After 24 h of incubation, the samples were prepared for SEM as published previously.42 Samples were fixed using 10% glutaraldehyde for 2 h and then air dried for 6 h under a fume hood. The samples were then sputter coated with silver and imaged using a JEOL JSM-6330F microscope.
2.14. Confocal laser scanning microscopy (CLSM)
UAMS-1 biofilms were formed on glass chamber coverslips. Samples were prepared using established biofilms treated with the hydrogels (as compared to use of the hydrogels applied prophylactically) to evaluate the potential for inhibition of biofilm formation. Following exposure to each treatment for 24 h, biofilms were then rinsed with sterile water and prepared for observation by CLSM.41, 43–45 After the sterile water wash, samples from each treatment group were multi-stained with FilmTracer LIVE/DEAD Biofilm Viability Kit and either Wheat Germ Agglutinin (WGA) Alexa Fluor Conjugate 488 or 555 (Invitrogen), according manufacturer specifications. The sample was rinsed with sterile water after stain removal and kept hydrated for observation using an Olympus FluoView 1200 Laser Scanning Confocal Microscope (Olympus America Inc., Melville, NY). The CLSM images were acquired under 10X magnifications, and image analysis/processing was performed using Olympus FluoView and FIJI/Image-J software.
2.15. Statistical analysis
The mean values of planktonic assays are shown with error bars indicating standard deviations from five trials unless otherwise indicated. All data were analyzed by one-way analysis of variance (ANOVA) with the Tukey-Kramer HSD test, where p < 0.05 denotes statistical significance. ANOVA analysis was performed using JMP software (version 10.0.2, Copyright © 2012 SAS Institute Inc.).
3. Results and discussion
3.1. Results
Preparation of dipeptides.
To prepare H2S-releasing peptides, we prepared a series of dipeptides with appended SATO groups, which release H2S in response to a thiol-trigger such as Cys. Previous work from our lab on H2S-releasing APAs focused on peptides that required CaCl2 to trigger gelation. Because Ca2+ has biological roles, we aimed here to design an APA that would gel without the need for CaCl2. After studying several small SATO-based APAs, we found that S-FE gelled upon standing for a short time in pH 6.0 buffer without adding any additional reagents. To support our studies here on S-FE, we synthesized several control dipeptides as well. S-FE, C-FE, C-GE, FE, and FBA-FE were successfully synthesized and purified as described in section 2.2 and the SI. Among the five dipeptides, S-FE included an H2S-releasing SATO unit and was capable of releasing H2S; C-FE and C-GE were oxime-based control molecules, which had similar structures to S-FE but could not release H2S. We also prepared FE and FBA-FE, representing the dipeptide component of S-FE and the degraded, aldehyde-containing product of S-FE, respectively. All dipeptides were isolated and handled as white powders after purification and lyophilization. For each sample, the peptide solution (36 mM) was prepared by dissolving pure peptide powder in 10 mM PBS (pH 6.0), and each solution was allowed to self-assemble for 30 min at rt. After the 30 min maturation, S-FE, C-FE, and FE formed hydrogels, while FBA-FE and C-GE did not gel.
Critical aggregation concentrations (CACs) of dipeptides.
The critical aggregation concentration (CAC) marks the critical point above which molecules start to aggregate. To measure the CACs of the dipeptides, a Nile red assay was used as previously reported.33 All dipeptides had CACs ranging from 0.5 to 1.0 mM (Table S1), with S-FE and C-FE near 0.5 mM, FE at 0.7 mM, and C-GE and FBA-FE near 1 mM. Based on the CAC data, subsequent experiments were conducted at either 36 mM or 0.1 mM to represent dipeptide amphiphiles in their self-assembled or unassembled states, respectively.
Transmission electron microscopy (TEM) imaging.
To visualize the supramolecular structures of each dipeptide, we started with morphological analysis using conventional TEM. Images of self-assembled dipeptide morphologies are shown in Figure 1, and measurements of their dimensions were done by averaging 200 nanostructures in several different images for each dipeptide. Twisted nanoribbons were observed for S-FE (Figure 1A) and C-FE (Figure 1B), with the lengths of the twisted nanofibers on the μm scale, and widths of 13±5 and 24±6 nm, respectively. FE (Figure 1E) also formed nanoribbons with widths of 13±2 nm and lengths on the μm scale, but no twists were observed. C-GE and FBA-FE had no specific morphologies, and only poorly defined aggregates were observed (Figure 1C, 1D). The twisted structures of S-FE and C-FE allowed us to measure their thicknesses, which were 7±1 nm and 8±2 nm, respectively. The calculated lengths of both S-FE and C-FE were around 2.2 nm (Figure 1F). Each comprised a hydrophobic segment (1.0 nm) and a hydrophilic segment (1.2 nm). Thus, the minimum bilayer thickness, with completely interdigitated hydrophobic segments, would be 3.4 nm; using similar logic, the maximum bilayer thickness, with no interdigitation of hydrophobic segments, would be 4.4 nm. Thus, the observed thicknesses of the self-assembled dipeptides (7–8 nm) suggest that two bilayers (~4 nm per layer) pack together to form the full thickness of the twisted nanoribbons.
Figure 1.
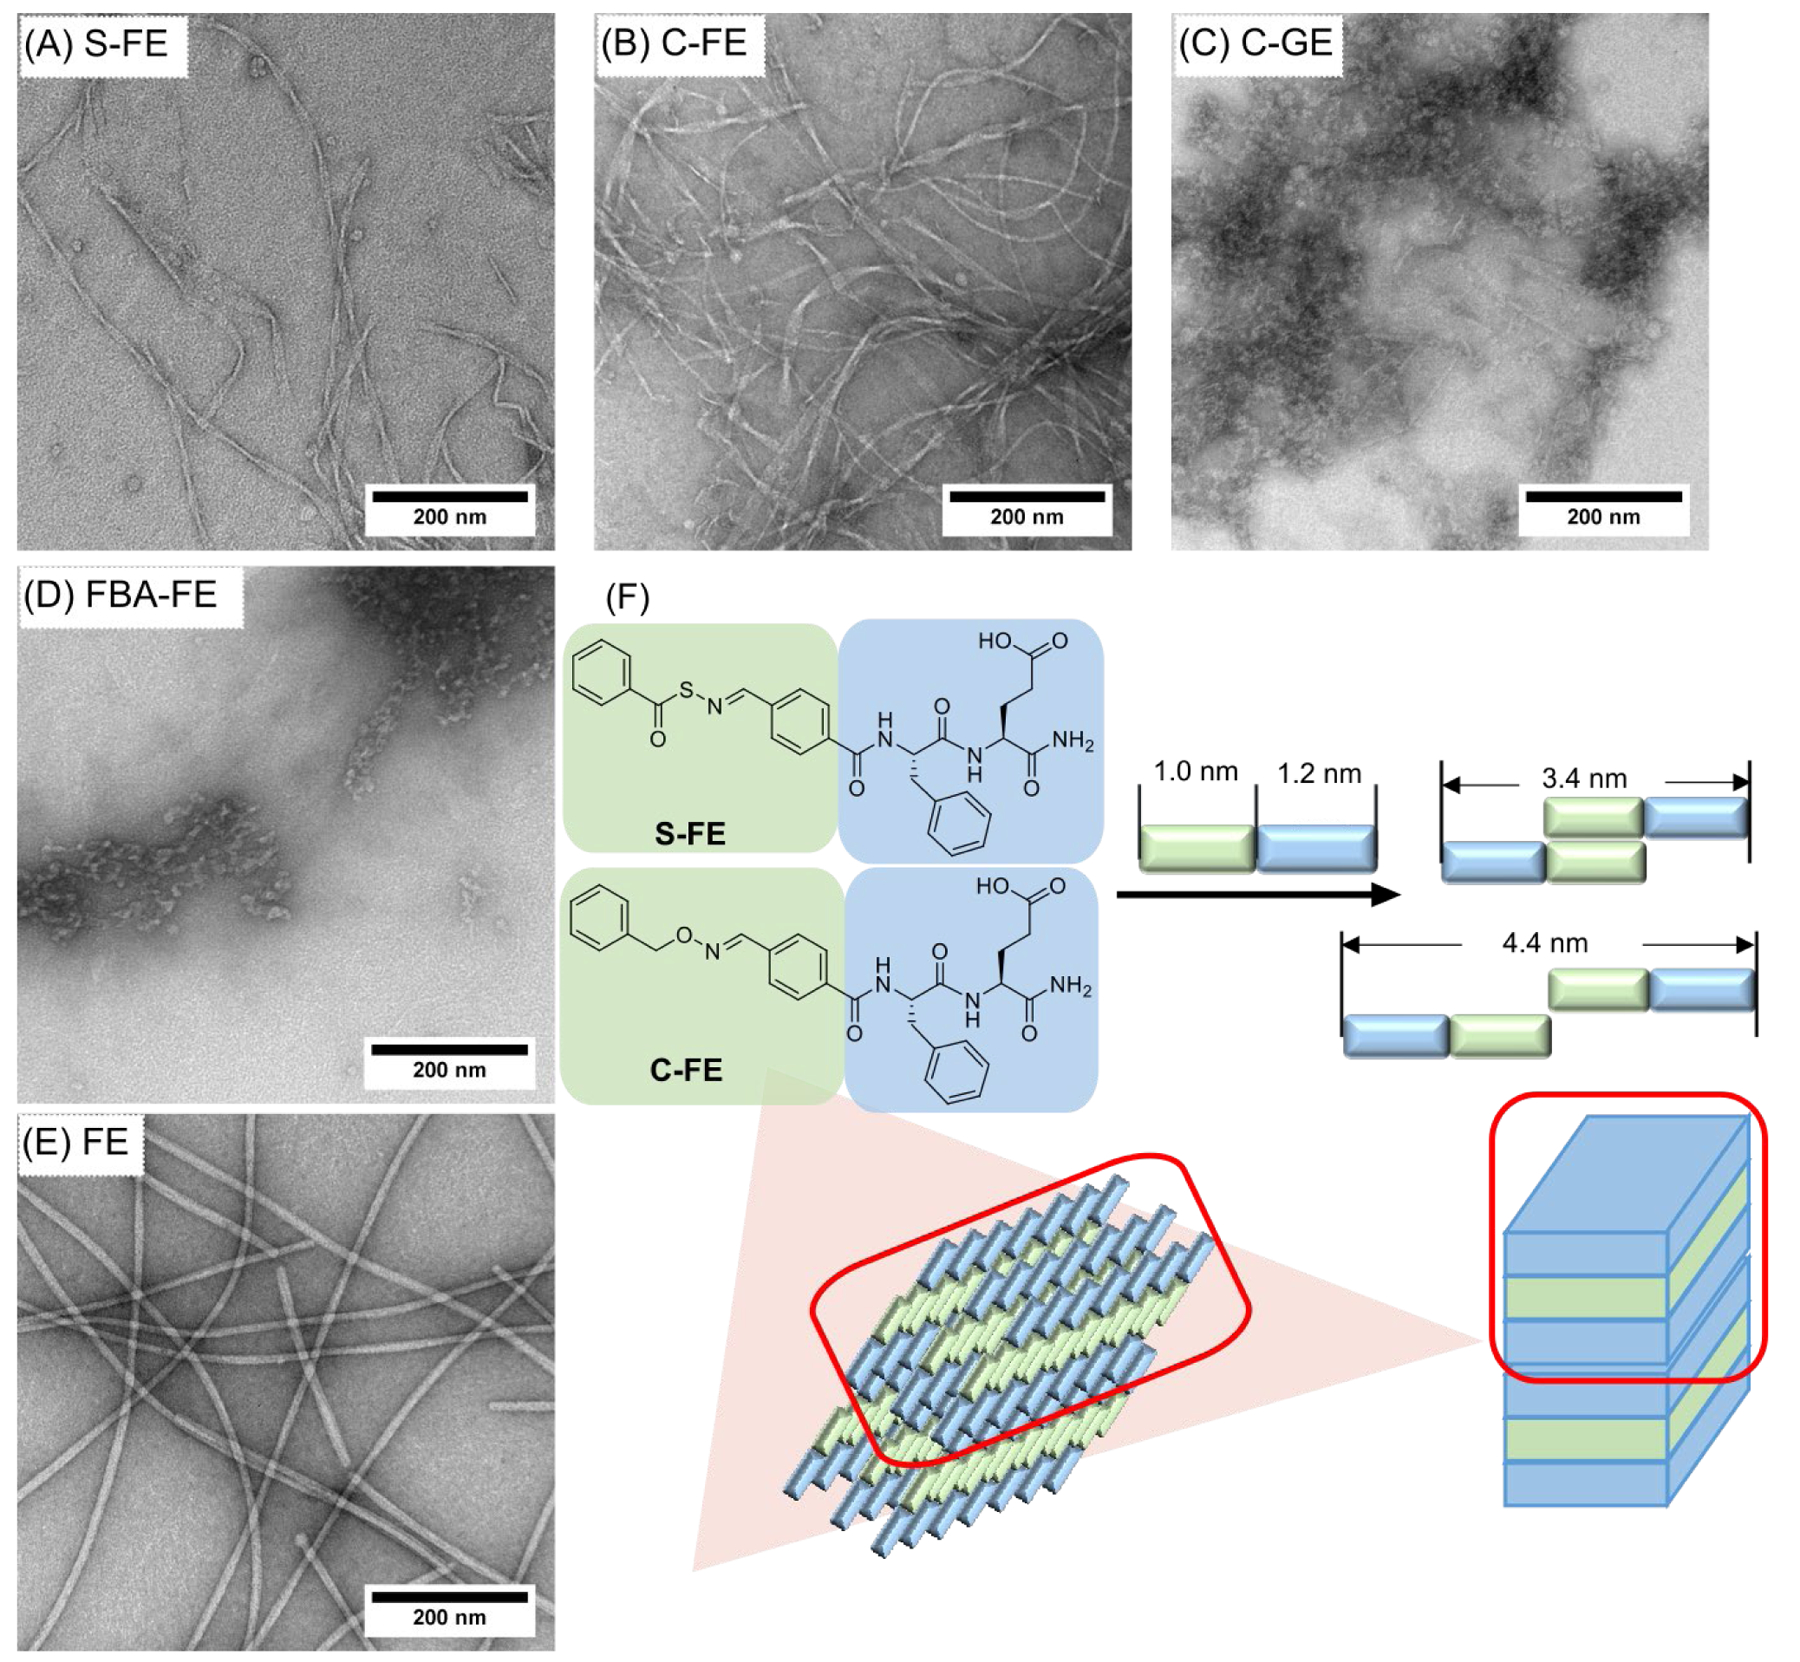
TEM images (stained with 2 wt% uranyl acetate) of (A) S-FE, (B) C-FE, (C) C-GE, (D) FBA-FE, and (E) FE. Images with higher magnifications can be seen in Figure S6. (F) Schematic illustration of the proposed self-assembled structures of S-FE and C-FE.
Circular dichroism spectroscopy.
Circular dichroism (CD) was used to evaluate the secondary structures in the self-assembled dipeptides. A typical β-sheet conformation has a positive peak at 195 nm and a negative peak at 218 nm, while a random coil shows a negative band around 190–200 nm.46 In the CD spectra of the unassembled dipeptide solutions (Figure S2), four dipeptides (S-FE, C-FE, C-GE, and FBA-FE) showed negative peaks around 190–200 nm, indicating random coils in solution. For assembled dipeptides, positive peaks appeared in S-FE (204 nm) and C-GE (208 nm), revealing possible β-turns in the self-assembled structures. However, the negative peaks in the 190–200 nm range remained for all four peptides, indicating that substantial contributions from random coil conformations remained in the self-assembled nanostructures. We observed a different pattern for FE compared to others, with no easily identifiable peaks for either the unassembled or the assembled samples. No evidence of β-sheet secondary structures were found in any of the dipeptides, although β-sheet signatures have been reported in similar dipeptides.47–49 In this study, CD provided limited information about secondary structures, likely due to interference from the aromatic amino acid (Phe) present in all of these dipeptides. Therefore, we relied on other techniques to assess secondary structure.
Thioflavin-T assay.
Because the CD results did not provide useful information on the conformations of the dipeptides, the existence of β-sheet structures was probed using the thioflavin-T (ThT) assay. ThT is a dye that fluoresces brightly in the presence of β-sheet structures.50 Minimal fluorescence emissions were observed for ThT only or peptide only conditions for each dipeptide (Figure 2). However, when the self-assembled peptides of S-FE and C-FE were treated with the ThT solution, fluorescence intensities increased dramatically, indicating that the ThT dye interacted with the β-sheet structures. FE showed a much lower fluorescence increase compared with S-FE and C-FE, while C-GE and FBA-FE exhibited no intensity increase. These fluorescence changes demonstrated the existence of β-sheets in S-FE, C-FE, and FE, while C-GE and FBA-FE did not have any evidence of β-sheet formation.
Figure 2.
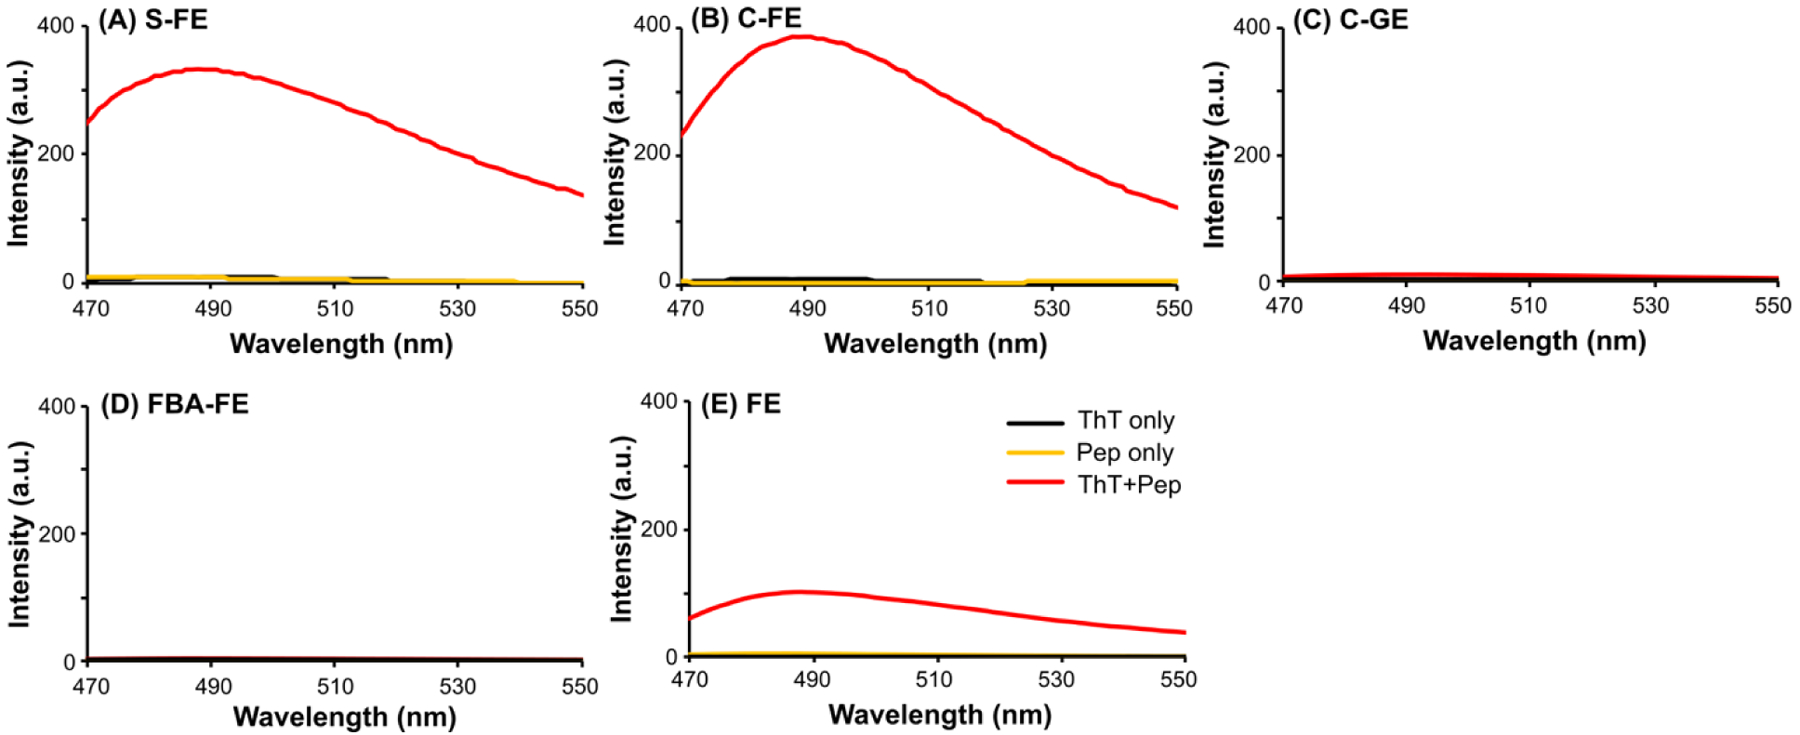
Fluorescence spectra showing thioflavin-T (ThT) assay of dipeptides (A) S-FE, (B) C-FE, (C) C-GE, (D) FBA-FE and (E) FE. Self-assembled hydrogels or solutions (36 mM) were matured for 18 h and diluted to 1 mM with 0.02 mg/mL ThT solutions. The ThT only and the peptide only solutions were prepared in H2O at 0.02 mg/mL and 1 mM, respectively. The solutions were excited at λex = 440 nm and emission spectra (λem) were collected from 470–550 nm.
Fourier-transform infrared spectroscopy.
Fourier-transform infrared spectroscopy (FTIR) was used to complement CD spectra and the ThT assay, with the goal of evaluating supramolecular structure via amide bond stretching frequency analysis. Spectra are shown in Figure 3. In D2O (used to avoid interference in the amide region by H2O) low-frequency amide I peaks ranging from 1615–1641 cm−1 are characteristic of parallel β-sheets, and higher frequency amide I peaks in the range of 1672–1694 cm−1 are characteristic of antiparallel β-sheets. Medium frequency amide I peaks are representative of random coils (1639–1654 cm−1) or α-helices (1642–1660 cm−1), which have an overlapping region.51, 52 All peptides were analyzed at 36 mM in deuterated phosphate buffer, and all except FE had absorbance peaks around 1642–1656 cm−1, suggesting possible random coils or α-helices. However, considering the CD results, these peaks are likely random coils, as all of these dipeptides showed negative ellipticity bands at 190–200 nm and no α-helical bands, which typically have a strong positive ellipticity band below 200 nm and negative bands around 207 nm and 222 nm.53 We observed a higher frequency amide I peak for FE (1672 cm−1), indicating an antiparallel β-sheet pattern in this dipeptide.
Figure 3.
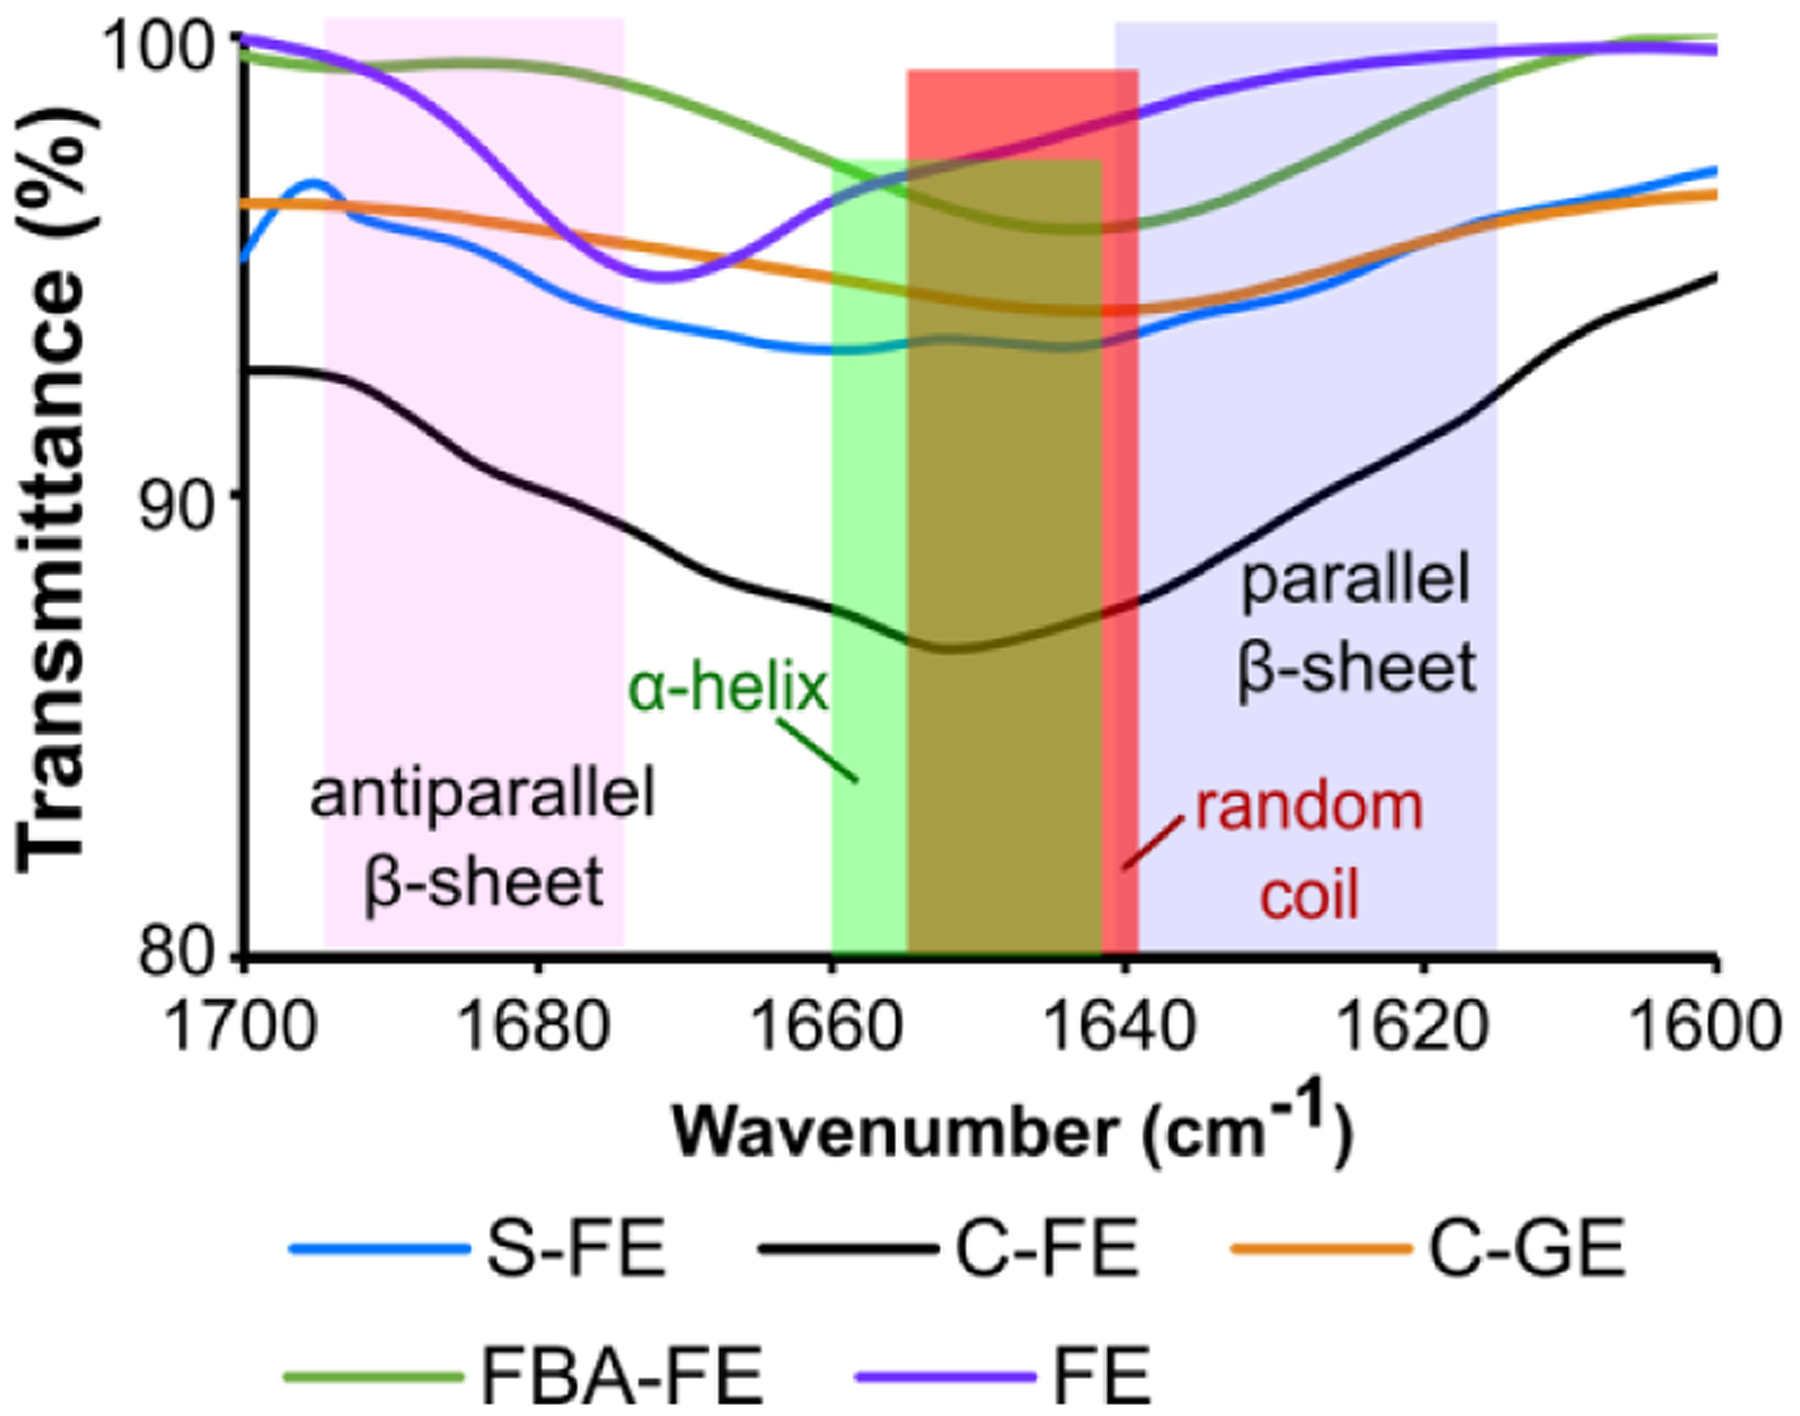
FTIR spectra of dipeptides at 36 mM in 0.05 M deuterated phosphate buffer (pD = 6.4).
Based on the combined CD, ThT, and FTIR results, the self-assembled structures of S-FE and C-FE contain both β-sheets and random coils, while FE contains anti-parallel β-sheets; C-GE and FBA-FE are dominated by random coil secondary structures.
Fluorescence spectroscopy.
Fluorescence spectroscopy was employed to evaluate the aromatic stacking of self-assembled dipeptides, exciting at 290 nm and monitoring emission from 300–530 nm (Figure 4). S-FE, C-FE, FBA-FE, and FE all exhibited redshifts when their concentrations were increased from 0.1 mM to 36 mM. The emission peak shifts of S-FE (from 316 to 382 nm), C-FE (from 356 to 376 nm), FBA-FE (from 320 to 395 nm) and FE (from 306 to 317 nm) indicated the onset of aromatic aggregation as the concentration rose above the CAC. The large redshifts for S-FE and FBA-FE (66 nm and 75 nm, respectively) suggest more displaced parallel aggregation (J-aggregation) compared with C-FE (20 nm) and FE (11 nm). No J-aggregation was observed from C-GE as the concentration change did not induce a redshift, indicating the importance of Phe for stacking. Also, the intensities of C-FE, C-GE, and FE dropped dramatically when the concentration increased, suggesting the existence of sandwich stacking conformations (H-aggregation). Taken together, these results highlight the importance of aromatic stacking in the self-assembly of these dipeptides.
Figure 4.
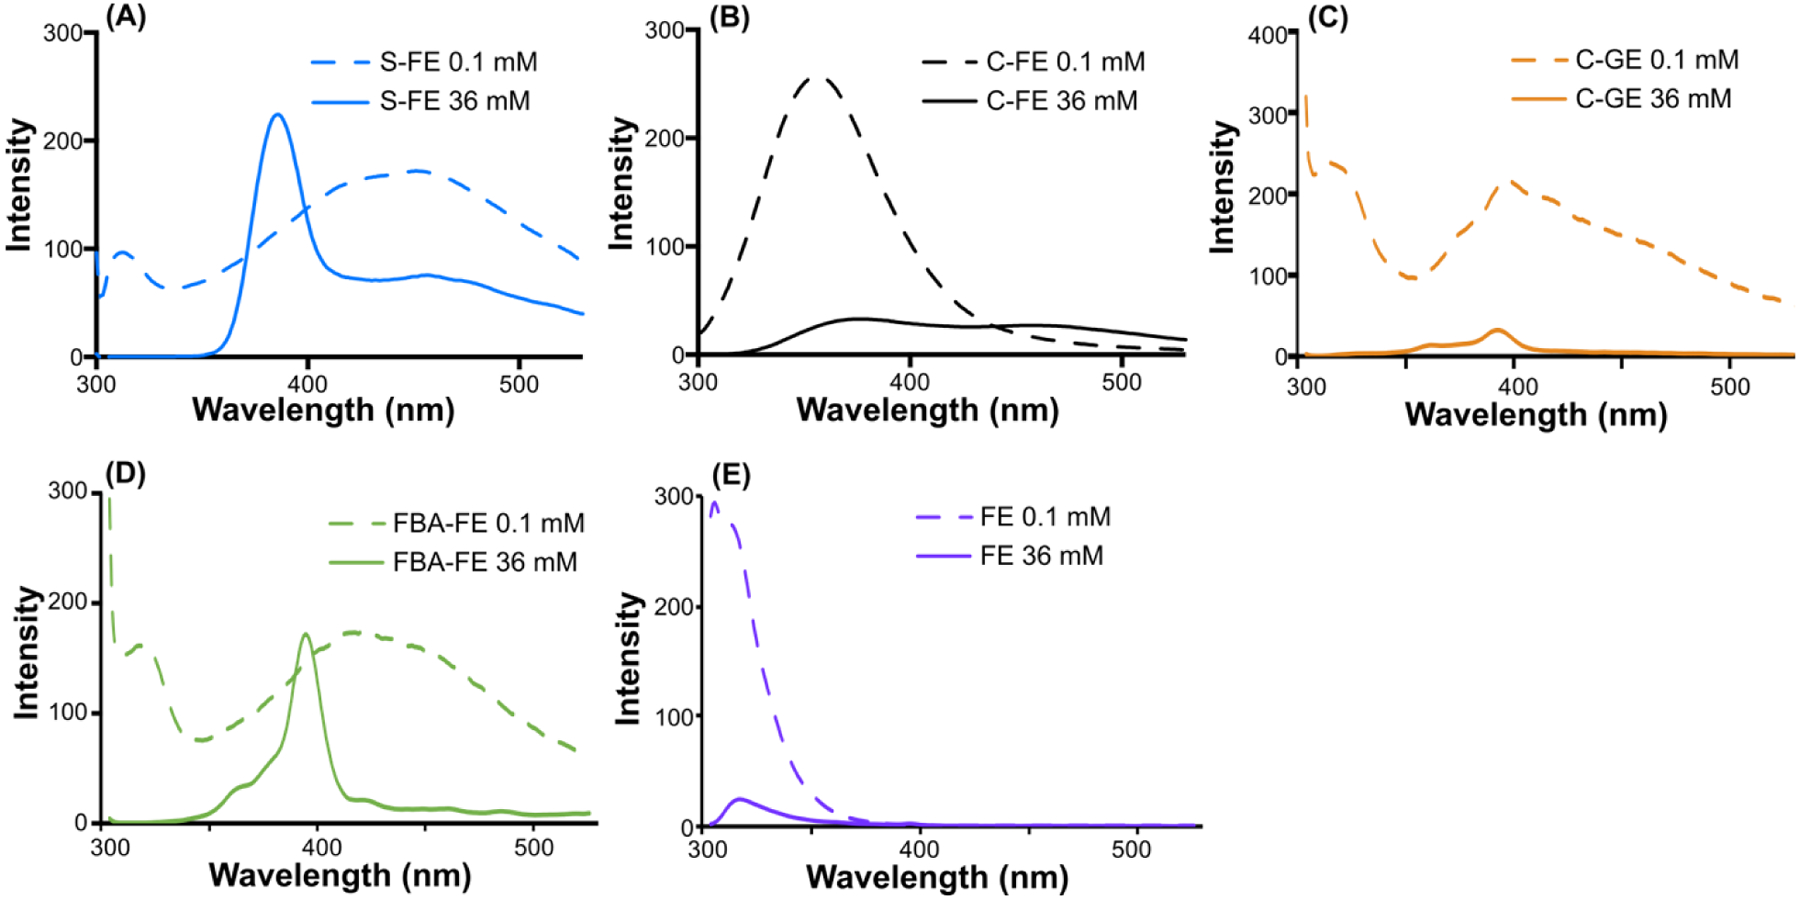
Fluorescence spectra of dipeptides (A) S-FE, (B) C-FE, (C) C-GE, (D) FBA-FE and (E) FE. Unassembled solutions and self-assembled solutions were prepared in pH 6.0 PBS buffer (1X) at 0.1 mM and 36 mM, respectively. Self-assembled samples (36 mM) were allowed to self-assemble for 2 h before analysis. All samples were excited at λex = 290 nm, and emission spectra were collected from 300–530 nm.
Rheology.
Rheological tests were used to evaluate the mechanical properties of the H2S-releasing (S-FE) and control (C-FE) hydrogels. Of particular interest were their storage moduli, shear-thinning capacity, and recoverability because we envisioned that these properties would be important in in vitro and in vivo studies. Thus, a rheology procedure was developed with two time-sweeps performed before and after a steady shear step. The two time-sweeps were used to measure the storage and loss moduli, while the steady-state shear operation in between the two time-sweeps was included to disrupt the hydrogel structure, allowing us to measure recoverability.
S-FE and C-FE had storage moduli higher than their loss moduli, indicating that robust hydrogels were formed for both dipeptides (Figure S3). In the first time-sweep, the storage moduli of S-FE and C-FE were 400±80 Pa and 700±200 Pa, respectively. When the steady shear force was applied, each hydrogel was disrupted completely, forming a liquid. After the shear stress was removed, both hydrogels quickly reformed, with storage moduli steadily increasing over the next hour. After 60 min, the storage moduli of the second time-sweep reached 500±200 Pa and 300±200 Pa for S-FE and C-FE, respectively. Although the gels did not recover their pre-stress moduli immediately, these results show that both gels shear-thin and recover their gel properties in a similar manner.
H2S detection using an H2S-sensitive electrode probe method.
The H2S release from S-FE gel was monitored using an electrode probe method. The H2S release peaking time of S-FE was 41 min, with a peaking concentration of 8.3 μM (Figure 5). The curve shape and peaking time are consistent with related peptides developed in our lab.34, 54 All control peptides, including S-FE without added Cys, showed no H2S release, as expected.
Figure 5.
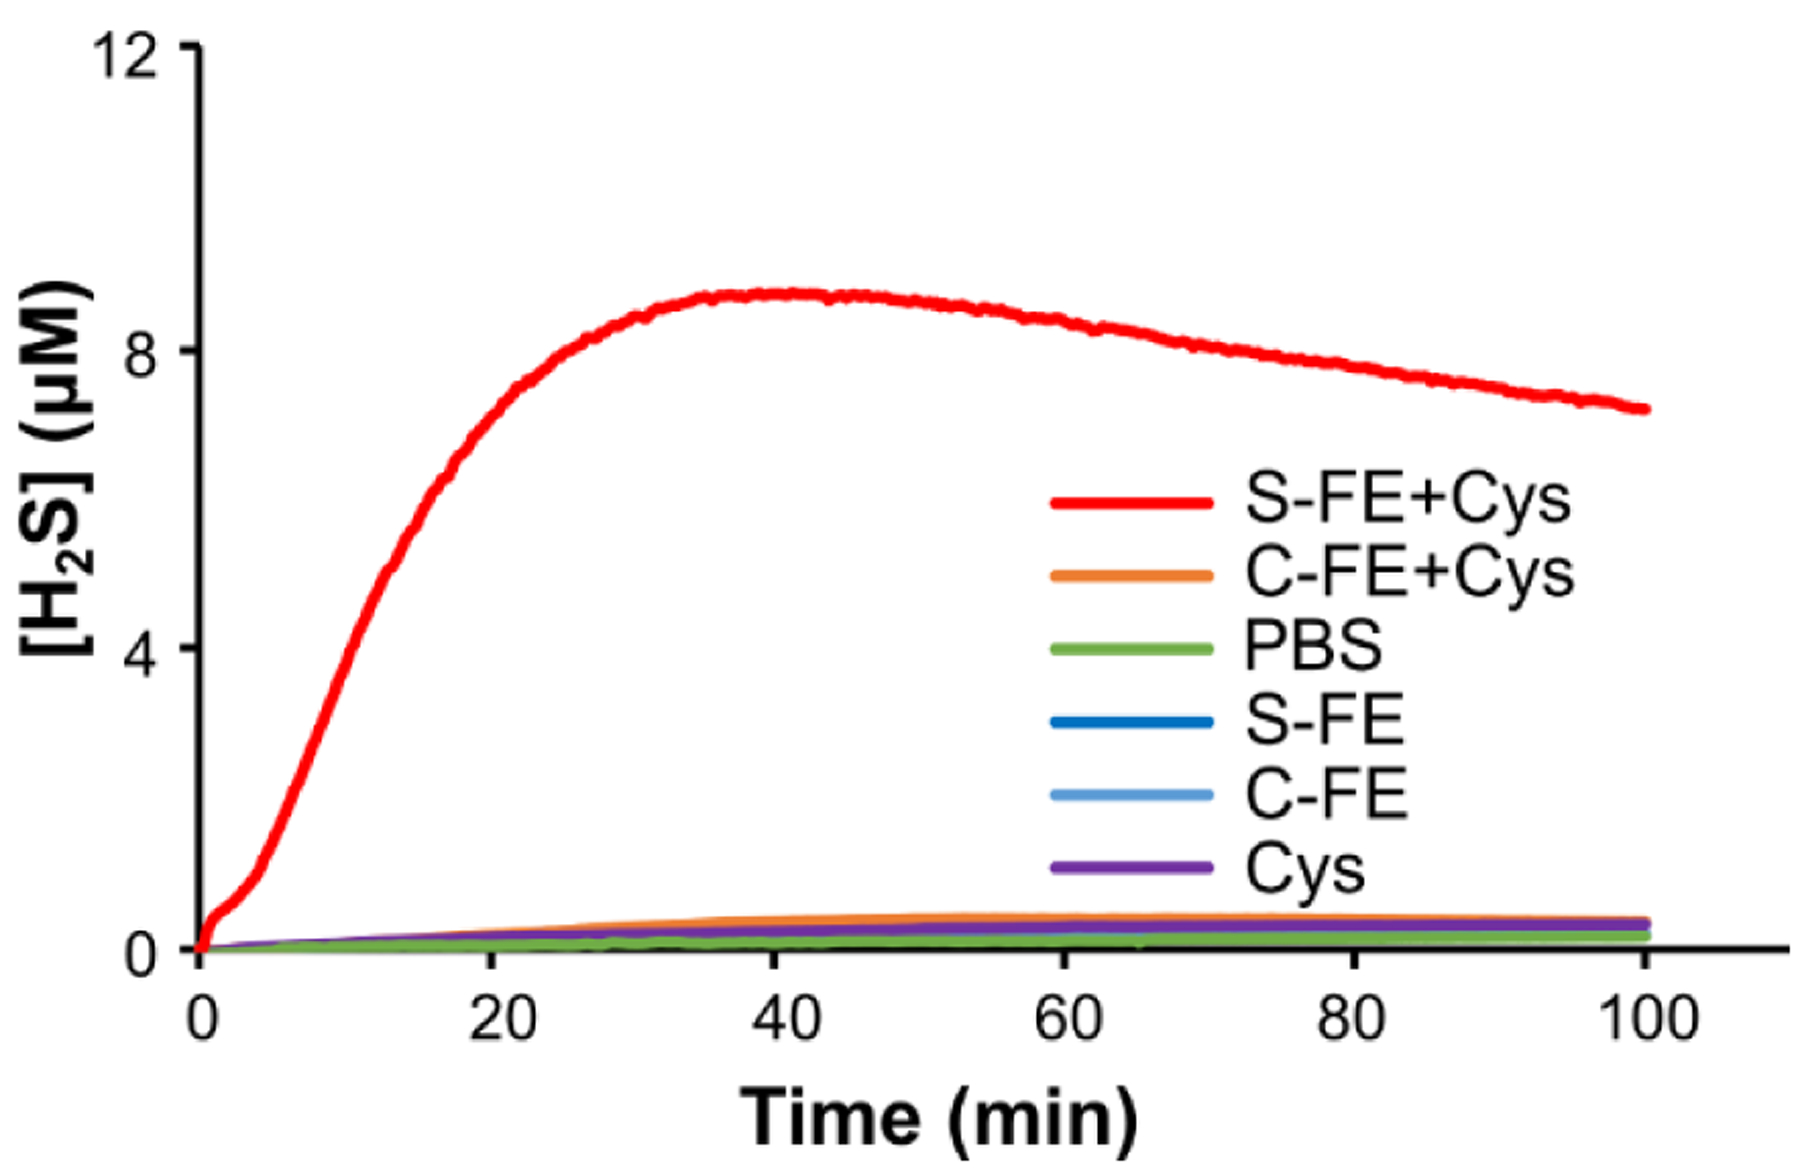
H2S release profiles of dipeptides determined by an electrode probe method.
Effect of Cys on bacterial growth.
Cys was used as the trigger to release H2S from the SATO-containing S-FE hydrogel in all studies conducted here. To determine its effect on bacterial growth, Cys was added to the bacterial culture, and the bacterial burden was quantified after 24 h. As shown in Figure S4, the Cys-supplemented bacterial culture showed significantly increased bacterial burden compared to the PBS control group, indicating that Cys enhances bacterial growth.
Effect of the H2S-releasing dipeptide hydrogel in planktonic cultures and biofilms.
The effect of the H2S-releasing hydrogel on planktonic bacterial cultures of UAMS-1 is shown in Figure 6. All treatment groups significantly decreased the bacterial burden compared to the bacteria-only group. The S-FE group showed a 97% reduction but had no significantly lower bacterial burden compared to the C-FE control gel. Both the C-GE and FE groups also had significant reductions (98–98.6%) compared to untreated bacteria, and these groups were not statistically different from the S-FE treated group. In a similar manner, the alternative S. aureus variant, Xen 29, was used to evaluate the response of planktonic bacteria to the various treatments. As shown in Figure S5A, all treatment groups had a statistically significant reduction in the growth of planktonic bacteria. In Figure S5B, there was a profound reduction of Xen 29 derived from biofilms grown from the previously treated planktonic cultures.
Figure 6.
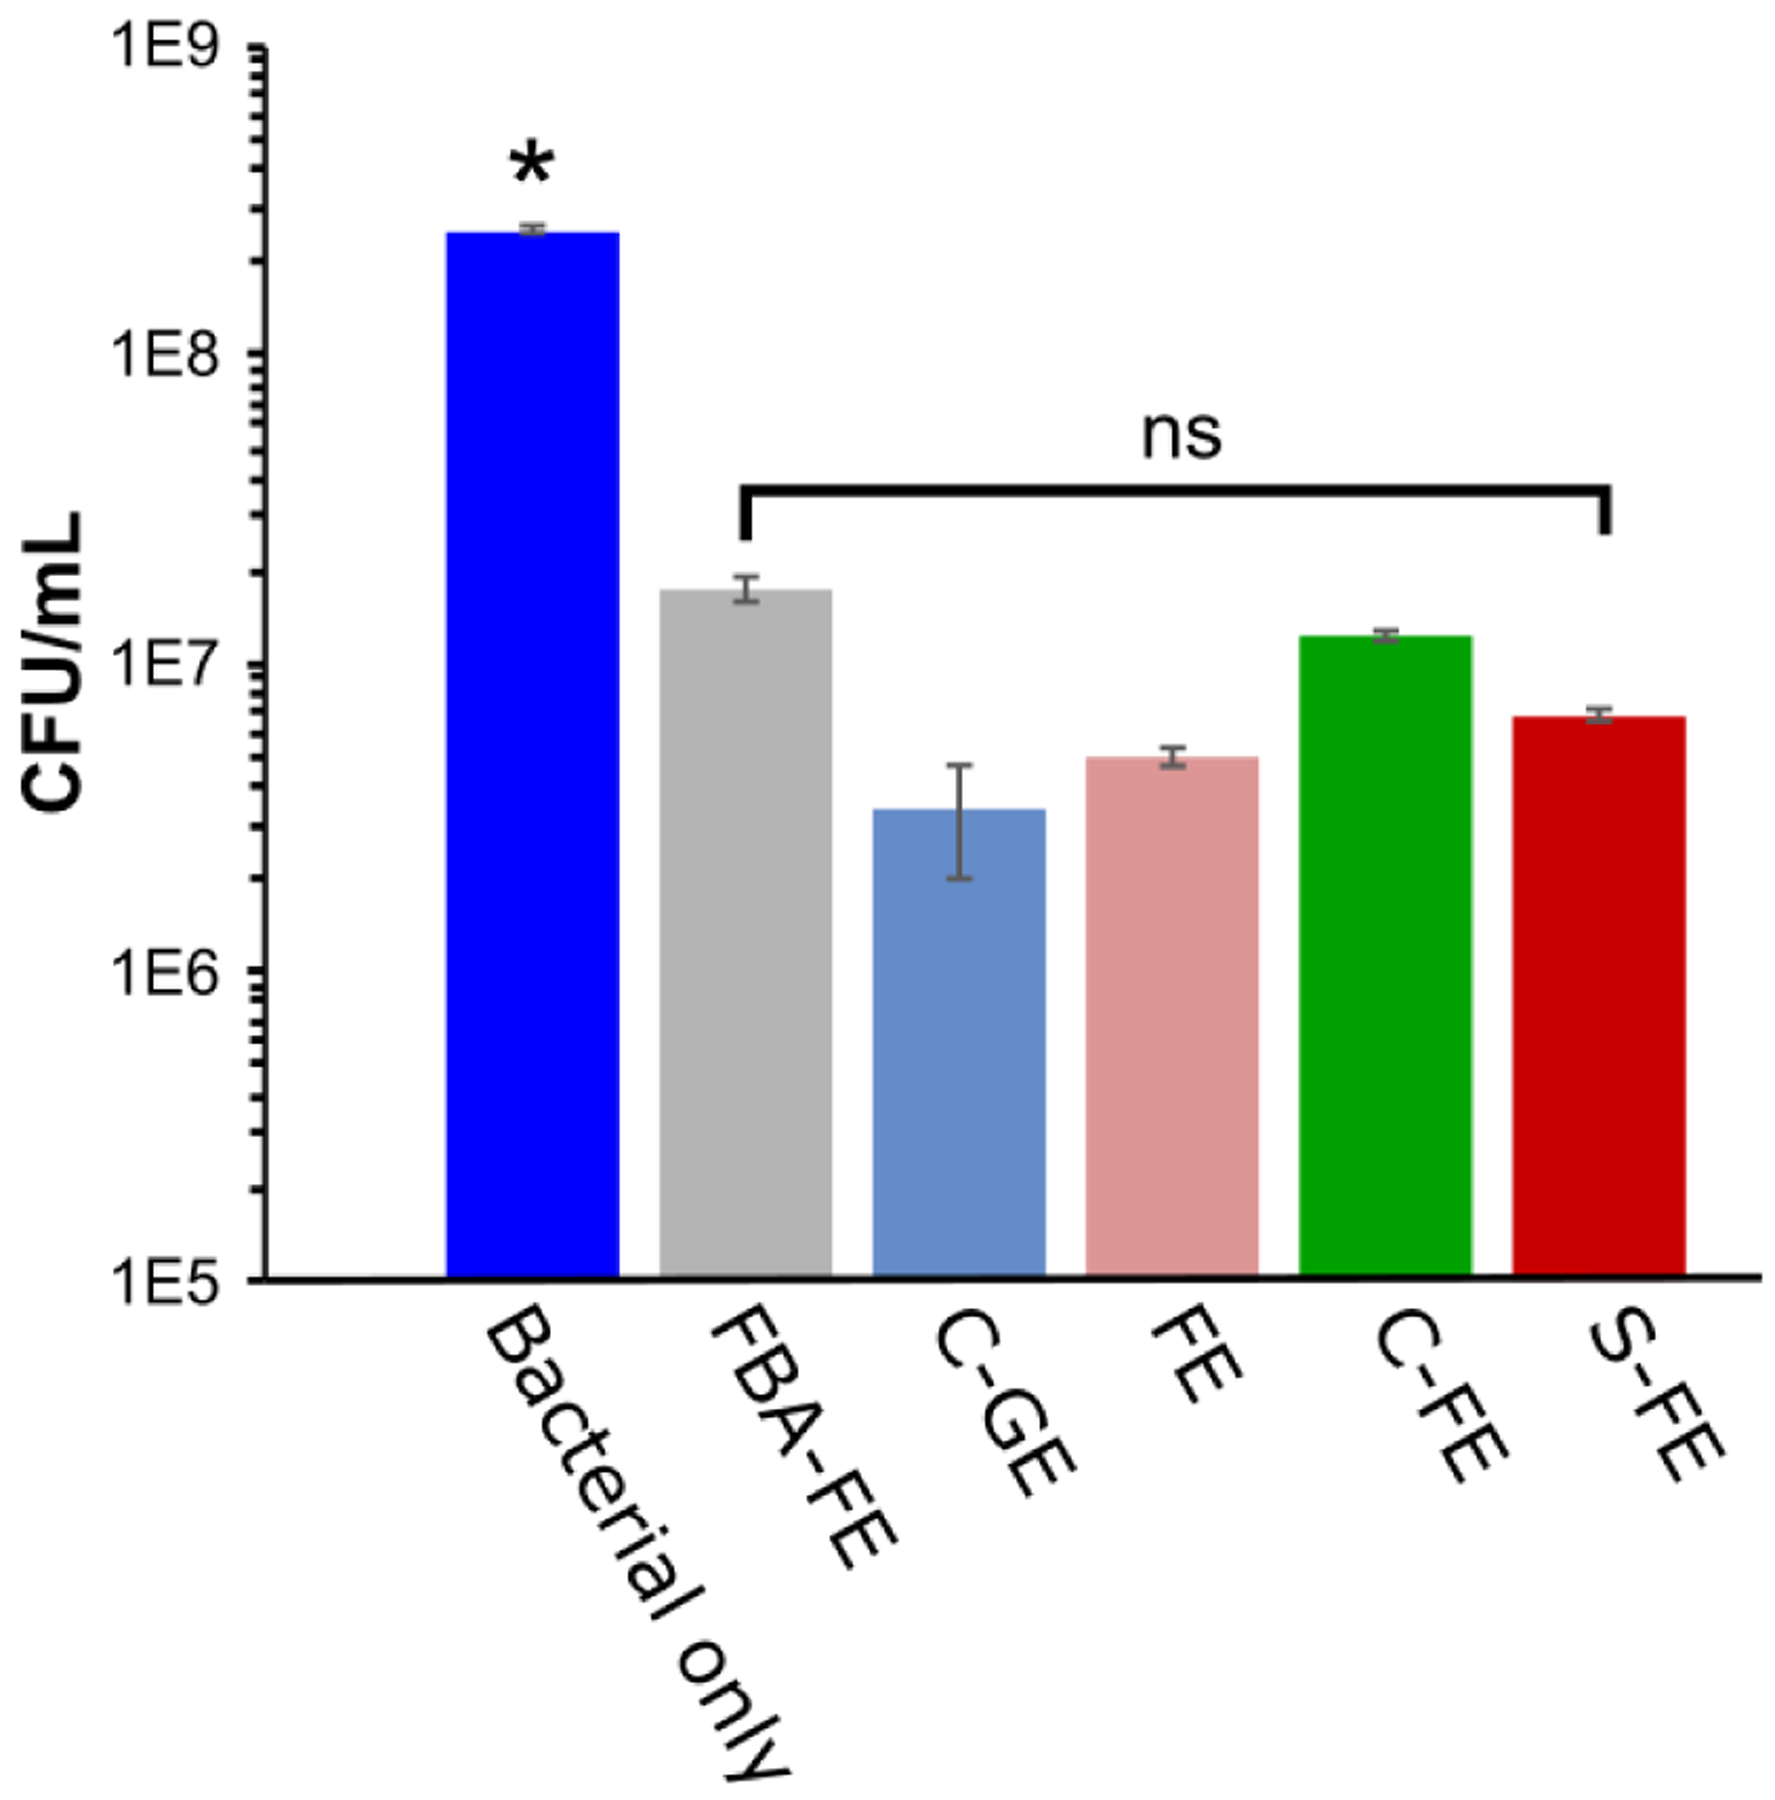
CFU/mL of UAMS-1 after treatment with dipeptides. Mean values from five replicates were presented with standard mean of error. An ANOVA and Student’s t-test were performed with n=5 and p < 0.05. * indicates p < 0.05 with respect to the five treatment groups; ns indicates no significant differences among the five treatment groups.
The potential for biofilm formation after different hydrogel treatments was evaluated using the CV assay. The remaining bacterial cultures from the planktonic dilution assay were used to develop biofilms after 48 h incubation. The biofilms were stained by CV, and their percent of biomass compared to bacteria only group are shown in Figure 7. The S-FE treated biofilms displayed the least absorption among all groups, which is indicative of less biofilm biomass. The absorption of S-FE was 66% lower compared to the bacteria-only group. However, C-FE had a 22% decrease in bacterial burden, and all other treatments (FE, FBA-FE, C-FE) showed a 6–18% decrease when compared to the bacteria-only group. These results indicate that while S-FE significantly inhibited biofilm formation, control gels had a moderate effect at preventing UAMS-1 biofilm formation.
Figure 7.
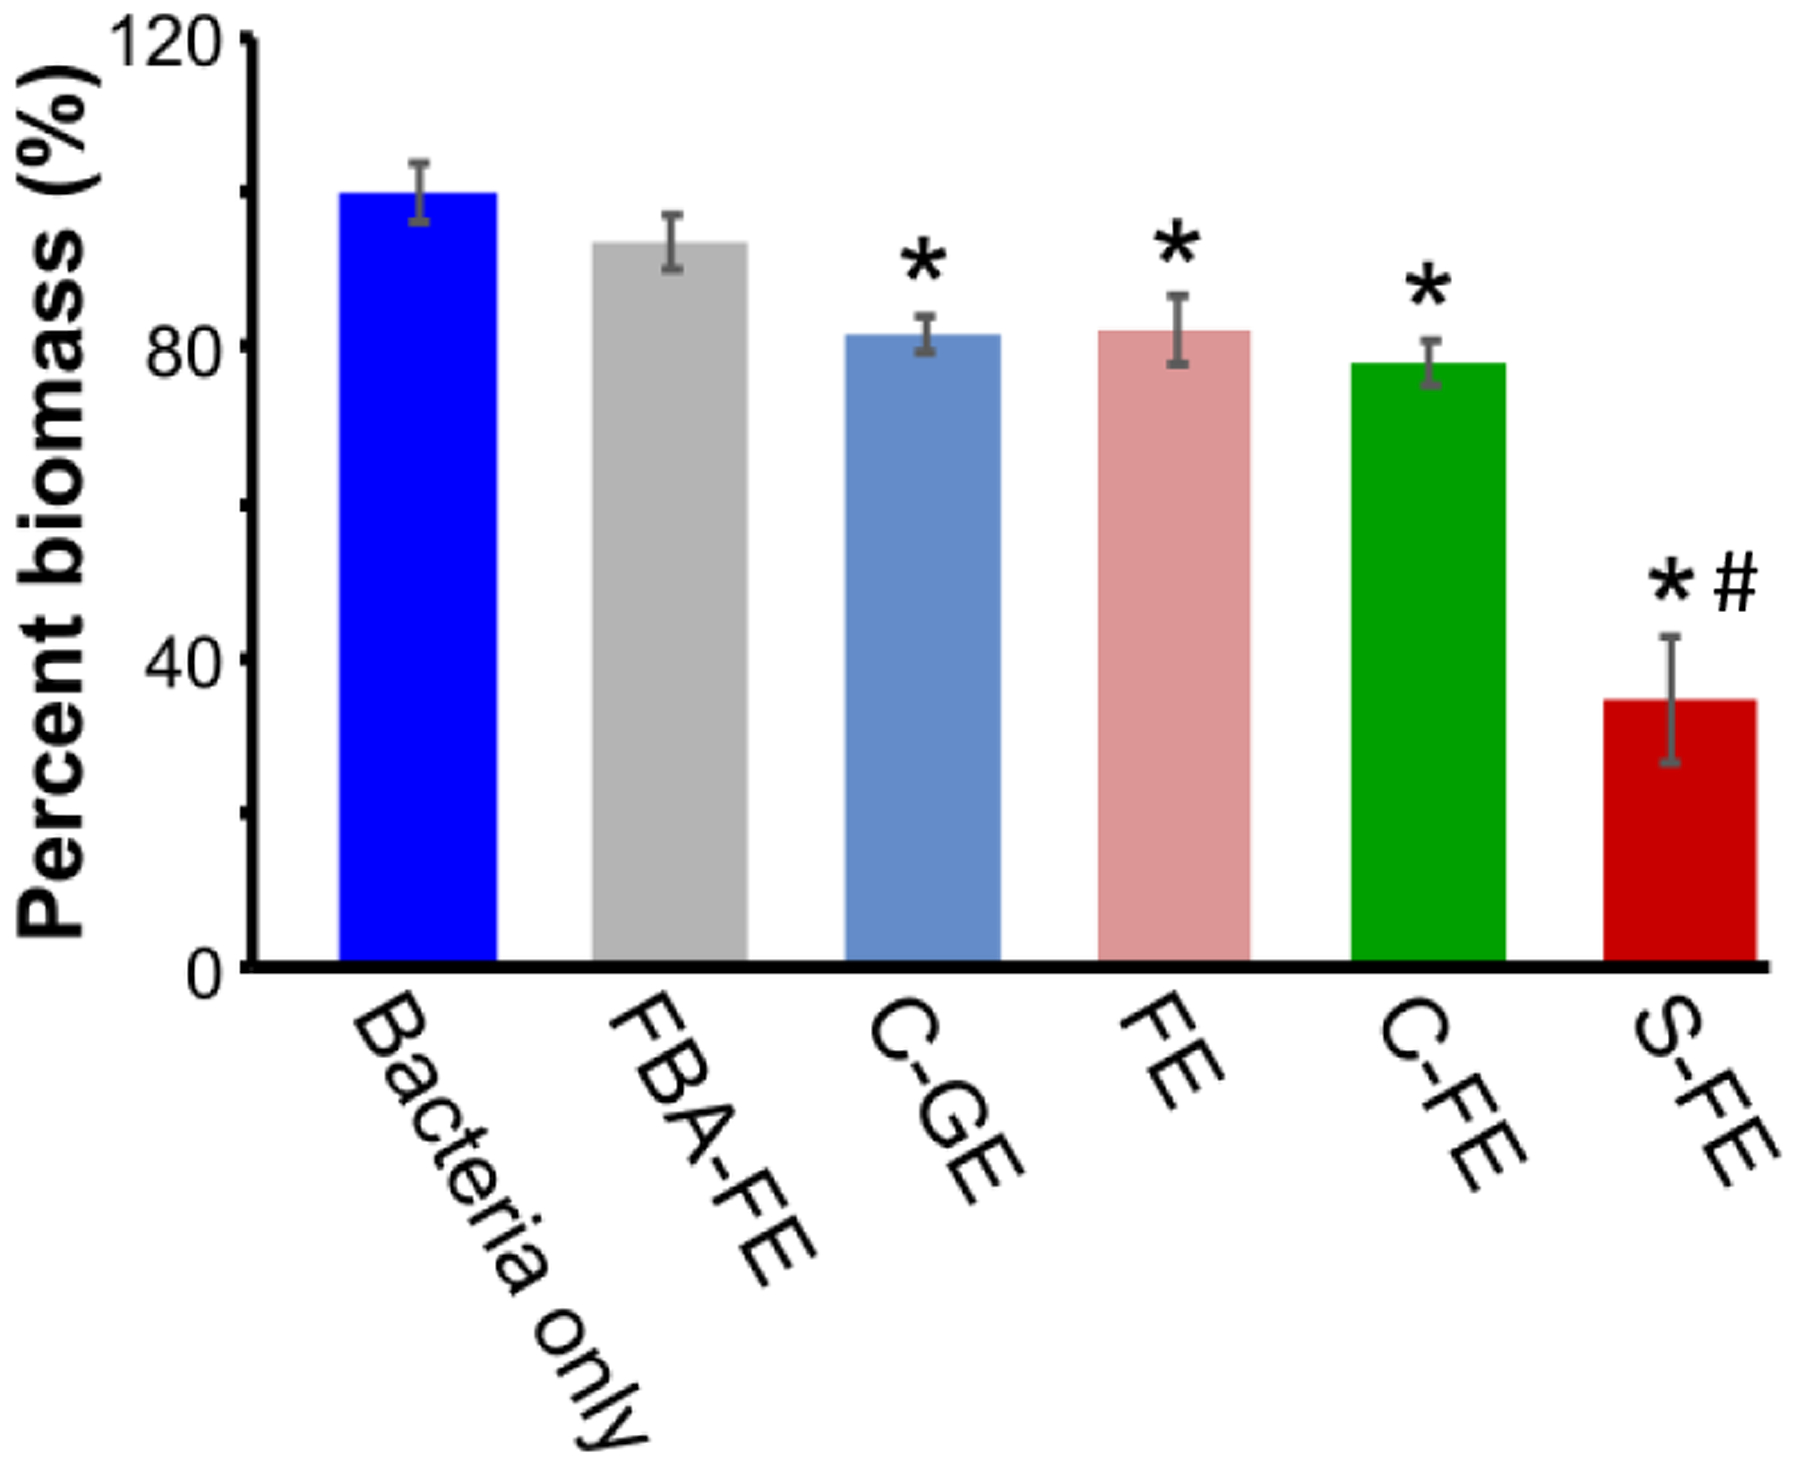
Bacterial percent biomass using CV assay after treatment with dipeptides. Percent biomass values were calculated by comparing each treatment group to the bacteria only group. Mean values from five replicates are presented with standard mean of error. An ANOVA and Student’s t-test were performed with n=5. * indicates p < 0.05 with respect to bacteria only group, # indicates p < 0.05 with respect to all other groups.
Effect of hydrogen sulfide on biofilms.
UAMS-1 was treated with the dipeptide hydrogels S-FE and C-FE prophylactically before biofilm formation, leading to significant reductions when C-FE was applied (a 39% reduction) or 57% when S-FE was applied (Figure 8A). In addition, we evaluated the S-FE gel on established biofilms, and there was a significant decrease in biomass compared to both C-FE and the bacteria only group (Figure 8B). This correlated to an 8% reduction in biomass for the S-FE treatment, compared to a 2% decrease for the C-FE, as compared to the untreated, bacteria only group. There were no significant differences between the C-FE group and the bacteria only group here, unlike in the previous assays. This corroborates the data from Figure 7 that planktonic S. aureus treated with C-FE exhibited only a slight decrease in biofilm development. The most significant result from Figure 8B is that although the S-FE has the potential to reduce biofilm biomass when used against an established biofilm, the reduction is minor. This is in stark contrast to the data in Figure 8A, where both the C-FE and S-FE could reduce the biofilm mass, indicating their potential to halt biofilm growth, with S-FE offering the greatest benefit.
Figure 8.
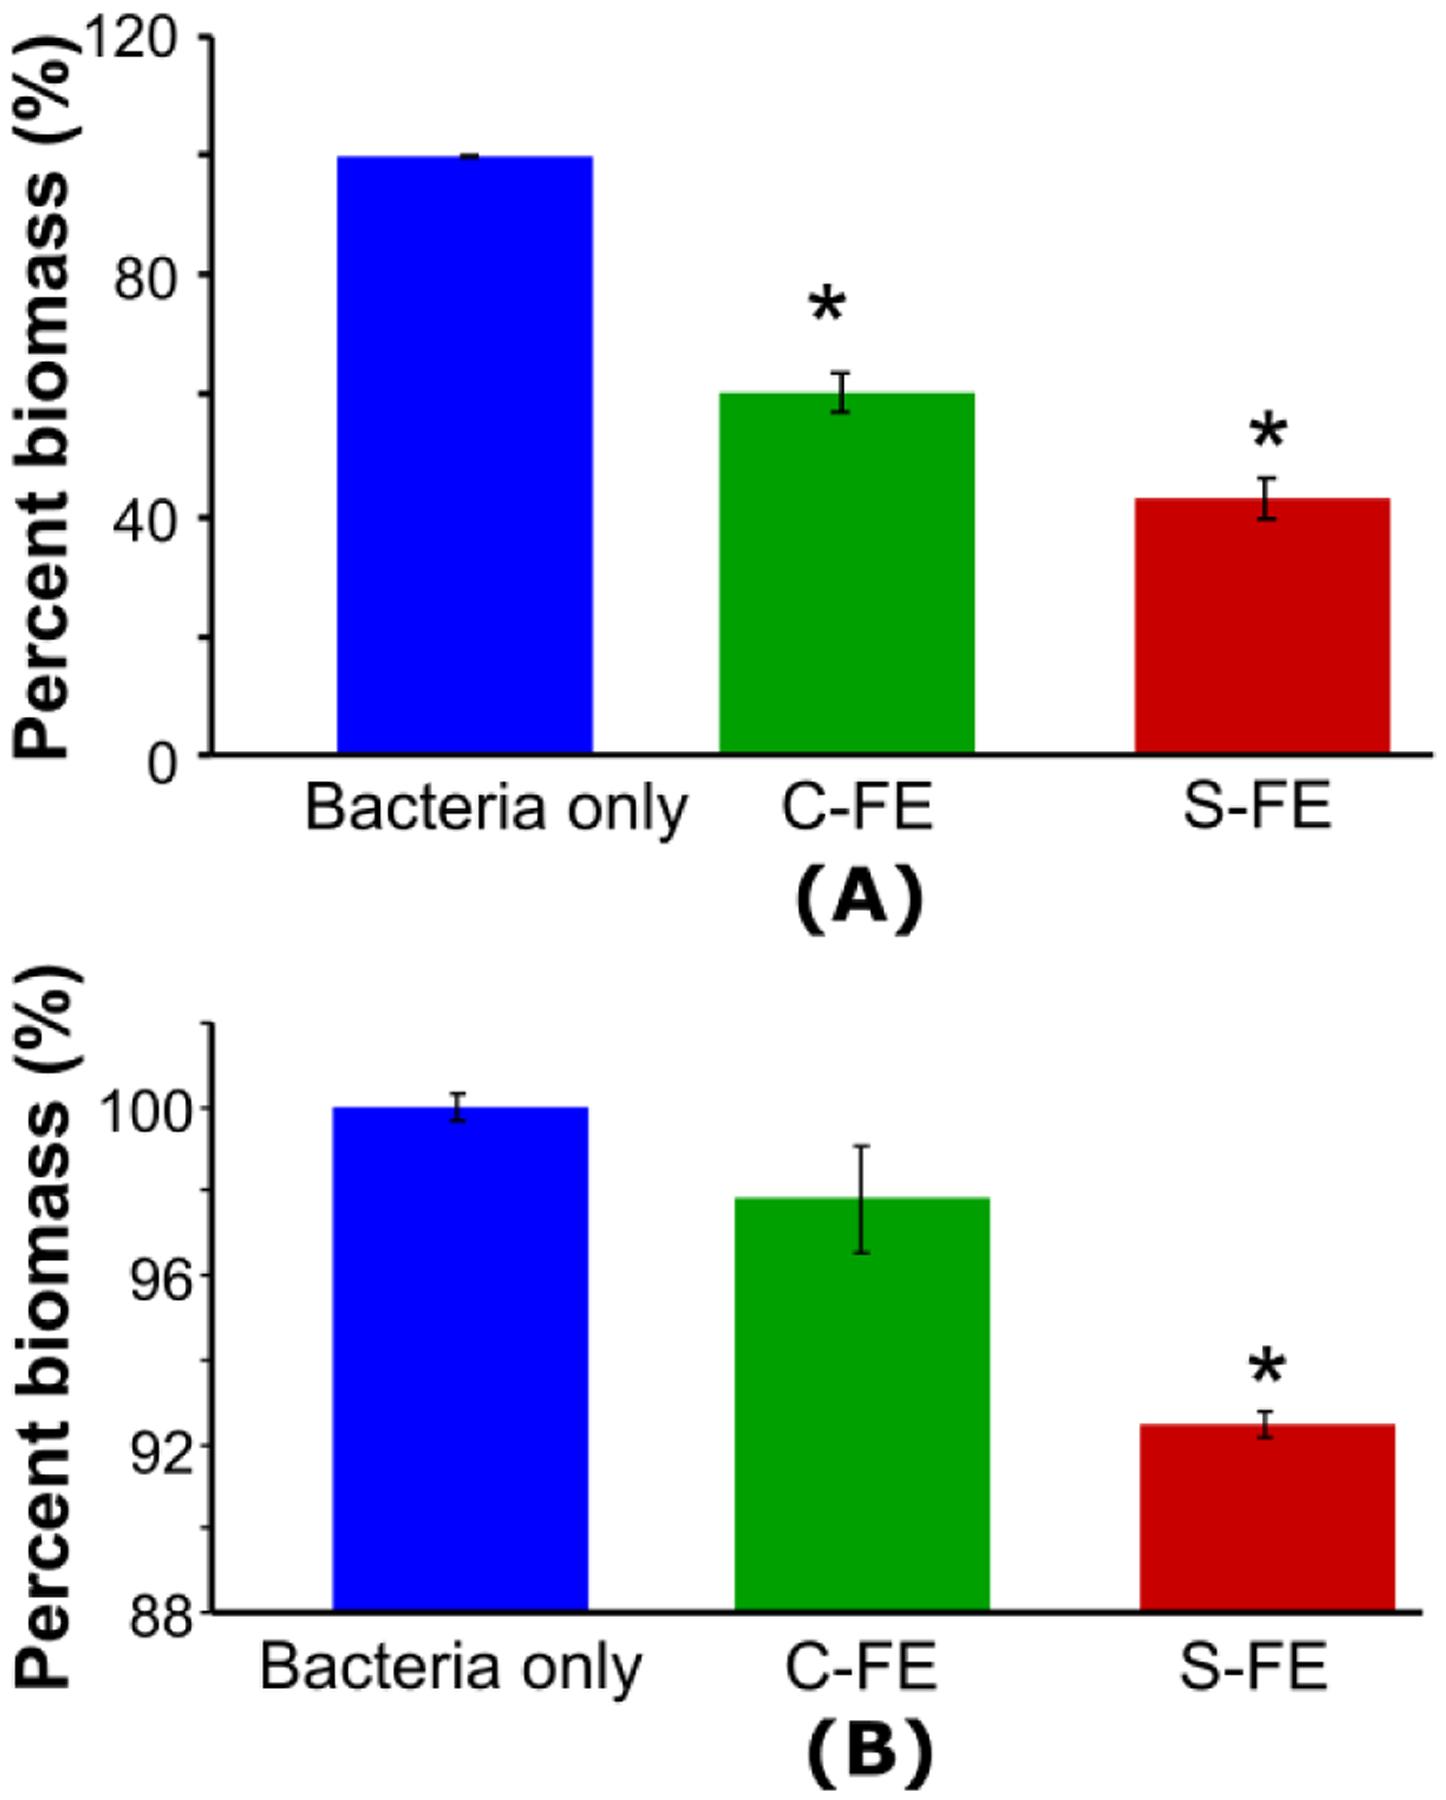
Biofilm biomass after different hydrogel treatments, as evaluated by the absorbance of biofilms after staining with CV for (A) prophylactically-treated biofilms, or (B) on established biofilms. Mean values from three replicates are presented with standard mean of error. An ANOVA and Student’s t-test were performed with n=5 and p < 0.05. * indicates a significant difference.
Scanning Electron Microscopy (SEM) imaging
SEM images of established UAMS-1 biofilms treated with PBS or C-FE hydrogel (Figure 9, left and center, respectively) displayed well rounded bacteria with a uniform lawn of growth. Biofilm treated with S-FE (Figure 9, right) also had a uniform biofilm appearance; however, higher magnification of this sample indicated that many holes were visible on the cell surface and in the biofilm. The bacteria appear to have a much rougher surface than the control samples. Biofilms grown in the presence of C-FE (Figure 10, center; prophylactic treatment) also displayed some holes throughout the sample, varying considerably from the completely smooth surface of bacteria grown with PBS (Figure 10 left), although both had uniform growth of biofilm across the observed surface. Although bacteria treated with S-FE during development had a uniform lawn appearance (Figure 10, right), they also displayed what appear to be holes and roughening of the bacterial surface. (Larger SEM images with labelled regions of interest are shown in Figures S7 and S8.)
Figure 9:
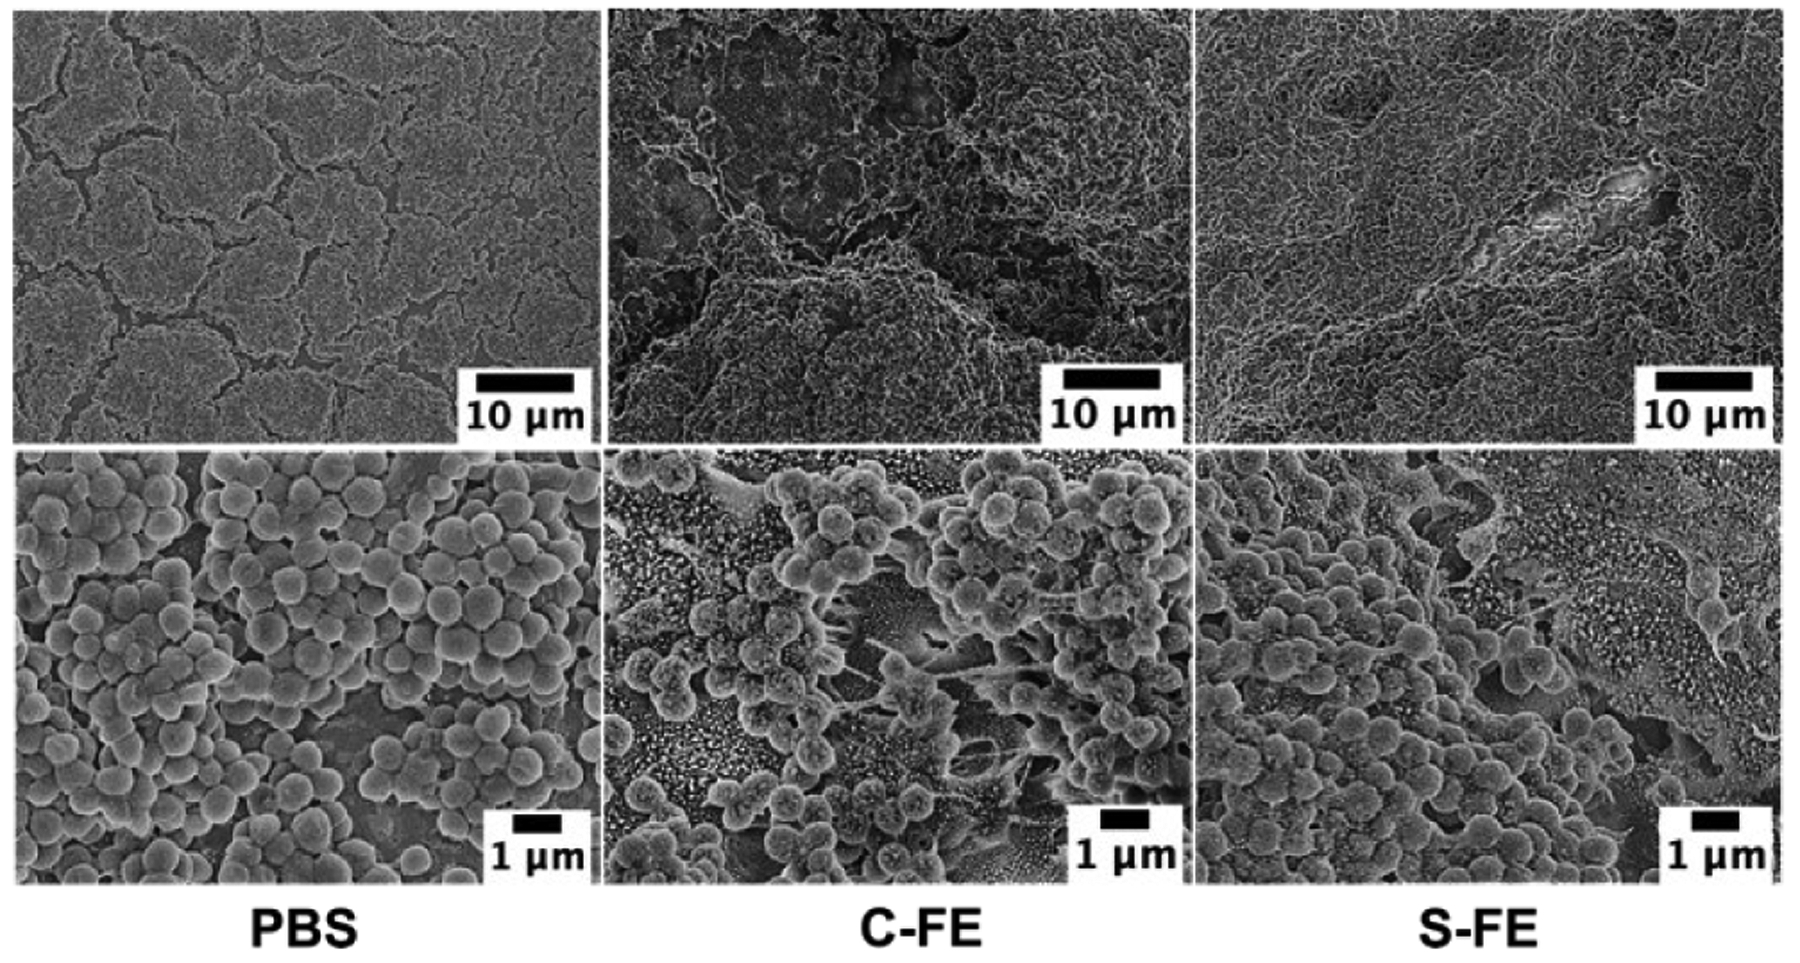
SEM of established biofilms treated with PBS, C-FE or S-FE and imaged at 2000X and 10,000X magnification. Larger images with labelled regions of interest can be seen in Figure S7.
Figure 10:
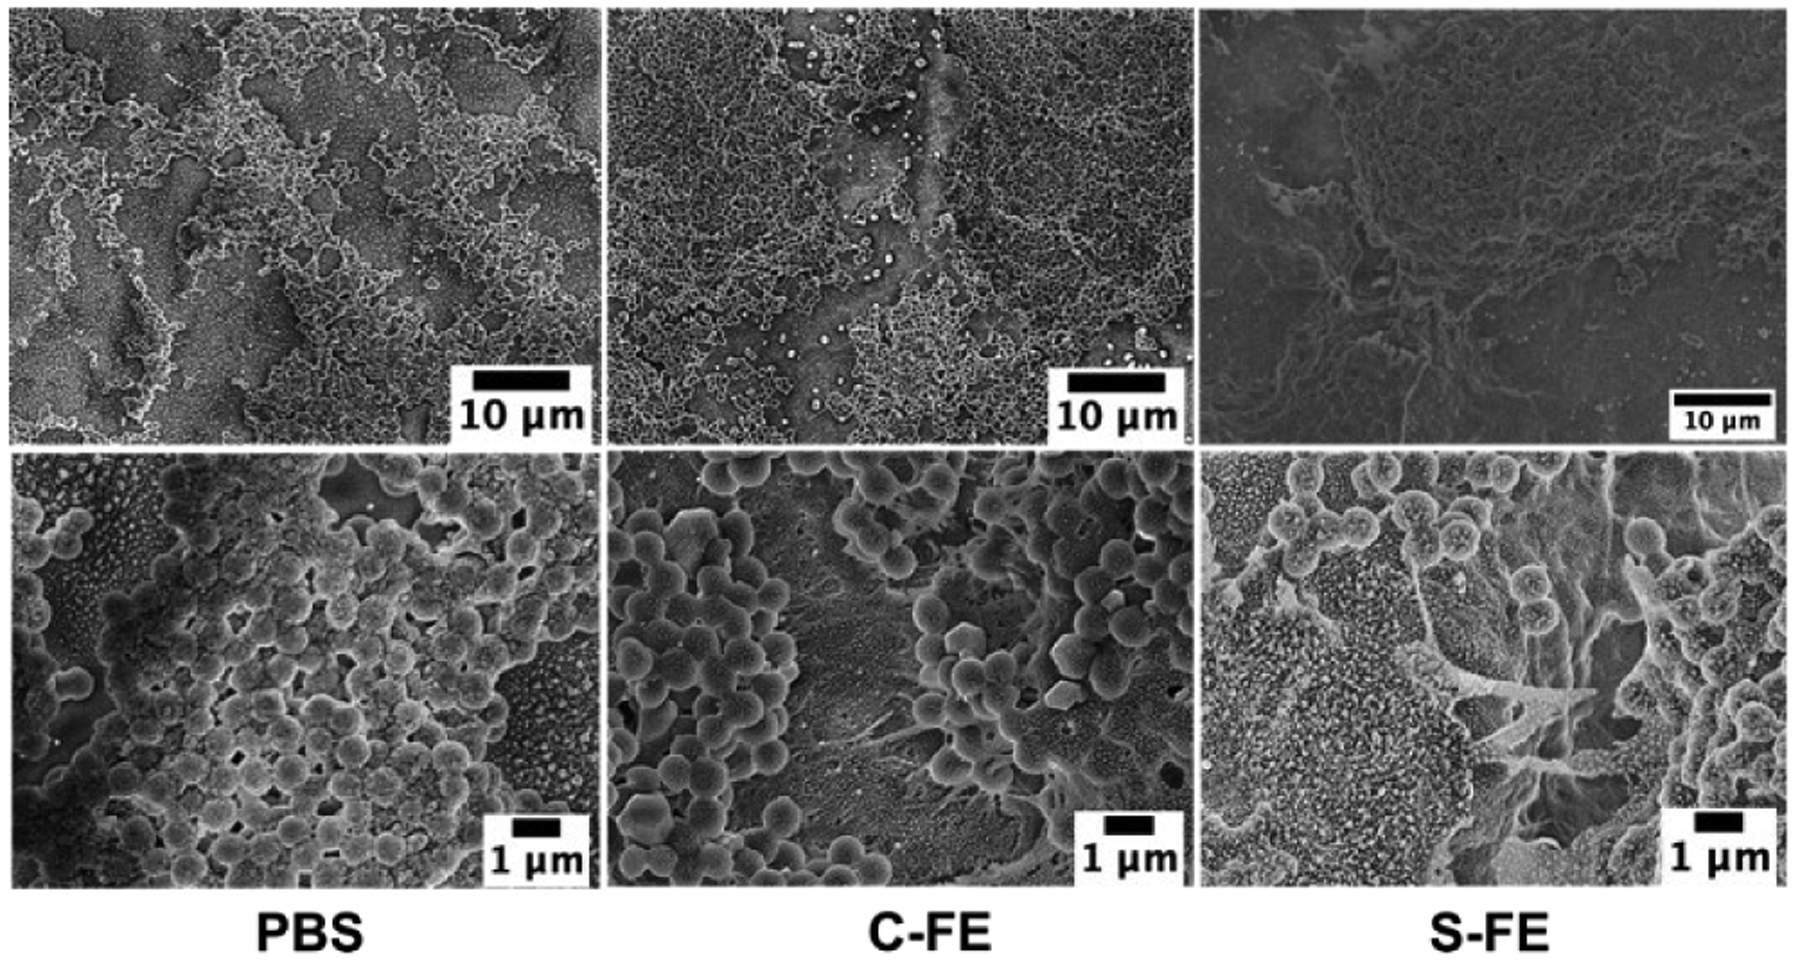
SEM of biofilms treated prophylactically with PBS, C-FE or S-FE and imaged at 2000X (top row) and 10,000X magnification (bottom row). Larger images with labelled regions of interest can be seen in Figure S8.
Confocal laser scanning microscopy (CLSM)
Confocal microscopy demonstrated that there was significant UAMS-1 viability for established biofilms treated with PBS or C-FE, as demonstrated by the dominance of green, live bacteria, as shown in Figure 11 a, b, d, and e. The S-FE-treated biofilms had a significant reduction in green, viable bacteria, as seen in Figure 11 c and f. Because there was also a minimal amount of red cells, this result suggests that there was minimal biofilm available for staining. This could be due to the S-FE gel making the biofilm more fragile and easier to disrupt from the glass surface during washing and staining steps. This result was further corroborated by the staining of the polysaccharide matrix, which is minimally present in the S-FE treated biofilm (Figure 11 i and l), as compared to the robust matrix seen for biofilms treated with C-FE or PBS. Reduced biofilm matrix was not observed when the biofilm was grown in the presence of S-FE gel (prophylactic treatment), as seen in Figure 12 i and l. Prophylactic treatment of biofilms with S-FE did not seem to inhibit the synthesis of the biofilm matrix, but it did appear to cause significant cell killing, as demonstrated by the abundance of red, dead cells in Figure 12 c and f. Biofilms treated with C-FE had more polysaccharide matrix material compared to either the S-FE- or PBS-treated samples (Figure 12 h and k), and there was substantial viability of the cells treated with C-FE compared to PBS (Figure 12 b and e compared to a and d). H2S is often thought of as a double-edged sword, because it may protect bacteria from reactive oxygen species and antibiotics in some species of bacteria, but it can improve the host’s response to the infection.18 It is not unexpected for there to be an increase in extracellular polymeric substances (EPS) due to the insult of H2S, as shown in Figure 12, part l, and this result seems to indicate that H2S may help the development of S. aureus biofilms. For clinical utility though, H2S will most likely be utilized against established biofilms, which cause the greatest challenges. From the results of Figure 11, part l, S-FE works well for reducing the extracellular polysaccharide components of an established biofilm. Additionally, sustained H2S delivery imparts a bactericidal effect in both established and developing biofilms, as indicated by the reduction of live bacteria in part f of both Figures 11 and 12.
Figure 11:
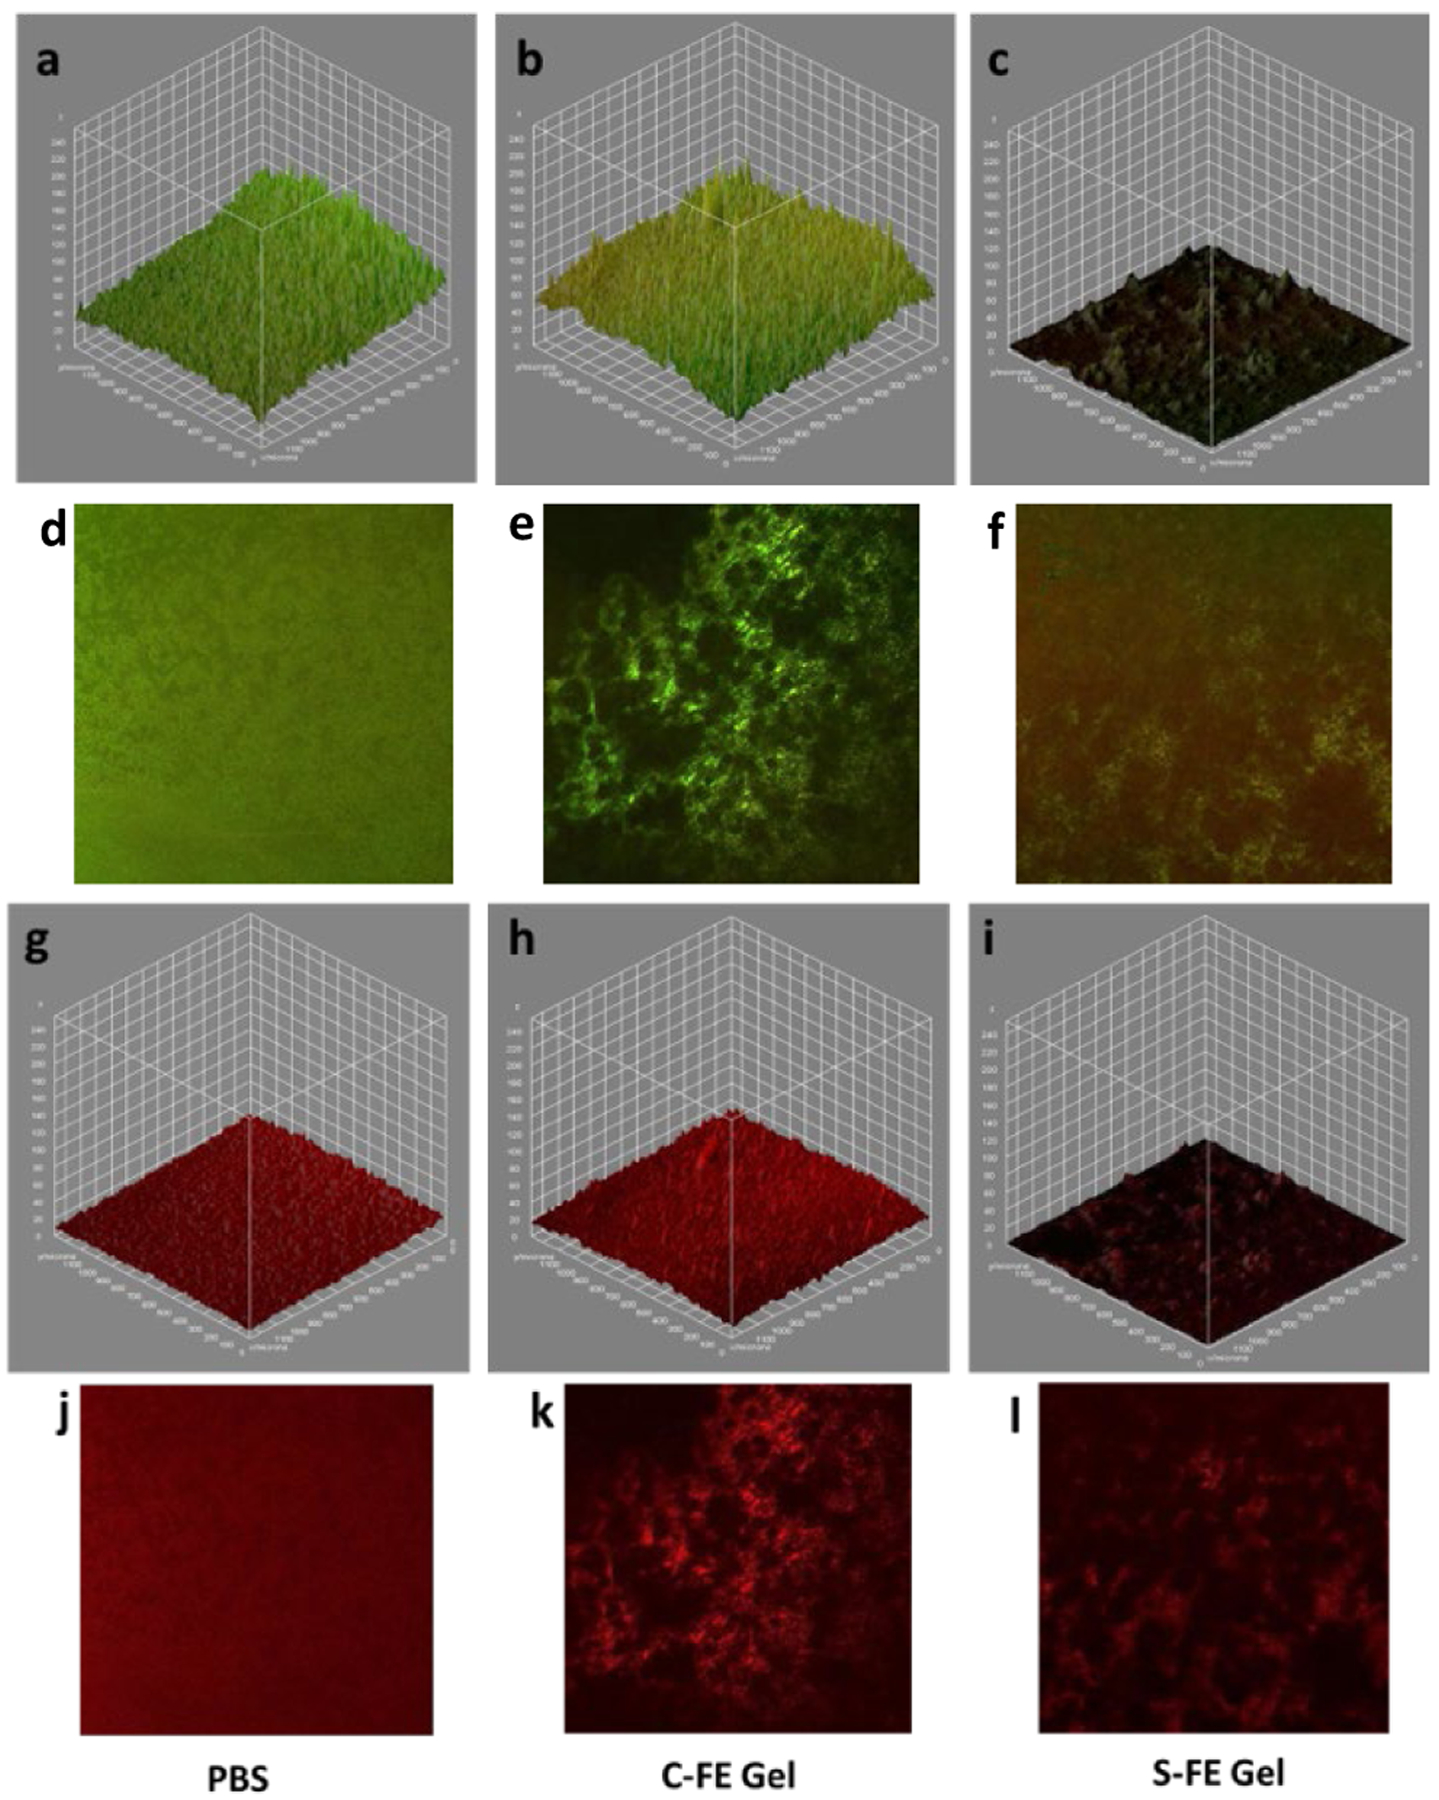
Confocal microscopy of established biofilms treated with PBS (a, d, g, j), C-FE (b, e, h, k) or S-FE (c, f, I, l). a-f are live/dead staining of UAMS-1 biofilms, with green representing live bacteria and red representing dead bacteria. a-c are volumetric representations. d-f are representative two-dimensional views. Similarly, g-I are volumetric views of biofilms stained with wheat germ agglutinin to visualize the polysaccharide matrix of the biofilms volumetrically, compared to in representative two-dimensional images (j-l).
Figure 12:
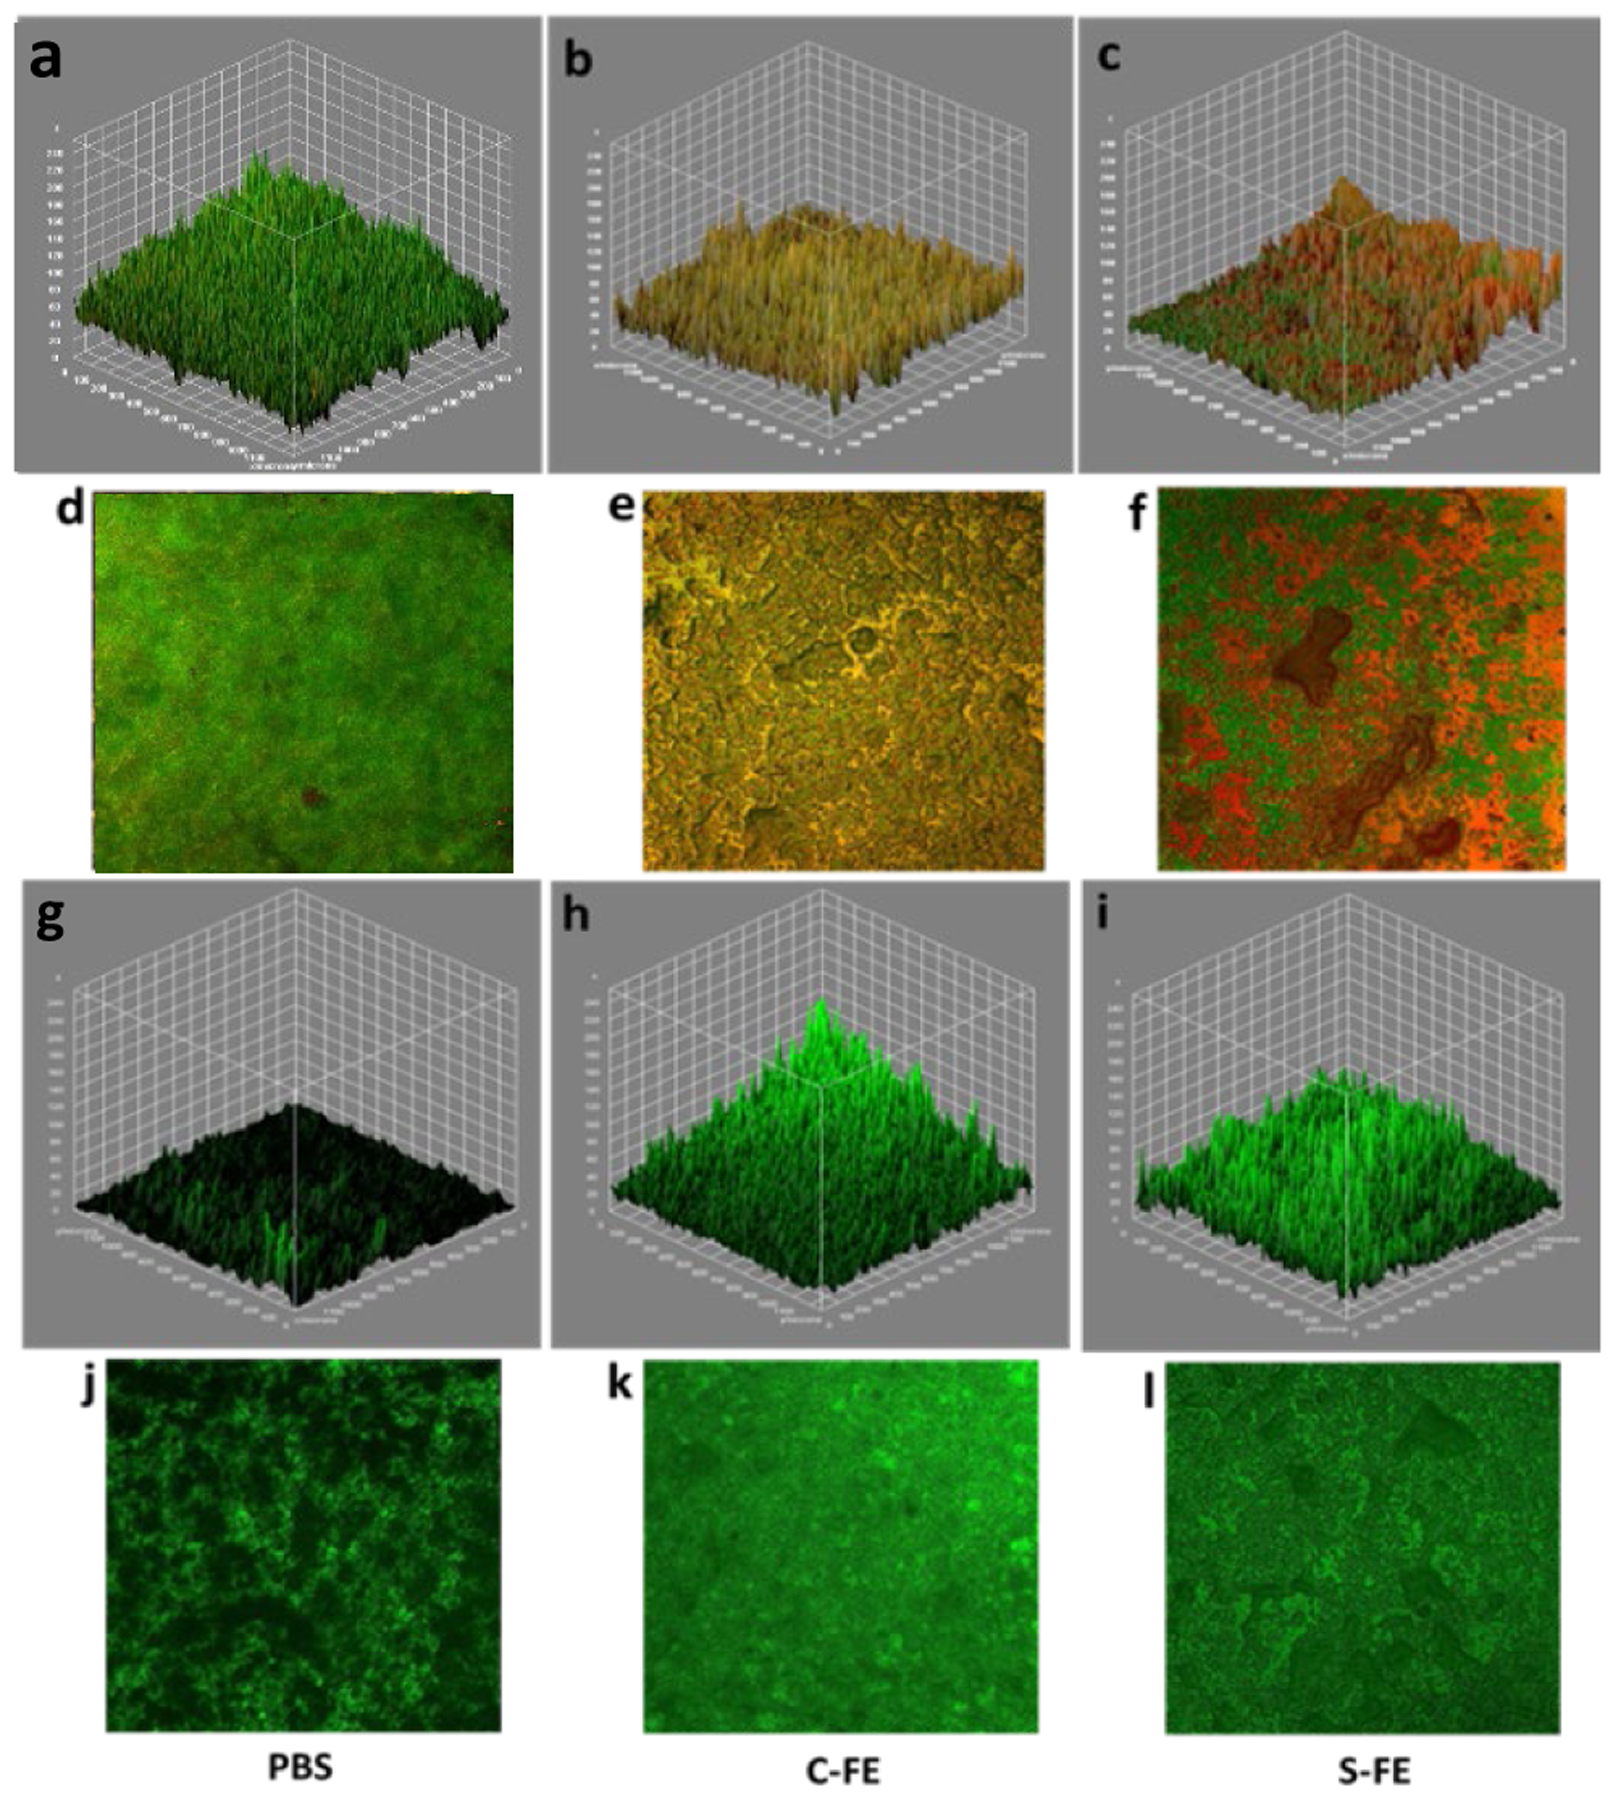
Confocal microscopy of established biofilms treated with PBS (a, d, g, j), C-FE (b, e, h, k) or S-FE (c, f, I, l). a-f are Live/Dead staining of UAMS-1 biofilms, with green representing live bacteria and red representing dead bacteria. a-c are volumetric representations. d-f are representative two-dimensional views. Similarly, g-I are volumetric views of biofilms stained with wheat germ agglutinin to visualize the polysaccharide matrix of the biofilms volumetrically, compared to in representative two-dimensional images (j-l).
3.2. Discussion
Dipeptide supramolecular structure and H2S release.
The SATO-FE dipeptide design allowed for the construction of a supramolecular, peptide-based hydrogel that releases H2S without the need for any additional components. It self-assembled in water into twisted nanoribbons, which gelled upon incubation in pH 6.0 buffer. A control dipeptide with an oxime linkage in place of the SATO group, C-FE, formed a hydrogel with similar mechanical and sheer-thinning properties. Extensive characterization of the self-assembled structures of S-FE, C-FE, and three other related dipeptides revealed that self-assembly is driven by the formation of β-sheets and aromatic stacking between SATO/benzyloxime groups and Phe residues. We observed that the S-FE hydrogel released H2S over the course of a few hours after triggering with Cys, similar to previously reported SATO peptides.34,54 As expected, no H2S release was detected from C-FE or the other control dipeptides.
Antimicrobial effects of dipeptide hydrogels.
Biofilms that form during clinical infections cause problems for wound healing. To address the problem of biofilm formation, or aid in biofilm disruption and S. aureus killing, the H2S-releasing S-FE hydrogel was explored. Significant inhibition of UAMS-1 bacteria was discovered in both planktonic and biofilm forms. In the planktonic culture assay, the sample containing S-FE eliminated 97% UAMS-1 compared to the bacteria-only group. In this experiment, C-FE and the other dipeptides also showed antimicrobial effects, suggesting antimicrobial properties derived from the peptides themselves. These results indicate the S-FE and C-FE hydrogels were able to penetrate the biofilm and inhibit bacterial activity, making them excellent candidates for treating existing biofilms as well as for prophylactic treatment. While both C-FE and S-FE inhibited bacterial activity and biofilm formation, all experiments revealed that the S-FE had superior antimicrobial effects.
The mechanisms of the antimicrobial effects of C-FE and S-FE are not yet clear, but we propose that these effects are likely related at least in part to their self-assembled structures, as antibacterial activity has been reported for other antimicrobial peptides (AMPs).55–57 For peptide hydrogels in this study, the hydrophobic components (SATO and phenylalanine) and the self-assembled β-sheet structures may facilitate attachment to bacterial membranes, causing pores and defects. It is likely that once these pores and defects are formed, ions and metabolites start to leak, and membrane respiration and functions are inhibited, leading to death of the bacteria.58 At the same time, released H2S contributes to UAMS-1 death as observed by the lower bacterial burden from S-FE than C-FE. Considering the antimicrobial results and potential wound treatment applications, S-FE gel is better than C-FE gel, as it may not only kill UAMS-1 bacteria, but also provide therapeutic effects like anti-inflammation and angiogenesis promotion, which benefit the wound healing process.
4. Conclusions
In this study, we synthesized an H2S-releasing dipeptide (S-FE), a control dipeptide that could not release H2S (C-FE), and three additional control dipeptides (C-GE, FBA-FE, and FE) as possible antimicrobial treatments for infected wounds. S-FE and C-FE both self-assembled into nanoribbons driven by both β-sheet formation and π-π stacking interactions. Upon incubation in pH 6 buffer, both dipeptides formed soft hydrogels that sheer-thinned with modulus recovery over minutes to hours. Both S-FE and C-FE showed antimicrobial effects in in vitro assays with S. aureus, with S-FE eliminating 97% of the bacterial burden. Even though both S-FE and C-FE showed inhibition of bacteria and biofilms, the S-FE hydrogel demonstrated a better antimicrobial effect in general. This material may be able to improve infection management for patients and provide adjunct therapy for bacterial infections by preventing biofilm formation.
Supplementary Material
Acknowledgments
This work was supported by the National Science Foundation (DMR-1454754), the National Institutes of Health (R01GM123508), and the Department of Plastic and Reconstructive Surgery at Wake Forest School of Medicine. We also thank the Dreyfus foundation for support of this work through a Camille Dreyfus Teacher-Scholar Award to J.B.M. We thank Prof. Charles Frazier, Dr. Ann Norris, and Prof. Tijana Grove for their help with rheology, FTIR, and fluorescence, respectively. We thank Yumeng Zhu for helping with sample preparation, and Kuljeet Kaur, Anastasia Volokohova, and Sarah Blosch for critical readings of the manuscript.
Footnotes
Electronic Supplementary Information (ESI) available. See DOI: 10.1039/x0xx00000x
Conflicts of interest
There are no conflicts to declare.
References
- 1.Liu Y, Shi L, Su L, van der Mei HC, Jutte PC, Ren Y and Busscher HJ, Chem. Soc. Rev, 2019, 48, 428–446. [DOI] [PubMed] [Google Scholar]
- 2.Donlan RM, Clin. Infect. Dis, 2001, 33, 1387–1392. [DOI] [PubMed] [Google Scholar]
- 3.Burn incidence fact sheet, https://ameriburn.org/who-we-are/media/burn-incidence-fact-sheet/, (accessed Jun 01, 2019).
- 4.National hospital ambulatory medical care survey: 2011 emergency department summary tables, https://www.cdc.gov/nchs/data/ahcd/nhamcs_emergency/2010_ed_web_tables.pdf, (accessed Jun 01, 2019).
- 5.Burns, https://www.who.int/news-room/fact-sheets/detail/burns, (accessed Dec 19, 2018, 2018).
- 6.Allegranzi B, Nejad SB, Combescure C, Graafmans W, Attar H, Donaldson L and Pittet D, Lancet, 2011, 377, 228–241. [DOI] [PubMed] [Google Scholar]
- 7.Church D, Elsayed S, Reid O, Winston B and Lindsay R, Clin. Microbiol. Rev, 2006, 19, 403–434. [DOI] [PMC free article] [PubMed] [Google Scholar]
- 8.Serra R, Grande R, Butrico L, Rossi A, Settimio UF, Caroleo B, Amato B, Gallelli L and de Franciscis S, Expert Rev. Anti. Infect. Ther, 2015, 13, 605–613. [DOI] [PubMed] [Google Scholar]
- 9.Wang R, Physiol. Rev, 2012, 92, 791–896. [DOI] [PubMed] [Google Scholar]
- 10.Mustafa AK, Gadalla MM and Snyder SH, Sci. Signal, 2009, 2, re2. [DOI] [PMC free article] [PubMed] [Google Scholar]
- 11.Katsouda A, Bibli SI, Pyriochou A, Szabo C and Papapetropoulos A, Pharmacol. Res, 2016, 113, 175–185. [DOI] [PMC free article] [PubMed] [Google Scholar]
- 12.Zhen Y, Pan W, Hu F, Wu H, Feng J, Zhang Y and Chen J, Int. J. Oncol, 2015, 46, 2194–2204. [DOI] [PubMed] [Google Scholar]
- 13.Spiller F, Orrico MIL, Nascimento DC, Czaikoski PG, Souto FO, Alves-Filho JC, Freitas A, Carlos D, Montenegro MF, Neto AF, Ferreira SH, Rossi MA, Hothersall JS, Assreuy J and Cunha FQ, Am. J. Respir. Crit. Care Med, 2010, 182, 360–368. [DOI] [PubMed] [Google Scholar]
- 14.Bhatia M, Scientifica, 2012, 2012, 159680. [DOI] [PMC free article] [PubMed] [Google Scholar]
- 15.Wallace JL, Blackler RW, Chan MV, Da Silva GJ, Elsheikh W, Flannigan KL, Gamaniek I, Manko A, Wang L, Motta JP and Buret AG, Antioxid. Redox Signal, 2015, 22, 398–410. [DOI] [PubMed] [Google Scholar]
- 16.Papapetropoulos A, Pyriochou A, Altaany Z, Yang G, Marazioti A, Zhou Z, Jeschke MG, Branski LK, Herndon DN and Wang R, Proc. Natl. Acad. Sci. U.S.A, 2009, 106, 21972–21977. [DOI] [PMC free article] [PubMed] [Google Scholar]
- 17.Dal-Secco D, Cunha TM, Freitas A, Alves JC, Souto FO, Fukada SY, Grespan R, Alencar NMN, Neto AF, Rossi MA, Ferreira SH, Hothersall JS and Cunha FQ, J. Immunol, 2008, 181, 4287–4298. [DOI] [PubMed] [Google Scholar]
- 18.Shatalin K, Shatalina E, Mironov A and Nudler E, Science, 2011, 334, 986–990. [DOI] [PubMed] [Google Scholar]
- 19.Peng H, Zhang Y, Palmer LD, Kehl-Fie TE, Skaar EP, Trinidad JC and Giedroc DP, ACS Infect. Dis, 2017, 3, 744–755. [DOI] [PMC free article] [PubMed] [Google Scholar]
- 20.Peng H, Shen J, Edmonds KA, Luebke JL, Hickey AK, Palmer LD, Chang F-MJ, Bruce KA, Kehl-Fie TE and Skaar EP, MSphere, 2017, 2, e00082–00017. [DOI] [PMC free article] [PubMed] [Google Scholar]
- 21.Zeng J, Lin X, Fan H and Li C, Mol. Med. Rep, 2013, 8, 1204–1208. [DOI] [PubMed] [Google Scholar]
- 22.Zhang J, Sio SW, Moochhala S and Bhatia M, Mol. Med, 2010, 16, 417–424. [DOI] [PMC free article] [PubMed] [Google Scholar]
- 23.Esechie A, Enkhbaatar P, Traber DL, Jonkam C, Lange M, Hamahata A, Djukom C, Whorton EB, Hawkins HK, Traber LD and Szabo C, Br. J. Pharmacol, 2009, 158, 1442–1453. [DOI] [PMC free article] [PubMed] [Google Scholar]
- 24.Urquhart MC, Ercole F, Whittaker MR, Boyd BJ, Davis TP and Quinn JF, Polym. Chem, 2018, 9, 4431–4439. [Google Scholar]
- 25.Powell CR, Dillon KM and Matson JB, Biochem. Pharmacol, 2018, 149, 110–123. [DOI] [PMC free article] [PubMed] [Google Scholar]
- 26.Zheng YQ, Yu BC, De La Cruz LK, Choudhury MR, Anifowose A and Wang BH, Med. Res. Rev, 2018, 38, 57–100. [DOI] [PubMed] [Google Scholar]
- 27.Qian Y and Matson JB, Adv. Drug Deliv. Rev, 2016, 110–111, 137–156. [DOI] [PubMed] [Google Scholar]
- 28.Zhang H, Zhi L, Moore PK and Bhatia M, Am. J. Physiol. Lung Cell Mol. Physiol, 2006, 290, L1193–L1201. [DOI] [PubMed] [Google Scholar]
- 29.Qu K, Chen CP, Halliwell B, Moore PK and Wong PT, Stroke, 2006, 37, 889–893. [DOI] [PubMed] [Google Scholar]
- 30.Matson JB, Zha RH and Stupp SI, Curr. Opin. Solid State Mater. Sci, 2011, 15, 225–235. [DOI] [PMC free article] [PubMed] [Google Scholar]
- 31.Foster JC, Powell CR, Radzinski SC and Matson JB, Org. Lett, 2014, 16, 1558–1561. [DOI] [PubMed] [Google Scholar]
- 32.Kaur K, Qian Y, Gandour RD and Matson JB, J. Org. Chem, 2018, 83, 13363–13369. [DOI] [PMC free article] [PubMed] [Google Scholar]
- 33.Carter JM, Qian Y, Foster JC and Matson JB, Chem. Commun, 2015, 51, 13131–13134. [DOI] [PubMed] [Google Scholar]
- 34.Qian Y, Kaur K, Foster JC and Matson JB, Biomacromolecules, 2019, 20, 1077–1086. [DOI] [PMC free article] [PubMed] [Google Scholar]
- 35.Wang Y, Kaur K, Scannelli SJ, Bitton R and Matson JB, J. Am. Chem. Soc, 2018, 140, 14945–14951. [DOI] [PMC free article] [PubMed] [Google Scholar]
- 36.Wang Y and Matson JB, ACS Appl. Bio. Mater, 2019, 2, 5093–5098. [DOI] [PMC free article] [PubMed] [Google Scholar]
- 37.Zhou M, Qian Y, Zhu Y and Matson J, Chem. Comm, 2020, 56, 1085–1088. [DOI] [PMC free article] [PubMed] [Google Scholar]
- 38.Longchamp A, Kaur K, Macabrey D, Dubuis C, Corpataux JM, Deglise S, Matson JB and Allagnat F, Acta Biomater, 2019, 97, 374–384. [DOI] [PMC free article] [PubMed] [Google Scholar]
- 39.Kaur K, Qian Y and Matson JB, in Biomaterials for Tissue Engineering, Springer, 2018, pp. 193–208. [Google Scholar]
- 40.Xu Z, Liang Y, Lin S, Chen D, Li B, Li L and Deng Y, Curr. Microbiol, 2016, 73, 474–482. [DOI] [PubMed] [Google Scholar]
- 41.Walker JN and Horswill AR, Front. Cell. and Infect. Microbiol, 2012, 2, 39. [DOI] [PMC free article] [PubMed] [Google Scholar]
- 42.Fratesi SE, Lynch FL, Kirkland BL and Brown LR, J. Sediment. Res, 2004, 74, 858–867. [Google Scholar]
- 43.Tawakoli PN, Al-Ahmad A, Hoth-Hannig W, Hannig M and Hannig C, Clin. Oral Invest, 2013, 17, 841–850. [DOI] [PubMed] [Google Scholar]
- 44.Srikantha T, Daniels KJ, Pujol C, Kim E, and Scoll DR. Eukaryot. Cell, 2013, 12, 875–888. [DOI] [PMC free article] [PubMed] [Google Scholar]
- 45.Skogman ME, Vuorela PM and Fallarero A, J. Antibiot, 2012, 65, 453–459. [DOI] [PubMed] [Google Scholar]
- 46.Greenfield NJ, Nat. Protoc, 2006, 1, 2876–2890. [DOI] [PMC free article] [PubMed] [Google Scholar]
- 47.Reches M and Gazit E, Isr. J. Chem, 2005, 45, 363–371. [Google Scholar]
- 48.Shlomo Z, Vinod TP, Jelinek R and Rapaport H, Chem. Commun, 2015, 51, 3154–3157. [DOI] [PubMed] [Google Scholar]
- 49.Pappas CG, Abul-Haija YM, Flack A, Frederix PWJM and Ulijn RV, Chem. Commun, 2014, 50, 10630–10633. [DOI] [PubMed] [Google Scholar]
- 50.Khurana R, Coleman C, Ionescu-Zanetti C, Carter SA, Krishna V, Grover RK, Roy R and Singh S, J. Struct. Biol, 2005, 151, 229–238. [DOI] [PubMed] [Google Scholar]
- 51.Abul-Haija YM and Ulijn RV, Biomacromolecules, 2015, 16, 3473–3479. [DOI] [PubMed] [Google Scholar]
- 52.Kong J and Yu S, Acta Biochim. Biophys. Sin, 2007, 39, 549–559. [DOI] [PubMed] [Google Scholar]
- 53.Toniolo C, Polese A, Formaggio F, Crisma M and Kamphuis J, J. Am. Chem. Soc, 1996, 118, 2744–2745. [Google Scholar]
- 54.Kaur K, Wang Y and Matson J, Biomacromolecules, 2020, DOI: 10.1021/acs.biomac.9b01600. [DOI] [PMC free article] [PubMed] [Google Scholar]
- 55.Kawano K, Yoneya T, Miyata T, Yoshikawa K, Tokunaga F, Terada Y and Iwanaga S, J. Biol. Chem, 1990, 265, 15365–15367. [PubMed] [Google Scholar]
- 56.Brogden KA, Nat. Rev. Micro, 2005, 3, 238–250. [DOI] [PubMed] [Google Scholar]
- 57.Manzo G, Scorciapino MA, Wadhwani P, Bürck J, Montaldo NP, Pintus M, Sanna R, Casu M, Giuliani A and Pirri G, PLoS One, 2015, 10, e0116379. [DOI] [PMC free article] [PubMed] [Google Scholar]
- 58.Yeaman MR and Yount NY, Pharmacol. Rev, 2003, 55, 27–55. [DOI] [PubMed] [Google Scholar]
Associated Data
This section collects any data citations, data availability statements, or supplementary materials included in this article.


