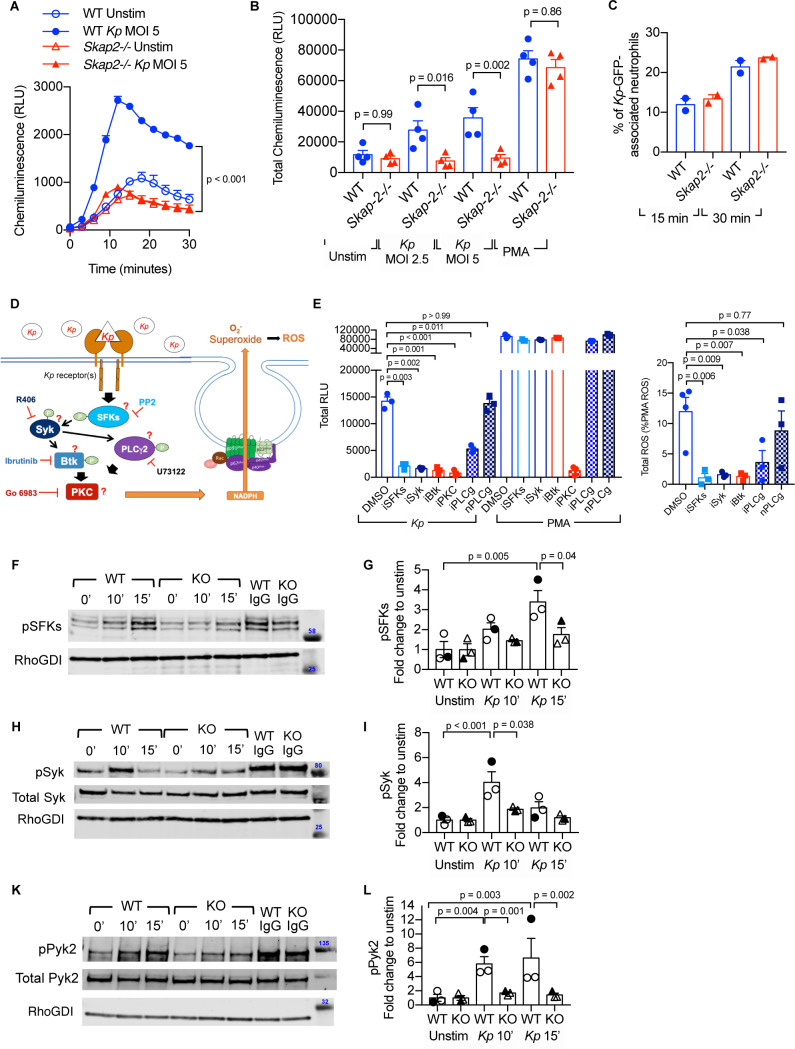
Figure 5. K. pneumoniae-stimulated ROS production requires SKAP2-dependent activation of tyrosine kinases.
(A–C) Respiratory burst of WT and Skap2-/- DIV neutrophils infected with Kp using isoluminol-chemiluminsence. Unstimulated (unstim), Kp-infected, and 100 nM PMA-treated cells were seeded on FBS-coated wells. (A) Representative experiment performed in triplicate of ROS (RLU) production following K. pneumoniae stimulation. (B) Total ROS (total RLU) produced after 30 min of stimulation was calculated as the total area under the curve shown in (A) of 4 independent experiments performed in technical triplicate. (C) WT and Skap2-/- neutrophils incubated with GFP-expressing K. pneumoniae (Kp-GFP) at MOI 40 for 15 or 30 min, stained with DAPI, and analyzed by flow cytometry for GFP-associated neutrophils. (D) Schematic of potential K. pneumoniae-activated signaling pathways tested by inhibitors. (E) Respiratory burst of WT DIV neutrophils untreated or treated with inhibitors using isoluminol-chemiluminescence assay. DIV neutrophils were pre-treated with DMSO, PP2 (iSFKs), R406 (iSyk), Ibrutinib (iBtk), Go 6083 (iPKC), U73122 (iPLCγ), or U73134 (nPLCγ/non-inhibitory analog of PLCγ inhibitor) for 10 min at 37°C and then infected with MOI 2.5 of K. pneumoniae or treated with 100 nM PMA and measured for 30 min. Total RLU was calculated as area under the curve. Data are a representative figure from 3 independent experiments showing mean ± SD performed in technical triplicate. Significance was assessed using one-way ANOVA with Sidak’s post-test. (F–L) WT and Skap2-/- neutrophils were infected with Kp for 10 or 15 min or stimulated with IC for 10 min at 37°C. Lysates were analyzed by western blot for pSFKs (Y416), pSyk (Y352), pPyk2 (Y402), and RhoGDI. Blots were then stripped and re-probed for total Syk or Pyk2. Data are compiled from 3 independent experiments. (B–C) Data are compiled from 2 to 4 independent experiments performed in technical triplicate. Statistics represent mean ± SEM. (F, H, K) Representative blot shown. (G, I, L) Solid symbols indicate values of blot shown. Bars indicate mean. Significance was assessed using one-way ANOVA (B) with Sidak’s post-test between WT and Skap-2-/-, or (G, I, L) between time points within each genotype, or two-way ANOVA with Sidak’s post-test between WT and Skap2-/- within the same point.


