Abstract
The GE Discovery MI PET/CT system has a modular digital detector design allowing three, four, or five detector block rings that extend the axial field‐of‐view (FOV) from 15 to 25 cm in 5 cm increments. This study investigated the performance of the 5‐ring system and compared it to 3‐ and 4‐ring systems; the GE Discovery IQ system that uses conventional photomultiplier tubes; and the GE Signa PET/MR system that has a reduced transaxial FOV.
Methods
PET performance was evaluated at three different institutions. Spatial resolution, sensitivity, counting rate performance, accuracy, and image quality were measured in accordance with National Electrical Manufacturers Association NU 2‐2012 standards. The mean energy resolution, mean timing resolution, and PET/CT subsystem alignment were also measured. Phantoms were used to determine the effects of varying acquisition time and reconstruction parameters on image quality. Retrospective patient scans were reconstructed with various scan durations to evaluate the impact on image quality.
Results
Results from all three institutions were similar. Radial/tangential/axial full width at half maximum spatial resolution measurements using the filtered back projection algorithm were 4.3/4.3/5.0 mm, 5.5/4.6/6.5 mm, and 7.4/5.0/6.6 mm at 1, 10, and 20 cm from the center of the FOV, respectively. Measured sensitivity at the center of the FOV (20.84 cps/kBq) was significantly higher than systems with reduced axial FOV. The peak noise‐equivalent counting rate was 266.3 kcps at 20.8 kBq/ml, with a corresponding scatter fraction of 40.2%. The correction accuracy for count losses up to the peak noise‐equivalent counting rate was 3.6%. For the 10‐, 13‐, 17‐, 22‐, 28‐, and 37‐mm spheres, contrast recoveries in the image quality phantom were measured to be 46.2%, 54.3%, 66.1%, 71.1%, 85.3%, and 89.3%, respectively. The mean energy and timing resolution were 9.55% and 381.7 ps, respectively. Phantom and patient images demonstrated excellent image quality, even at short acquisition times or low injected activity.
Conclusion
Compared to other PET/CT models, the extended axial FOV improved the overall PET performance of the 5‐ring GE Discovery MI scanner. This system offers the potential to reduce scan times or injected activities through increased sensitivity.
Keywords: Discovery MI‐5 ring scanner, instrumentation, NEMA NU 2, performance characterization, PET/CT
1. Introduction
Positron Emission Tomography/Computed Tomography (PET/CT) hybrid imaging has experienced several advances over the past decade. These advances have been on both parts of the system: the PET as well as the CT subsystems. On the PET side, these advances are seen in the introduction of time‐of‐flight imaging (TOF),1 resolution recovery [e.g., through point‐spread‐function modeling (PSF)],2 large axial and transaxial fields‐of‐view (FOV),3 continuous bed motion,4 regularized reconstruction,5 smaller detector elements,5 motion compensation techniques,5 and, most recently, digital detectors such as silicon photomultipliers (SiPMs).6 These advancements have led to significant improvements in both patient comfort4 and PET image quality5, 6 primarily due to improvements in the two fundamental characteristics of PET imaging, namely the scanner's sensitivity and resolution.
The GE Discovery MI (DMI) line of hybrid systems exhibit most of these advances in PET (with the exception of continuous bed motion) and are provided in a modular design consisting of three, four, and five rings. Evaluation of the 3‐ and 4‐ring DMI systems according to the National Electrical Manufacturers Association (NEMA) NU2‐2012 standard has been previously published,7, 8 but no independent results are available for the 5‐ring system that extends the axial FOV to 25 cm. The additional PET ring should increase the system sensitivity and counting rate performance, both of which have implications on the resultant image quality, patient radiation dose, and scan duration/throughput and, hence, an evaluation of the performance characteristics of such a system would be beneficial to the PET imaging community.
In this work, we present the NEMA NU 2‐2012 PET performance characteristics of the 5‐ring DMI system and compare it to other commercially available systems including 3‐ and 4‐ring DMI systems (with shorter axial FOVs), the 5‐ring Discovery IQ system with traditional photomultiplier tubes (PMTs), and the GE Signa PET/MR that has a similar detector design but with a reduced transaxial bore size. Data were acquired independently from three systems at three institutions to improve accuracy and robustness of results. Although not part of the NEMA 2012 standard, energy and timing resolution and PET/CT co‐registration results are also provided. Additionally, the effects of varying scan duration and reconstruction parameters on American College of Radiology (ACR) phantom and patient image quality are also presented.
2. Materials and methods
2.A. Scanner characteristics
Design specifics of the 4‐ring DMI scanner have been previously reported.7, 8 These design specifics are similar in the 5‐ring system with the exception of a fifth ring PET detector extending the axial FOV to 25 cm. Briefly, the PET scanner is composed of 34 detector modules each consisting of four blocks, yielding 136 detector blocks per ring. Each detector block is comprised of 4 (transaxial) x 9 (axial) lutetium‐yttrium‐oxyorthosilicate (LYSO) scintillator crystals. The dimensions of each crystal element are 3.95 (transaxial) 5.3 (axial) 25 (depth) mm. Each detector block is coupled to an array of 3 6 SiPM chips arranged as 2 3 independent channels (pixels), resulting in Anger multiplexing of 2:1 for crystal identification. The total number of detector elements is 24480 (4 9 detectors/block 4 blocks/module 34 modules/ring 5 rings). The axial extent of the FOV per PET ring is 47.7 mm (5.3 mm 9). The bed overlap, which compensates for decreased sensitivity at bed edges,9 is user‐selectable ranging from 1 to 44%. Image reconstruction can be performed using two algorithms based on 3D ordered‐subset expectation maximization (OSEM) (VPHD and Q.Clear). Both of these algorithms are iterative reconstruction (IR) techniques, but the Q.Clear algorithm utilizes regularization to constrain image noise resulting from large numbers of iterations. The β parameter controls the strength of the regularizing term in the Q.Clear algorithm. This β parameter is user selectable with larger values increasing the noise reduction. β = 350 is the manufacturer‐provided default value. Both algorithms use raw data arranged in sinogram space and generate images with and without TOF. The design specifications of the CT component are as previously described.6, 7, 8
2.B. PET performance evaluation
PET performance was measured at three institutions (The University of Texas MD Anderson Cancer Center, Massachusetts General Hospital, and the University of Washington Medical Center) in accordance with NEMA NU 2‐2012 standards10 and all NEMA test results were generated using vendor‐provided tools. A few of the tests (Resolution, Image Quality, and Accuracy) were also analyzed using in‐house software to corroborate the results from the vendor NEMA tools. The default energy window of 425–650 keV was used and all corrections (e.g., attenuation, decay, scatter, etc.) were used unless otherwise specified. Reconstruction algorithms were as specified for individual acquisitions. All activities were measured on instruments calibrated with a NIST‐traceable germanium‐68 source.
2.B.1. Spatial resolution
Spatial resolution was measured using three 18F point sources in capillary tubes placed at 1, 10, and 20 cm from isocenter and imaged at the center of the FOV and 1/8th of the axial FOV from the end of the tomograph. Sources were positioned in the scanner using a vendor‐supplied holder and imaged for a total of 1 min. Acquired data were reconstructed using NEMA‐specified filtered back projection (FBP) without apodization as well as IR using 4 iterations, 34 subsets, and 2 mm Gaussian filtering as per vendor recommendations. In both cases, the matrix size was 384 384, Line profiles were then drawn through the images of the point sources and the full width at half‐maximum (FWHM) and full width at tenth‐maximum in the radial, tangential, and axial direction were measured and averaged for the two axial FOV positions.
2.B.2. Sensitivity
Sensitivity was measured using a 70‐cm line source filled with a calibrated activity of approximately 3 MBq of 18F. The source was threaded inside an aluminum tube, positioned at the center of the transverse FOV, and data were acquired for 1 min. This process was repeated four times while successively adding aluminum tubes. The entire process was then repeated with the source placed 10 cm off isocenter. For both source locations, the acquired counting rates were plotted against total aluminum thickness and the absolute sensitivity was calculated by extrapolating to zero thickness. Additionally, profiles of slice sensitivity vs axial position were also generated.
2.B.3. Counting rate performance
Counting rate statistics were acquired with the 70‐cm polyethylene NEMA scattering phantom. A line source, filled to the length of 70 cm with a calibrated activity of approximately 800 MBq, was then threaded into the phantom and imaged 24 times with increasing durations while the activity decayed. The acquired data were then analyzed as per the NEMA standard using a random coincidence estimate based on the singles rate. Plots of system count rates [trues, randoms, scatter, total, and noise equivalent counts (NEC)] vs activity were generated and the peak trues, Noise Equivalent Count Rates (NECRs), and their corresponding activity concentrations were calculated. Additionally, a plot of the scatter fraction vs activity concentration was generated and the scatter fraction at the peak NEC rate was recorded.
2.B.4. Accuracy and correction for count losses
The quantitative performance of the PET system under varying amounts of activity concentrations was assessed using the data acquired in the counting rate performance test. Images of the line source were reconstructed at all time points with all data corrections applied (except decay) and the corresponding trues count rate for each acquisition was measured. The results along with a least squares‐weighted fit were then plotted against the effective activity concentration of the source as stipulated by the NEMA standard. The maximum and minimum relative count rate errors (reported as percentage units between the fit and measured results) were also plotted against the effective activity concentration. Additionally, the maximum absolute relative error below the peak NEC rate was calculated.
2.B.5. Image quality
Image quality was assessed using the NEMA IEC (International Electro‐technical Commission) body phantom, which features a lung insert, four hot spheres (10, 13, 17, and 22 mm diameter), and two cold spheres (28 and 37 mm diameter) to represent a patient torso with different lesions. Additionally, the scatter phantom used in the counting rate test substituted the rest of the patient body (activity outside the scanner FOV). The background concentration was approximately 5 kBq/cc at the start of imaging and the hot spheres were filled with an activity concentration of 4:1 compared to background. The NEMA IEC phantom was placed centrally inside the FOV of the scanner and the scatter phantom (with a line source activity of approximately 100 MBq) was placed directly behind it with the line source positioned at the 6 o'clock orientation. For the 5‐ring DMI, the PET acquisition time was approximately 5–10 min. This process was then repeated two additional times with slightly longer scan duration (to account for radioactive decay). CT images were additionally acquired for attenuation correction. PET images were reconstructed using IR with TOF. Regions‐of‐interest were then drawn on the resultant images according to the NEMA image quality protocol and the relevant image quality metrics were calculated.
2.B.6. Energy and timing resolution
The line source used in the sensitivity test (at low activity) was used to measure the energy and timing resolution of the scanner. The source was threaded into the smallest aluminum tube and positioned centrally in the FOV of the scanner. Care was taken to ensure accurate alignment to within 2 mm and that the source had a total count rate greater than 200 kcps with an average detector block dead time of less than 1.3%. Data were then acquired until a total of 400 million coincidence counts were recorded. The acquired data were then analyzed and the mean energy resolution and timing resolution averaged over all detector modules was calculated. The effect of increasing source activity (and increasing dead time) on timing resolution was also measured at one institution using two approaches: (a) the smallest aluminum line source and (b) a scatter phantom as per NEMA NU2‐2018 standard, while making measurements of a 370 MBq source as it decayed.
2.B.7. PET/CT co‐registration
PET/CT alignment and co‐registration was assessed using point sources in capillary tubes similar to those used in the resolution test described above. For this test, the radioactive source was first mixed with iodinated contrast media before the point sources were made. Three sources were created and then positioned at the end of the bed in the scanner (0, 1 cm; 0, 10 cm; and 0, 20 cm). The bed was loaded with approximately 70 kg and the sources were imaged at the center of the axial FOV. Data were acquired for 3 min and reconstructed with the standard clinical protocol. The resultant fused PET/CT images were then evaluated and the distance between the corresponding centroids of each point source on the PET and CT images was measured. This test was only performed at one institution (MD Anderson).
2.C. ACR phantom imaging
American College of Radiology phantom images were acquired with various scan durations and reconstruction parameters to assess the impact of scan time and processing parameters on image quality. The ACR phantom was prepared according to a 70‐kg patient with an injected activity of 370 MBq. The center of the phantom was placed in the overlap region of 28% between two beds and data were acquired for 5 min per bed in list mode. Partial data from the list‐mode acquisition was used to simulate acquisition times of 0.5, 1, 1.5, 2, 3, and 4 min per bed. Investigated image reconstructions were (a) OSEM with 2 iterations, 17 subsets, TOF correction, PSF correction, and 5 mm Gaussian postfiltering, and (b) Q.Clear with β = 350. Both the contrast of the 8‐, 12‐, 16‐, and 25‐mm cylinders and the spatial resolution of the 4.8‐, 6.4‐, 7.9‐, 9.5‐, 11.1‐, and 12.7‐mm sectors were qualitatively evaluated for the overall system contrast and resolution with respect to the scan time and reconstruction. This test was only performed at one institution (MD Anderson).
2.D. Patient imaging
Retrospective patient scans at one institution (MD Anderson) were analyzed in compliance with Code of Federal Regulations Title 45 Part 46 Section 46.101(b) for exempt human subject research. Patient images were acquired with 3 min per bed position and reconstructed with various scan durations and processing parameters. Patients were injected with a target dose of 370 MBq (10 mCi) of 18F‐FDG and were imaged an average of 60 min postinjection. Bed overlap was set to 25 slices or 28%. All data were acquired with list mode and later rebinned for the images of reduced scan durations. In one case, a patient was injected with only 104 MBq (2.8 mCi), permitting assessment of image quality at low dose.
2.E. Statistical analysis
Results are given as mean ± SD. Comparison data for other systems were obtained from the literature. Significance was determined with an unpaired, two‐tailed t test. Values were considered significantly different if P < 0.05.
3. Results
3.A. PET performance evaluation
Results of the PET performance testing, averaged across the three scanners, are shown in Table 1. Results from all institutions were very similar. Resolution measurements using the IR algorithm were found to be superior to those using FBP as expected. Sensitivity in the center of the scanner was measured to be 20.84 ± 1.13 cps/kBq [Fig. 1(a)] and identical to the sensitivity measured at 10 cm offset. A profile of slice sensitivity vs axial position is shown in Fig. 1(b). Analysis of counting rates yielded a peak NECR of 266.3 ± 4.58 kcps at an activity concentration of 20.8 ± 0.48 kBq/ml [Fig. 2(a)]. The mean scatter fraction at that activity concentration was measured to be 40.2% ± 0.26% [Fig. 2(b)]. Plots of the trues rate vs effective activity concentration showed a near linear response up to the peak NECR activity concentration, signifying excellent accuracy of quantitative measurements through varying activity concentrations [Fig. 2(c)]. The maximum counting rate error for the concentration at the NECR peak was measured to be 3.61% ± 1.0%. As expected, the contrast recovery and background variability increased and decreased, respectively, as sphere size increased. The mean energy and timing resolution were measured successfully and the timing resolution was found to increase moderately with increasing activity for both phantoms (line and scatter), as expected (Fig. 3). Timing resolution measured at low activity was not significantly different between the line (381.7 ± 5.51 ps) and scatter (387.8 ps) phantoms. At clinically relevant activity concentrations, the timing resolution was relatively constant at <400 ps. The PET and CT subsystems were found to co‐register without measurable deviation (Fig. 4). In‐house analysis of the NEMA 2012 Resolution, Image Quality and Accuracy tests showed results with average <10% difference compared to the vendor tools (data not shown).
Table 1.
Comparison of PET/CT system performance.
| Parameter | Result |
|---|---|
| Spatial resolution, FBP | FWHM (mm)/ FWTM (mm) |
| Radial, 1 cm | 4.32 ± 0.21/8.79 ± 0.02 |
| Tangential, 1 cm | 4.35 ± 0.07/8.54 ± 0.14 |
| Axial, 1 cm | 5.05 ± 0.06/10.5 ± 0.26 |
| Radial, 10 cm | 5.51 ± 0.05/10.5 ± 0.10 |
| Tangential, 10 cm | 4.56 ± 0.02/ 8.88 ± 0.21 |
| Axial, 10 cm | 6.49 ± 0.35/ 13.0 ± 1.0 |
| Radial, 20 cm | 7.39 ± 0.06/ 14.9 ± 0.76 |
| Tangential, 20 cm | 5.01 ± 0.06/ 9.13 ± 0.26 |
| Axial, 20 cm | 6.56 ± 0.33/ 13.7 ± 1.2 |
| Spatial resolution, IR | FWHM (mm)/ FWTM (mm) |
| Radial, 1 cm | 3.73 ± 0.06/ 7.51 ± 0.06 |
| Tangential, 1 cm | 3.91 ± 0.09/ 7.74 ± 0.16 |
| Axial, 1 cm | 4.21 ± 0.18/ 9.68 ± 0.11 |
| Radial, 10 cm | 4.73 ± 0.06/ 8.85 ± 0.05 |
| Tangential, 10 cm | 3.86 ± 0.03/ 7.79 ± 0.07 |
| Axial, 10 cm | 4.48 ± 0.54/ 9.23 ± 0.27 |
| Radial, 20 cm | 7.15 ± 0.01/ 12.8 ± 0.04 |
| Tangential, 20 cm | 4.29 ± 0.26/ 8.46 ± 0.22 |
| Axial, 20 cm | 4.91 ± 0.36/ 9.29 ± 0.05 |
| Sensitivity | (cps/kBq) |
| Center | 20.84 ± 1.13 |
| 10 cm | 20.61 ± 0.943 |
| Counting rate statistics | |
| PNECR | 266.3 ± 4.58 kcps |
| PNECR activity | 20.8 ± 0.48 kBq/ml |
| Peak trues rate | 1213 ± 18.3 kcps |
| Peak trues activity | 34.5 ± 1.01 kBq/ml |
| PNECR SF | 40.2 ± 0.26% |
| Max. error at PNECR | 3.61 ± 1.0% |
| Image Quality, IR | CR/ BV |
| 10 mm | 46.2 ± 10%/ 9.26 ± 1.6% |
| 13 mm | 54.3 ± 3.4%/ 7.07 ± 0.93% |
| 17 mm | 66.1 ± 2.6%/ 5.38 ± 0.65% |
| 22 mm | 71.1 ± 2.1%/ 4.37 ± 1.2% |
| 28 mm | 85.3 ± 1.2%/ 3.80 ± 1.4% |
| 37 mm | 89.3 ± 1.4%/ 3.45 ± 1.4% |
| Average lung error | 5.85 ± 1.1% |
| Timing resolution | 381.7 ± 5.51 ps |
| Energy resolution | 9.55 ± 0.05% |
FBP, filtered back projection; FWHM, full width at half maximum; FWTM, full width at tenth‐maximum; IR, iterative reconstruction; PNECR, peak noise‐equivalent counting rate; SF, scatter fraction; CR, contrast recovery; BV, background variability.
Figure 1.
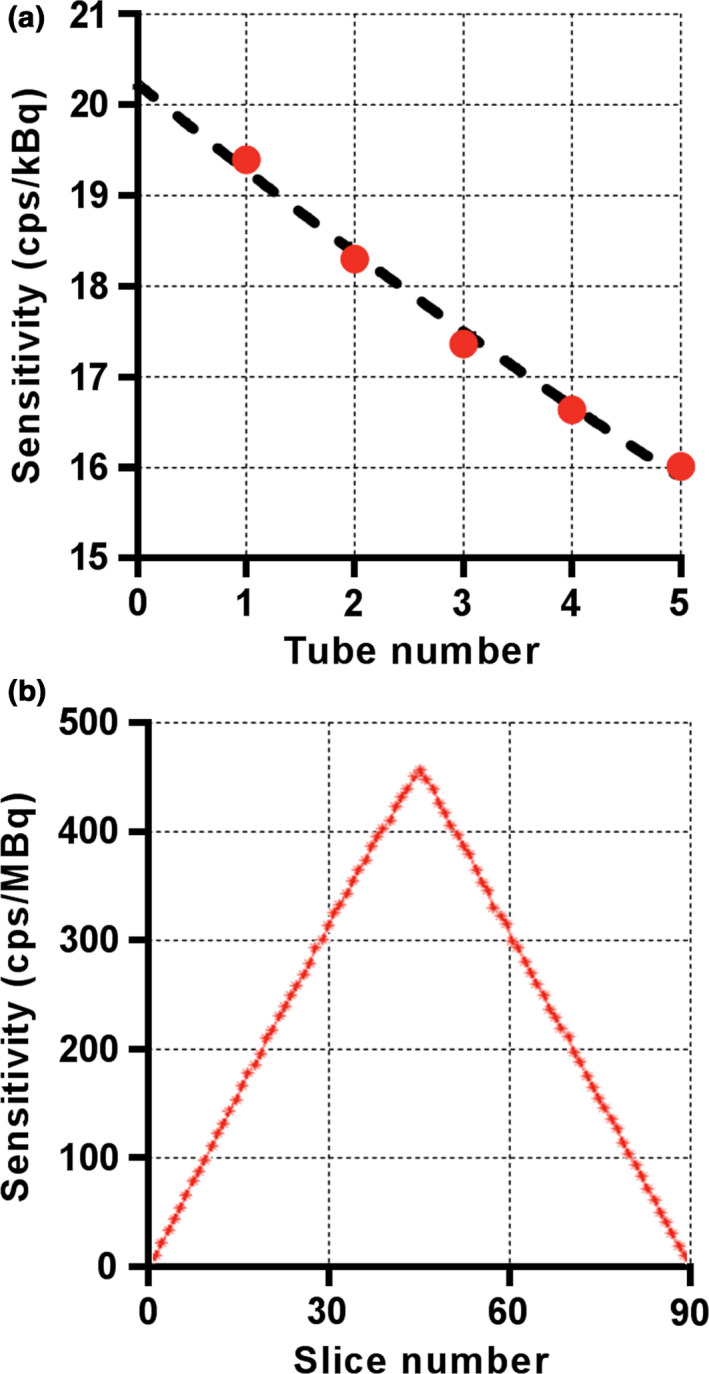
Representative results of NEMA sensitivity testing on one 5‐ring Discovery MI scanner (MD Anderson). Sensitivity was measured by successively increasing attenuation with five aluminum tubes (a) and the axial sensitivity profile was generated for individual slices (b). Results are shown for a radial offset of 0 cm. [Color figure can be viewed at wileyonlinelibrary.com]
Figure 2.
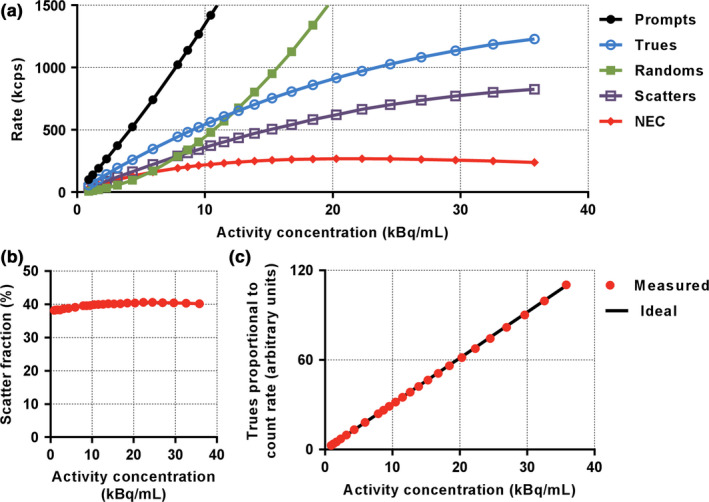
Representative results of NEMA performance testing on one 5‐ring Discovery MI scanner (MD Anderson). Figure shows results for counting rate performance (a), scatter fraction as a function of activity concentration (b), and accuracy (c). NEC, noise‐equivalent counting. [Color figure can be viewed at wileyonlinelibrary.com]
Figure 3.
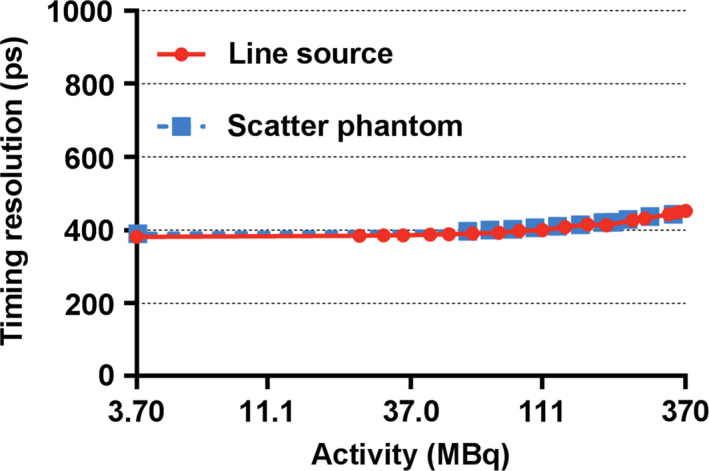
Discovery MI PET timing resolution as a function of source activity (natural log scale). Increased activities resulted in inferior timing resolution, as expected. [Color figure can be viewed at wileyonlinelibrary.com]
Figure 4.
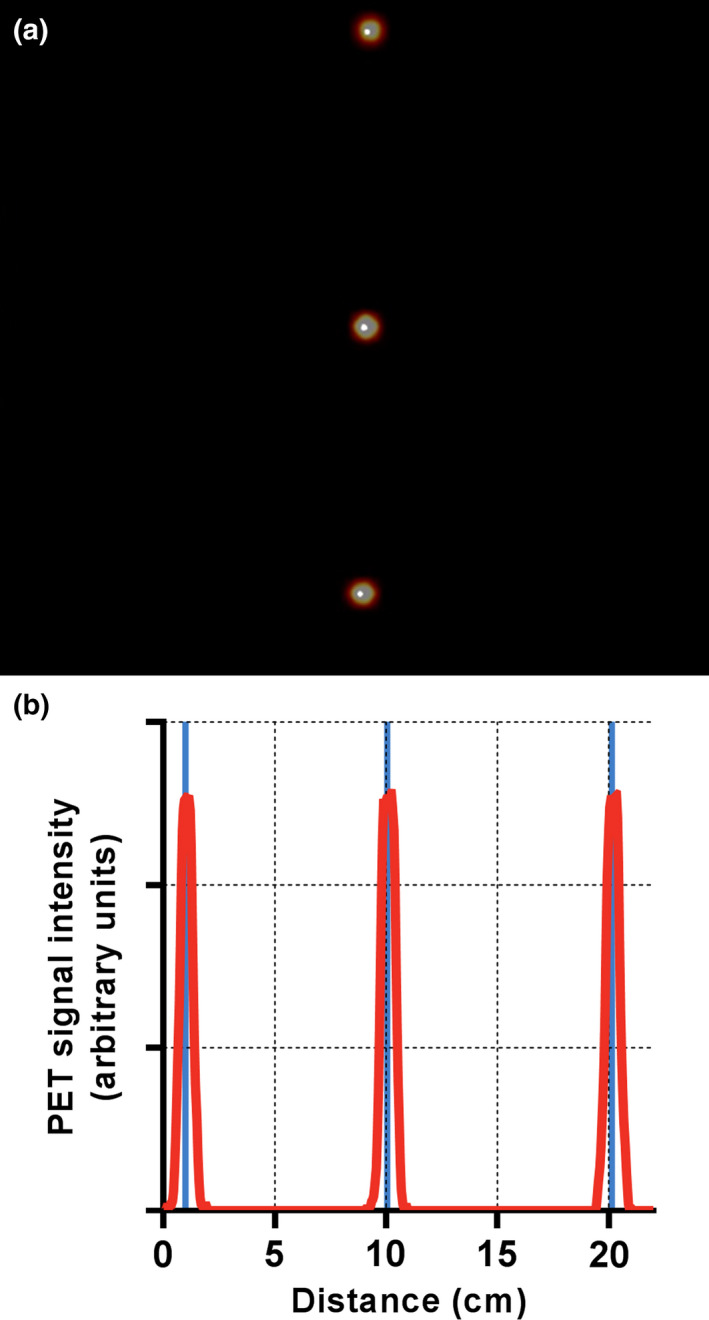
Results from the PET/CT co‐registration test indicated excellent alignment. The distance between the PET and CT centroids was negligible for all sources on both the fused image (a) and the PET signal profile through the center of the image (b). Within the profile of PET signal, the solid vertical lines denote the center of the CT signal centroids. [Color figure can be viewed at wileyonlinelibrary.com]
3.B. ACR phantom imaging
The best resolution visualized for the OSEM and Q.Clear reconstructions was 6.4 and 4.8 mm, respectively, for all scan durations between 1.5 and 5 min (Fig. 5). All four hot cylinders were well visualized with both the OSEM and Q.Clear reconstructions for scan durations between 2 and 5 min (Fig. 6). Image noise was lower in the Q.Clear than the OSEM reconstruction.
Figure 5.
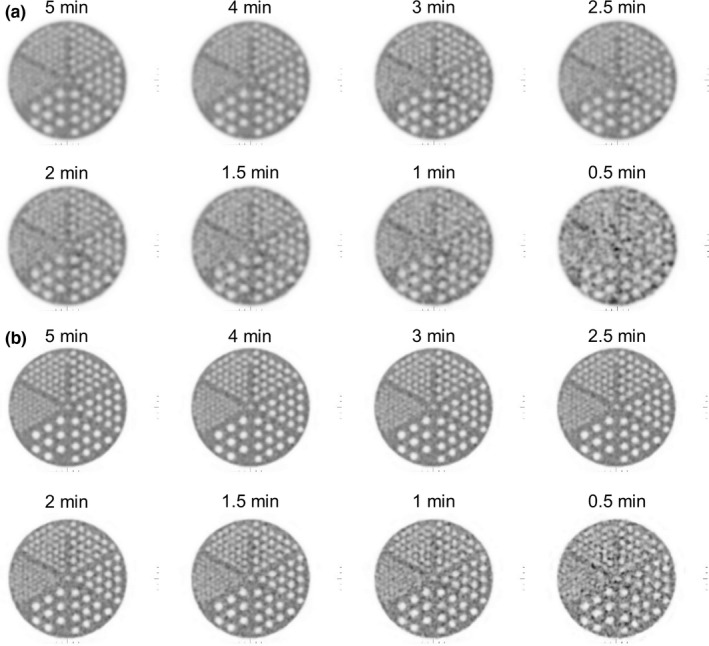
Reconstructed images of the ACR spatial resolution module. Five and six sections were visible on the (a) OSEM and (b) Q. Clear images, respectively, from 1.5 to 5 min/bed.
Figure 6.
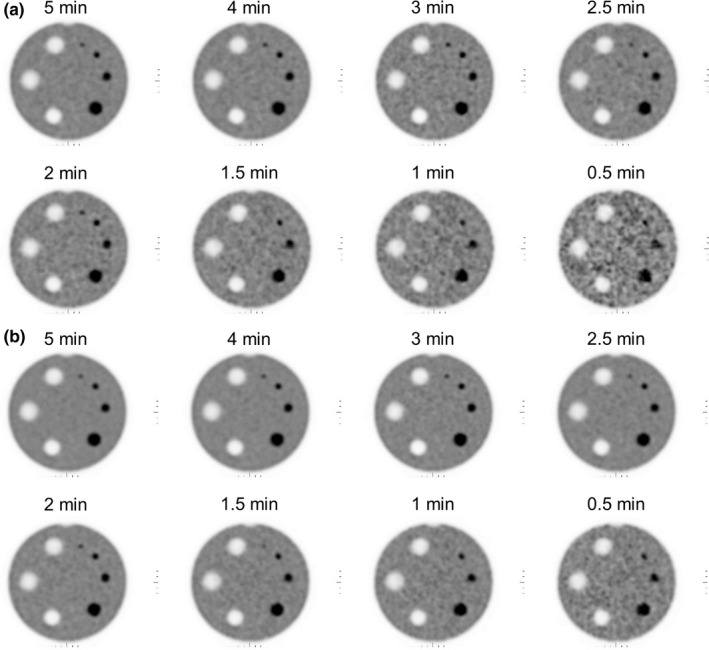
Images of the ACR contrast module reconstructed with (a) OSEM and (b) Q.Clear. All four high‐contrast cylinders were visible for the images of 2 to 5 min/bed. Q.Clear images were less noisy and exhibited better low‐contrast detectability.
3.C. Patient imaging
Patient imaging benefited significantly from TOF correction (Fig. 7), permitted by the system's LYSO crystals and short coincidence timing resolution. All patient images demonstrated excellent image quality, even at low injected activity or short acquisition times (Fig. 8). This was true regardless of pathology and patient size.
Figure 7.
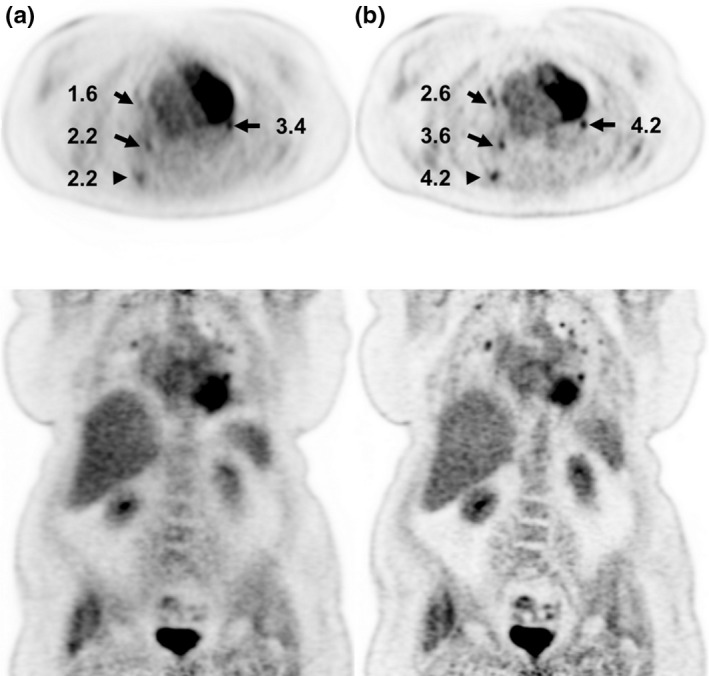
Patient images from a 76‐year‐old female (BMI = 42) with injection activity of 429 MBq (11.6 mCi) and uptake time of 64 min. Images are reconstructed without (a) and with (b) time‐of‐flight (TOF) correction with 3 min per bed. Numbers indicate lesion standardized uptake value (SUV).
Figure 8.
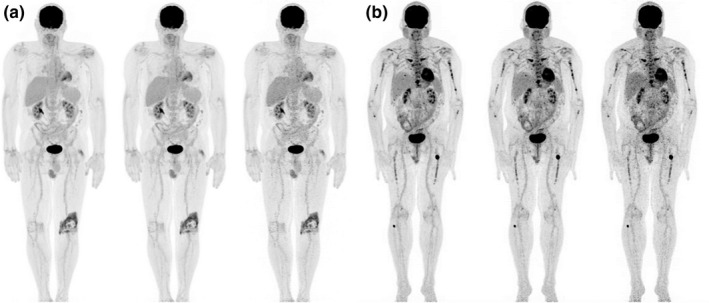
Representative patient maximum intensity projections reconstructed with time‐of‐flight corrections. (a) Patient (BMI = 28) with injection activity of 405 MBq (11 mCi) and uptake time of 68 min. The total acquisition times were 23, 14 and 7 min from left to right corresponding to 3, 2 and 1 min/bed, respectively, for 5 beds from head to mid‐thigh and 2, 1 and 0.5 min/bed, respectively, for 4 beds over the legs. (b) Patient (BMI = 27) with injection activity of 104 MBq (2.8 mCi) and uptake time of 72 min. The images from left to right were 3, 2, and 1 min/bed for 9 beds for a total scan time of 27, 18 and 9 min, respectively.
4. Discussion
In this work, we evaluated the PET performance of the 5‐ring DMI system at three institutions. Results from all institutions were very similar, but the NEMA image quality results were more variable between centers, most likely due to slightly dissimilar activity ratios, activity at scan time, or phantom positioning. NEMA testing of the system revealed high sensitivity and peak NECR (Table 1). For reference, Table 2 compares the performance of this system to other state‐of‐the‐art GE PET scanners.
Table 2.
Comparison of PET/CT system performance.
| Parameter | 5‐ring DMI (this work) | 4‐ring DMI7, 8 | 3‐ring DMI11 | Discovery IQ12, 13 | Signa PET/MR14, 15 |
|---|---|---|---|---|---|
| System specifications | |||||
| Axial/Transaxial FOV (cm) | 25/70 | 20/70 | 15/70 | 25/70 | 25/60 |
| Detector (type) | SiPM | SiPM | SiPM | PMT | SiPM |
| Scintillator type | LYSO | LYSO | LYSO | BGO | LYSO |
| Scintillator depth (mm) | 25 | 25 | 25 | 30 | 25 |
| Scintillator size (mm x mm) | 3.95 x 5.3 | 3.95 x 5.3 | 3.95 x 5.3 | 6.3 x 6.3 | 3.95 x 5.3 |
| Spatial resolution, FBP | R/T/A | R/T/A | R/T/A | Rb/Tb/ Ab | R/T/A |
| 1 cm, FWHM (mm) | 4.3/4.3/5.0 | 4.1/4.2 /4.5a | 4.4/4.8a /4.8a | 4.4c/4.1c/5.3c | |
| 10 cm, FWHM (mm) | 5.5/4.6/6.5 | 5.5/4.5/6.0 | 5.6/5.2a /4.9a | 5.8c/4.4c/6.7c | |
| 20 cm, FWHM (mm) | 7.4/5.0/6.6 | 7.5/4.9/6.1 | 8.3a /5.6a /4.7a | 8.4c/5.2c/7.3c | |
| Sensitivity (cps/kBq) | |||||
| Center | 20.8 | 13.2a | 7.5c | 23.3 | 23.1 |
| 10 cm | 20.6 | 13.1a | 20.0 | 22.5 | |
| Counting rate statistics | |||||
| PNECR (kcps) | 266 | 190a | 100c | 190a | 217a |
| PNECR activity (kBq/ml) | 20.8 | 22.2 | 20.6c | 9.5a | 17.8a |
| SF at PNECR (%) | 40.2 | 41.4 | 37a | 43.8a | |
| Max. error at PNECR (%) | 3.61 | 3.28 | 3.65 | ||
| Image Quality | |||||
| 10 mm (CR/BV; %) | 46/9.3 | 53/10.1 | 28/6.5 | 43/4.9a | |
| 13 mm (CR/BV; %) | 54/7.1 | 63/7.7 | 47/5.7 | 49/4.0a | |
| 17 mm (CR/BV; %) | 66/5.4 | 70/5.8 | 62/5.0 | 60/3.2a | |
| 22 mm (CR/BV; %) | 71/4.4 | 78/4.4 | 68/4.3 | 77/2.7 | |
| 28 mm (CR/BV; %) | 85/3.8 | 87/3.7 | 66a /3.6 | 79a /2.2 | |
| 37 mm (CR/BV; %) | 89/3.5 | 90/3.0 | 72a /3.1 | 87/1.9 | |
| Average lung error (%) | 5.9 | 6.1 | 22.2a | 3.2 | |
DMI, Discovery MI; SiPM, silicon photomultiplier; PMT, photomultiplier tube; LYSO, lutetium yttrium oxyorthosilicate; BGO, bismuth germanium oxide; FBP, filtered back projection; R/T/A, radial//tangential/axial; FWHM, full width at half maximum; PNECR, peak noise‐equivalent counting rate; SF, scatter fraction; max., maximum; CR; contrast recovery, BV, background variability.
Significantly different from 5‐ring DMI value.
FBP data are not available so results are for iterative reconstruction.
Insufficient data are available to determine significance.
The extended axial FOV of the 5‐ring system could have significant effects on scan times and patient doses. The increased axial FOV itself provides longer coverage, thereby reducing the required number of beds and, therefore, scan time. Additionally, the extended FOV increased sensitivity, which can be exchanged for either reduced scan time or injected activity. ACR phantom and patient images verified that scan time or injected activity could be significantly reduced with this scanner while maintaining adequate image quality (Figs. 5, 6, 7, 8), thereby positively impacting patient experience and scanner throughput. With this system, diagnostic whole‐body PET/CT can be performed in about 10–15 min. Experience with this system over the past few months suggests that with such short scan times, scanner throughput is limited primarily by patient positioning, data entry to the electronic medical record during scan time, and image reconstruction using advanced techniques such as Q.Clear.
Compared to the 4‐ring DMI,7, 8 the extended axial FOV of the 5‐ring model enhanced sensitivity and peak NECR. Comparing our results to previously published results for 3‐ and 4‐ring DMI scanners,7, 11 the sensitivity was found to increase quadratically with axial FOV, as expected.3 Other parameters, such as spatial resolution, were found to be similar on all DMI systems.
The 5‐ring DMI also performed differently compared to the GE Discovery IQ, a similar 5‐ring PET/CT system with a 25‐cm axial FOV that features a different detector configuration, but an identical energy window.12, 13 The IQ utilizes 3‐cm bismuth germanium oxide (BGO) crystals with traditional PMTs as compared to the 2.5‐cm LYSO crystals with SiPMs of the DMI systems. While the sensitivity was slightly higher for the IQ due to the longer crystals (30 vs 25 mm) and denser material (BGO vs LYSO), the spatial resolution was slightly worse due to the larger crystals, although differences in reconstruction complicated resolution comparison (Tables 1 and 2). The DMI, in contrast, had significantly higher peak NECR (due to its LYSO crystals), but the activity concentration at which this NECR occurs was also significantly higher. At clinically relevant activity concentrations, the DMI NECR was moderately superior. The DMI also demonstrated better image quality characteristics such as contrast recovery and average lung error (Table 1), but the reconstruction algorithms were different as the IQ does not support TOF corrections (due to its traditional BGO crystal‐based detectors). We believe that an in‐depth investigation of clinical performance on these systems is warranted.
The 5‐ring DMI was also compared to the GE SIGNA PET/MR, which features a similar PET subsystem, but with a transverse FOV reduced from 70 to 60 cm.14, 15 The DMI exhibited slightly lower sensitivity due to its reduced geometric efficiency, but a slightly lower mean scatter fraction as well. Peak NECR was moderately higher in the DMI, most likely due to decreased randoms and scatter resulting from the increased transverse FOV. The 5‐ring DMI peak NECR, however, was measured at a slightly higher activity. Finally, the SIGNA demonstrated slightly improved image quality in the form of reduced background variability. Overall, the performance of these systems was quite similar.
5. Conclusion
The new 5‐ring DMI system offers the potential to reduce patient doses and scan times through its extended axial FOV and resulting increased sensitivity. Compared to other PET/CT models, the extended axial FOV and shorter timing resolution improved PET performance.
Ethical approval
All procedures performed in studies involving human participants were in accordance with the ethical standards of the institutional and/or national research committee and with the 1964 Helsinki declaration and its later amendments or comparable ethical standards.
Informed consent
Patient studies were performed in compliance with Code of Federal Regulations Title 45 Part 46 Section 46.101(b) for exempt human subject research.
Conflict of interest
The authors have no financial conflicts of interest related to the material presented in this article.
References
- 1. Surti S, Karp JS. Advances in time‐of‐flight PET. Phys Medica. 2016;32:12–22. [DOI] [PMC free article] [PubMed] [Google Scholar]
- 2. Alessio AM, Stearns CW, Tong Shan, et al. Application and Evaluation of a measured spatially variant system model for PET image reconstruction. IEEE Trans Med Imaging. 2010;29:938–949. [DOI] [PMC free article] [PubMed] [Google Scholar]
- 3. MacDonald LR, Harrison RL, Alessio AM, Hunter WCJ, Lewellen TK, Kinahan PE. Effective count rates for PET scanners with reduced and extended axial field of view. Phys Med Biol. 2011;56:3629–3643. [DOI] [PMC free article] [PubMed] [Google Scholar]
- 4. Schatka I, Weiberg D, Reichelt S, et al. A randomized, double‐blind, crossover comparison of novel continuous bed motion versus traditional bed position whole‐body PET/CT imaging. Eur J Nucl Med Mol Imaging. 2016;43:711–717. [DOI] [PubMed] [Google Scholar]
- 5. van der Vos CS, Koopman D, Rijnsdorp S, et al. Quantification, improvement, and harmonization of small lesion detection with state‐of‐the‐art PET. Eur J Nucl Med Mol Imaging. 2017;44:4–16. [DOI] [PMC free article] [PubMed] [Google Scholar]
- 6. Baratto L, Park SY, Hatami N, et al. 18F‐FDG silicon photomultiplier PET/CT: A pilot study comparing semi‐quantitative measurements with standard PET/CT. PLoS ONE. 2017;12:e0178936. [DOI] [PMC free article] [PubMed] [Google Scholar]
- 7. Hsu DFC, Ilan E, Peterson WT, Uribe J, Lubberink M, Levin CS. Studies of a next‐generation silicon‐photomultiplier‐based time‐of‐flight PET/CT system. J Nucl Med. 2017;58:1511–1518. [DOI] [PubMed] [Google Scholar]
- 8. Wagatsuma K, Miwa K, Sakata M, et al. Comparison between new‐generation SiPM‐based and conventional PMT‐based TOF‐PET/CT. Phys Medica. 2017;42:203–210. [DOI] [PubMed] [Google Scholar]
- 9. McKeown C, Gillen G, Dempsey MF, Findlay C. Influence of slice overlap on positron emission tomography image quality. Phys Med Biol. 2016;61:1259–1277. [DOI] [PubMed] [Google Scholar]
- 10. National Electrical Manufacturers Association (NEMA) . NEMA NU 2–2012: Performance Measurements of Positron Emission Tomographs (PETs). Rosslyn, VA; 2013. https://www.nema.org/Standards/Pages/Performance-Measurements-of-Positron-Emission-Tomographs.aspx
- 11. Levin C, Peterson W, Ross S, Stearns C, Uribe J. PET performance as a function of axial field of view for a new silicon photomultiplier‐based whole body TOF PET/CT system. J Nucl Med. 2016;57(Suppl. 2):200. http://jnm.snmjournals.org/content/57/supplement_2/200.abstract [Google Scholar]
- 12. Reynés‐Llompart G, Gámez‐Cenzano C, Romero‐Zayas I, Rodríguez‐Bel L, Vercher‐Conejero JL, Martí‐Climent JM. Performance characteristics of the whole‐body Discovery IQ PET/CT system. J Nucl Med. 2017;58:1155–1161. [DOI] [PubMed] [Google Scholar]
- 13. Morzenti S, DePonti E, Guerra L, et al. Performance evaluation of the Discovery IQ ‐ GE PET/CT scanner according to NEMA NU2‐2012 standard. J Nucl Med. 2015;56(Suppl. 3):1846. http://jnm.snmjournals.org/content/56/supplement_3/1846.abstract [Google Scholar]
- 14. Grant AM, Deller TW, Khalighi MM, Maramraju SH, Delso G, Levin CS. NEMA NU 2–2012 performance studies for the SiPM‐based ToF‐PET component of the GE SIGNA PET/MR system. Med Phys. 2016;43:2334–2343. [DOI] [PubMed] [Google Scholar]
- 15. Ilan E, Deller T, Kjellberg F, Peterson W, Lubberink M. Performance comparison of three commercially available PET systems: SIGNA PET/MR, Discovery IQ and Discovery MI. J Nucl Med. 2017;58(Suppl. 1):1353. http://jnm.snmjournals.org/content/58/supplement_1/1353.abstract [Google Scholar]


