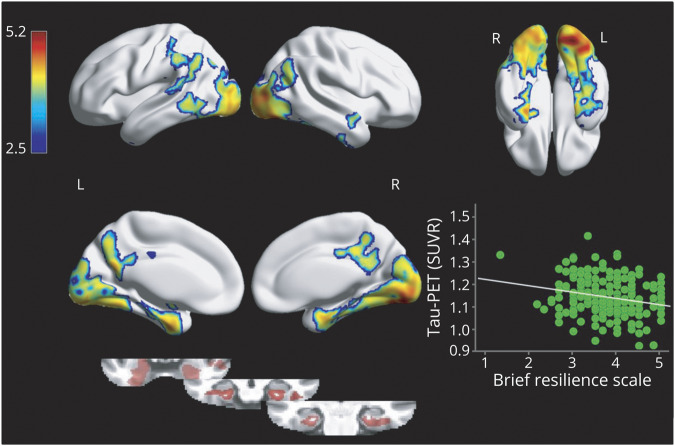
Figure 1. Results from the voxel-wise multiple regression analysis between stress coping ability and tau-PET adjusted by sex, age, and education.
Maps were thresholded at p < 0.005 at voxel level and family-wise error p < 0.05 at cluster level. Significant clusters included inferior and medial temporal lobes, occipito-temporal (fusiform and lingual gyri), and cuneal/precuneus cortices. The Y axis represents the mean standard uptake value ratio (SUVR) tau-PET uptake within these regions. The X axis represents the brief resilience scale scores. Medial temporal results are shown as a binary mask overlaid into a T1 structural image.

