Abstract
Background
The aim of this study was to investigate STMN1 and MKI67 expression in uterine leiomyosarcoma and their potential roles as biomarkers for diagnosis.
Material/Methods
The expression of STMN1 and MKI67 mRNA in uterine leiomyosarcoma were investigated in TCGA database. The overall survival (OS) and disease-free survival (DFS) were compared between high and low expression groups. Seventy-two patients who received hysterectomy were included and divided into 4 groups: uterine normal smooth muscle tissue (UNSM=30), uterine leiomyoma (UL=30), uterine cellular leiomyoma (UCL=24), and uterine leiomyosarcoma (ULS=18). The STMN1 and MKI67 protein expression of the 4 groups were examined by immunohistochemistry (IHC) assay.
Results
The expression level of STMN1 mRNA in cancer tissue was significantly higher than those of normal uterine smooth muscle tissue. The high and low expression of STMN1 and mki67 gene mRNA was not related to the patients’ OS and DFS (P>0.05). The positive rate of STMN1 protein in uterine leiomyosarcoma was 100.00%, which was significantly higher than that of the other 3 groups (χ2=11.72, P=0.008). And the positive rate of KIM67 protein in uterine leiomyosarcoma was 77.78%, which was also significantly higher than that of the other 3 groups (χ2=48.89, P=0.000). The diagnostic sensitivity and specificity were 77.78%, 90.74% for STMN1 combined MKI67 with the positive predictive value and negative predictive value of 73.68% and 92.45%, respectively.
Conclusions
STMN1 and MKI67 were upregulated in uterine leiomyosarcoma and act as potential biomarkers for uterine leiomyosarcoma diagnosis.
MeSH Keywords: Biological Markers; Chemistry, Bioinorganic; Gene Expression
Background
Uterine smooth muscle tumor is the most common clinically diagnosed tumor in women. It is generally divided into benign smooth muscle tumor, malignant leiomyosarcoma, and special type of smooth muscle tumor [1]. Cell-rich smooth muscle tumor of the uterus is a special type of uterine leiomyoma. The cellular smooth muscle tumors and uterine leiomyosarcomas are mainly differentiated by pathology, but sometimes it is difficult to differentiate them only by cell morphology. Stathmin-1 (STMN1), a microtubule depolymerization-related protein widely expressed in the cytoplasm, participates in the assembly of microtubules and spindles, and promotes the proliferation, differentiation, and invasion of tumor cells [2,3]. MKI67 is a kind of nuclear protein which is expressed in proliferating cell nuclei and is closely related to cell proliferation [4–6]. STMN1 and MKI67 play an important role in mitotic spindle formation and cell mitosis, and their abnormal expression is closely related to the occurrence and development of multiple tumors. After a systematic search of the PubMed database, only 1 study related to the expression of STMN1 in uterine smooth muscle tumors was identified [7]. The biological function of STMN1 and MKI67 in uterine smooth muscle tumor in not clear yet. Therefore, we performed this study to investigate the relationship between the expression of STMN1 and MKI67 in uterine smooth muscle tumor and their role in the development of uterine leiomyosarcoma.
Material and Methods
STMN1 and MKI67 expression analysis
The expression levels of STMN1 and MKI67 genes in various tissues and solid tumor tissues were compared by searching the TCGA database. The searching conditions were “uterine leiomyosarcoma”, “ STMN1 and MKI67”, and the species was restricted to human. At the same time, we compared the difference between STMN1 and MKI67 genes in the cancer tissues and adjacent normal tissues of uterine leiomyosarcoma patients. The condition of differential expression was that STMN1 and mki67 mRNA was upregulated or downregulated by more than 2-fold (|log2FC| >1) (P<0.05).
STMN1 and MKI67 related protein–protein interaction (PPI) network
A protein–protein interaction (PPI) network relevant STMN1 and MKI67 proteins was constructed by using the STRING database. The “Organism” searching condition was limited to “human”. The “Protein name” searching condition was limited to “STMN1 or MKI67”. The active interaction sources were restricted to “Text mining”, “Experiments”, “Databases”, “Co-expression”, “Neighborhood”, “Gene Fusion”, and “Co-expression”. The minimum required interaction score was more than 0.7 [8]
STMN1 and MKI67 co-expression analysis
In the TCGA database, according to the co-expression relationship with STMN1 and MKI67 genes, the genes related to STMN1 and MKI67 were clustered, and 2 genes with the most significant positive correlation and negative correlation were selected for analysis. The correlation was analyzed by Pearson correlation test of gene expression levels. For survival analysis, the patients were divided into high (≥STMN1 or MKI67 medical expression) or low (<STMN1 or MKI67 medical expression) expression groups according to the median expression of STMN1 and MKI67 genes mRNA in uterine leiomyosarcoma. We assessed the hazard ratio (HR) of survival difference between STMN1 and MKI67 gene high and low expression groups. The log rank test was used to compare the overall survival (OS) and progression-free survival (DFS) of high and low expression groups.
Real-time PCR assay
Total RNA was extracted from cancer tissue by TRIzol® reagent. Total RNA was reverse transcribed into cDNAs. Real-time PCR assay for detection STMN1 and MKI67 relative expression was performed using the SYBR® Premix Ex Taq™ II kit (Takara Bio, Inc., Otsu, Japan). The primers used were:
MKI67, For: 5′-CCACACTGTGTCGTCGTTTG-3′;
Rev: 5′-CCGTGCGCTTATCCATTCA-3′.
STMN1, For: 5′-GTACTTCTGGACTCACGGGC-3′;
Rev: 5′-AAGGCAAGAGTGGTCTGCTC-3′.
The relative expression levels of STMN1 and MKI67 mRNA were calculated using the formula 2−ΔΔCt.
STMN1 and MKI67 immunohistochemistry (IHC) assay
Seventy-two patients who received hysterectomy were included from Wenzhou People’s Hospital, the First Affiliated Hospital, and the Second Affiliated Hospital of Wenzhou Medical University from January 2013 to June 2016. Signed informed consent was obtained in all the included subjects and the work was approved by the Ethics Committee of Second Affiliated Hospital of Wenzhou Medical University. Myomectomy or hysterectomy were performed in patients with uterine smooth muscle tumors and cell-rich smooth muscle tumor and total hysterectomy plus double appendage resection was performed in patients with uterine leiomyosarcoma, with or without pelvic lymphadenectomy. Most of the patients had menstrual changes or abdominal mass, and there was no history of myomectomy. The 72 patients were divided into 4 groups according to the histopathological results: uterine normal smooth muscle tissue (UNSM=30), uterine leiomyoma (UL=30), uterine cellular leiomyoma (UCL=24), and uterine leiomyosarcoma (ULS=18).
The protein expression levels of STMN1 and MKI67 were detected by immunohistochemistry assay. For STMN1 expression, the staining intensity score of each field was multiplied by the percentage of positive cells [3], and the average value was obtained: no staining was scored as 0 points, light-yellow was scored as 1 point, brown-yellow was scored as 2 points, and brown was scored as 3 points. According to the percentage of positive cells, scores were: 5% or less = 0 point, 6–25%=1 point, 26–50%=2 points, 51–75%=3 points, and >75%=4 points. 0 points was negative, 1–4 was weak positive, 5–8 was moderate positive, and 9–12 was strong positive. In the MKI67 group, only the percentage of positive cells was scored [6], and the average value was taken as the staining score [7]: <15%=negative, 16–30%=weak positive, more than 30% =strong positive.
Statistical analysis
SPSS17.0 software was applied for data analysis and measurement data are expressed as χ̄±s and were compared by ANOVA. Count data are expressed by relative number and were compared by chi-square test. Survival differences between the STMN1 and MKI67 gene high and low expression group were analyzed by log rank test, and P<0.05 was regarded as indicating a statistically significant difference.
Results
STMN1 and MKI67 mRNA expression
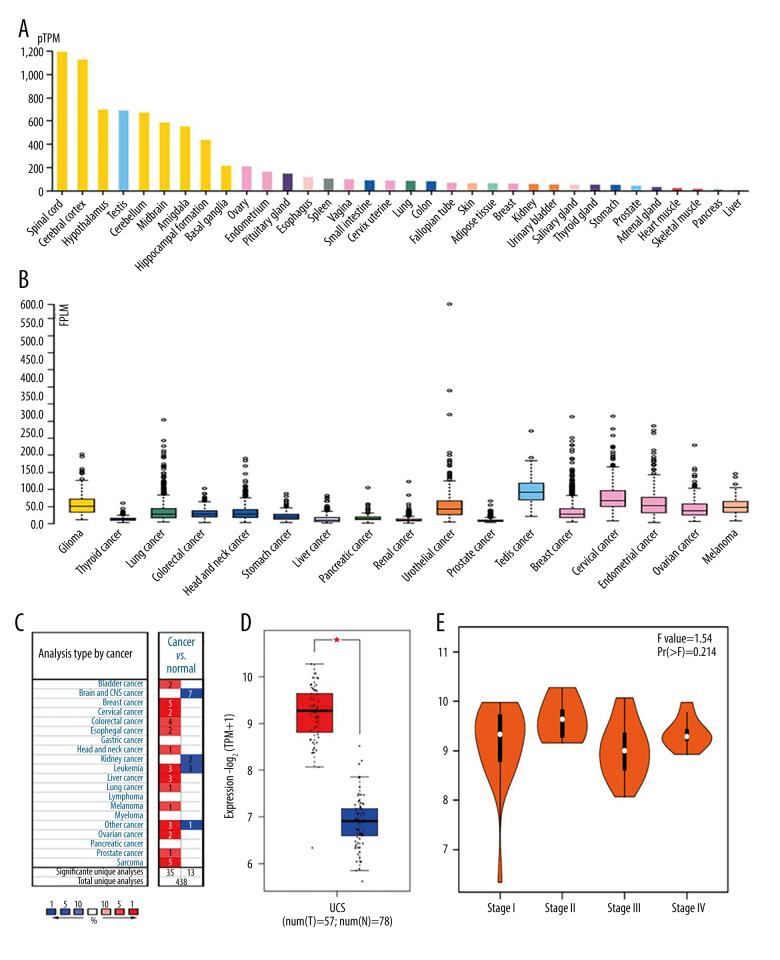
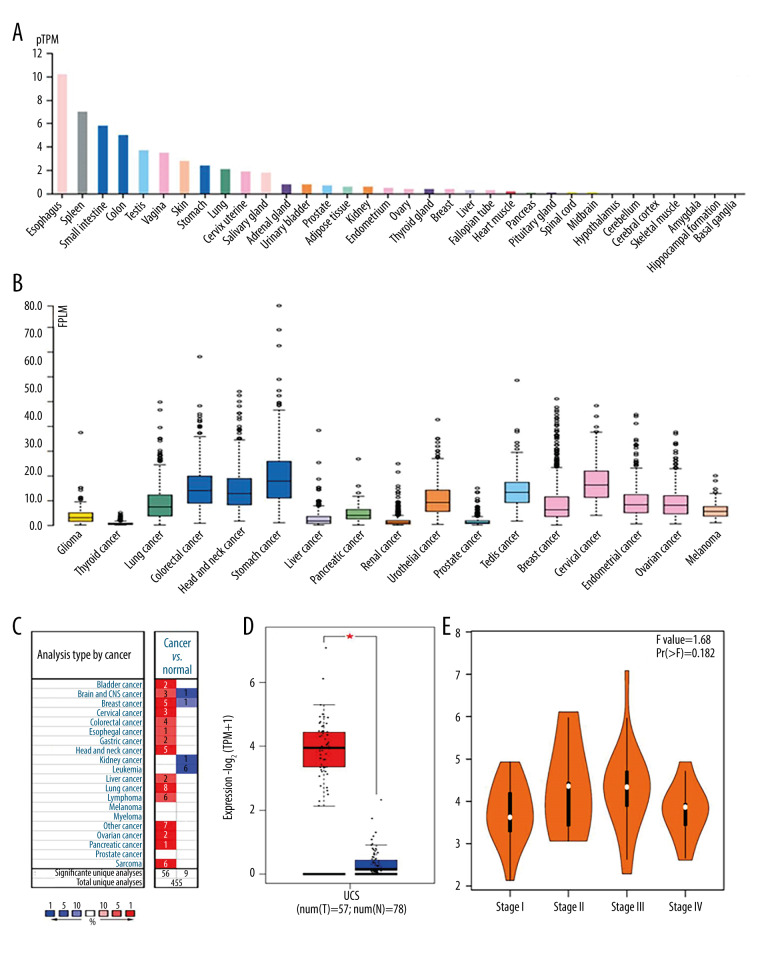
In normal tissues, the expression of STMN1 gene mRNA was highest in the spinal cord, brain, and testis tissues, and the lowest in skeletal muscle, pancreas, and liver tissues (Figure 1A). In tumor tissues, the expression levels were higher in testicular, cervical, and endometrial cancers (Figure 1B). In uterine leiomyosarcoma, the expression level of STMN1 mRNA in cancer tissue was significantly higher than that of normal uterine smooth muscle tissue (Figure 1C, 1D). However, the expression level of STMN1 gene mRNA was not related to the clinical stages of uterine sarcoma (P=0.214) (Figure 1E). For the MKI67 gene, the mRNA expression in uterine leiomyosarcoma tissue was also significantly higher than that of normal uterine smooth muscle tissue (Figure 2).
Figure 1.
Expression of STMN1 gene in normal and different tumor tissues (A: Expression of STMN1 gene in normal tissues; B: Expression of STMN1 gene mRNA in various tumor tissues; C: Expression comparison of STMN1 gene mRNA in uterine leiomyosarcoma and corresponding normal tissues; D: STMN1 gene mRNA expression in cancer tissue was significantly higher than in the corresponding normal tissue of uterine leiomyosarcoma; E: STMN1 gene mRNA expression in different clinical stages of uterine leiomyosarcoma).
Figure 2.
Expression of MKI67 gene in normal and different tumor tissues (A: Expression of MKI67 gene in normal tissues; B: Expression of MKI67 gene mRNA in various tumor tissues; C: Expression comparison of MKI67 gene mRNA in leiomyosarcoma of uterus and corresponding normal tissues; D: MKI67 gene mRNA expression in cancer tissue was significantly higher than in the corresponding normal tissue of uterine leiomyosarcoma; E: MKI67 gene mRNA expression in different clinical stages of uterine leiomyosarcoma).
PPI network of STMN1 and MKI67
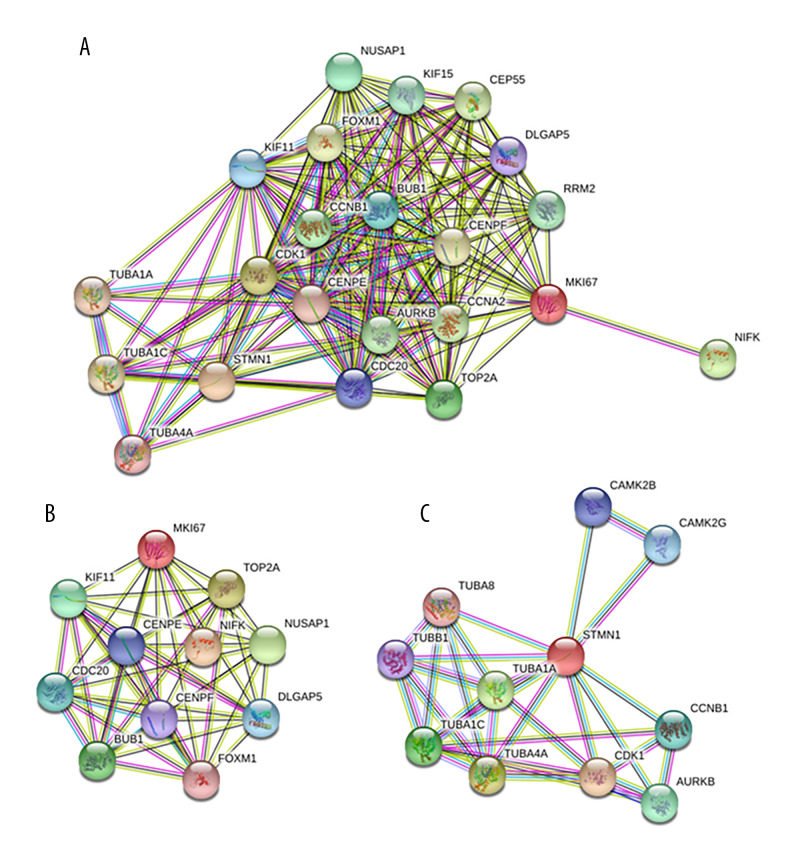
Through searching the STRING database, a protein–protein interaction (PPI) network of STMN1 and MKI67 was constructed. There were 20 proteins closely interacting with STMN1 and MKI67, and the protein–protein interaction network was significantly enriched (P<0.05) (Figure 3).
Figure 3.
Protein–protein interaction network (PPI) of STMN1 and MKI67(A: Both STMN1 and MKI67 interaction proteins included in the PPI; B: Only MKI67 interaction proteins included in the PPI; C: Only STMN1 interaction proteins included in the PPI)
STMN1 and MKI67 co-expression analysis
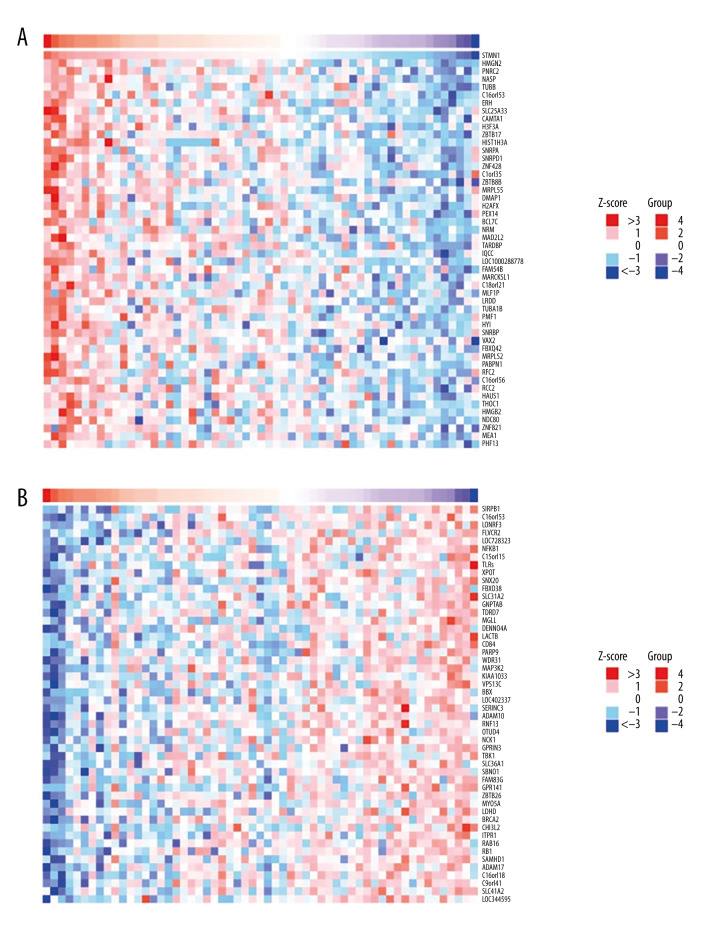
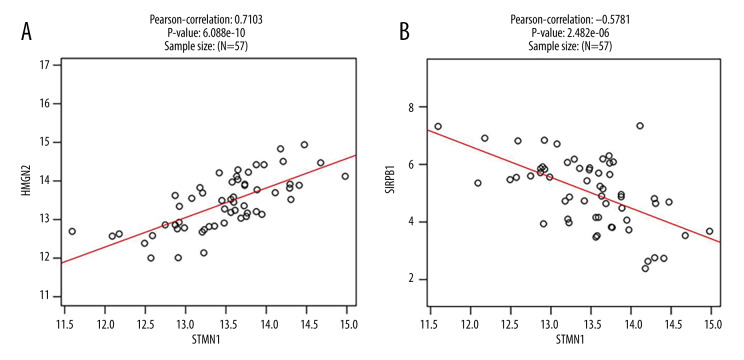
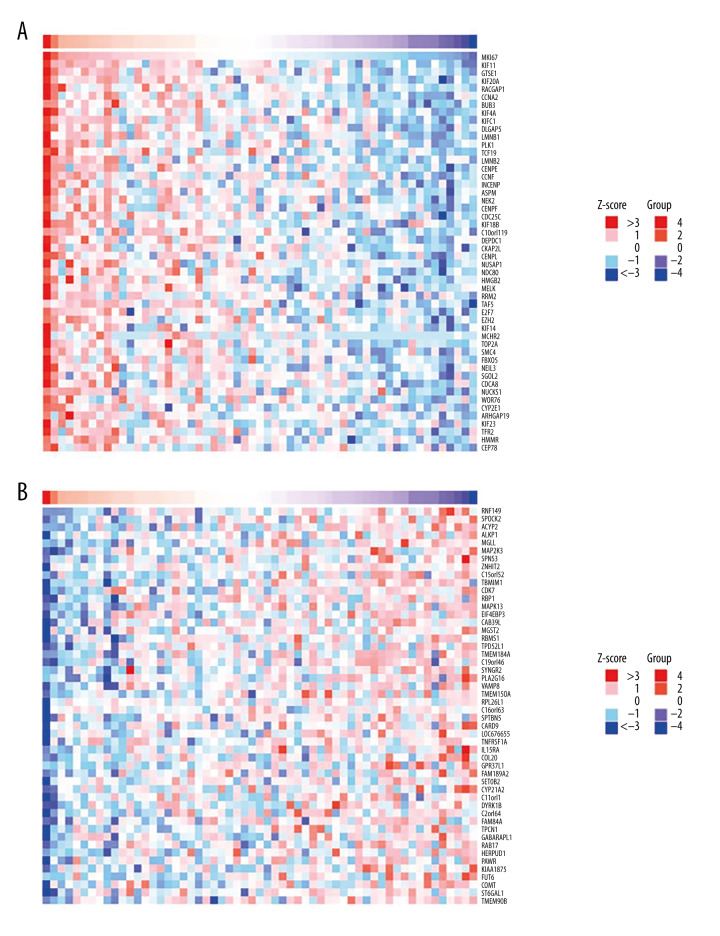
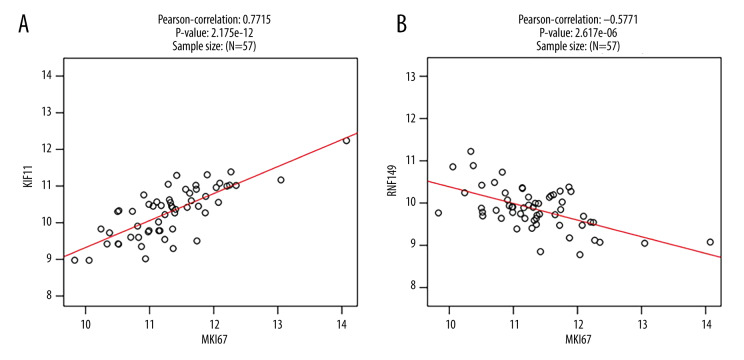
Cluster analysis was carried out on positive and negative expression of the STMN1 gene (Figure 4). The strongest positive correlation was found between STMN2 and STMN1 gene (r=0.710, P<0.05) (Figure 5A). The strongest negative correlation was found between SIRPB1 and STMN1 (r=−0.578, P<0.05) (Figure 5B) [9]. For the MKI67 gene, there was a positive correlative with KIF11 (r=0.771, P<0.05) and negative correlation with RNF149 (r=−0.577, P<0.05) (Figures 6, 7).
Figure 4.
STMN1 gene co-expression analysis (A: Positive correlation gene co-expression heat-map; B: Negative correlation gene co-expression heat-map).
Figure 5.
STMN1 gene co-expression scatter plot (A: Positive correlation gene co-expression; B: Negative correlation gene co-expression).
Figure 6.
MKI67 gene co-expression analysis (A: Positive correlation gene co-expression heat-map; B: Negative correlation gene co-expression heat-map).
Figure 7.
MKI67 gene co-expression scatter plot (A: Positive correlation gene co-expression; B: Negative correlation gene co-expression).
Gene ontology (GO) enrichment
STMN1 and MKI67 were mainly enriched in the mitotic cell cycle, mitotic cell cycle process, and cell cycle for biological process (Table 1); enriched in the microtubule cytoskeleton, spindle, and cytoskeletal part for cellular component (Table 2); and mainly enriched in the kinase binding, purine ribonucleotide binding, and histone kinase activity for molecular function (Table 3).
Table 1.
GO enrichment of STMN1 and MKI67 in biological process.
| Description | Gene count | Background gene count | False discovery rate | Gene ratio |
|---|---|---|---|---|
| Mitotic cell cycle | 19 | 628 | 7.68E-23 | 0.030255 |
| Mitotic cell cycle process | 18 | 564 | 8.07E-22 | 0.031915 |
| Cell cycle | 20 | 1263 | 1.22E-19 | 0.015835 |
| Cell division | 15 | 483 | 2.76E-17 | 0.031056 |
| Regulation of cell cycle process | 15 | 684 | 3.20E-15 | 0.02193 |
| Regulation of cell cycle | 17 | 1129 | 3.20E-15 | 0.015058 |
| Microtubule-based process | 13 | 605 | 1.27E-12 | 0.021488 |
| Regulation of mitotic cell cycle | 13 | 608 | 1.27E-12 | 0.021382 |
| Chromosome segregation | 10 | 253 | 8.82E-12 | 0.039526 |
| Regulation of nuclear division | 9 | 184 | 2.88E-11 | 0.048913 |
Table 2.
GO enrichment of STMN1 and MKI67 in cellular component.
| Description | Gene count | Background gene count | False discovery rate | Gene ratio |
|---|---|---|---|---|
| Microtubule cytoskeleton | 15 | 1118 | 4.04E-12 | 0.013417 |
| Spindle | 10 | 322 | 6.46E-11 | 0.031056 |
| Cytoskeletal part | 15 | 1547 | 1.46E-10 | 0.009696 |
| Microtubule | 10 | 385 | 1.81E-10 | 0.025974 |
| Intracellular non-membrane-bounded organelle | 19 | 4005 | 1.90E-09 | 0.004744 |
| Condensed chromosome | 7 | 215 | 5.02E-08 | 0.032558 |
| Spindle pole | 6 | 150 | 1.82E-07 | 0.04 |
| Centrosome | 8 | 468 | 2.72E-07 | 0.017094 |
| Condensed chromosome, centromeric region | 5 | 117 | 1.95E-06 | 0.042735 |
| Spindle microtubule | 4 | 47 | 2.52E-06 | 0.085106 |
Table 3.
GO enrichment of STMN1 and MKI67 in molecular function.
| Description | Gene count | Background gene count | False discovery rate | Gene ratio |
|---|---|---|---|---|
| Kinase binding | 7 | 678 | 0.00014 | 0.010324 |
| Purine ribonucleotide binding | 11 | 1853 | 0.00014 | 0.005936 |
| Histone kinase activity | 3 | 16 | 0.00014 | 0.1875 |
| Purine ribonucleoside triphosphate binding | 11 | 1794 | 0.00014 | 0.006132 |
| Nucleoside-triphosphatase activity | 7 | 778 | 0.00021 | 0.008997 |
| Tubulin binding | 5 | 344 | 0.00031 | 0.014535 |
| Protein kinase binding | 6 | 599 | 0.00034 | 0.010017 |
| Protein C-terminus binding | 4 | 194 | 0.00046 | 0.020619 |
| ATP binding | 8 | 1462 | 0.00083 | 0.005472 |
| Microtubule binding | 4 | 253 | 0.001 | 0.01581 |
KEGG pathway enrichment
STMN1 and MKI67 genes were mainly enriched in the pathways of cell cycle, gap junction, and progesterone-mediated oocyte maturation (Figure 8, Table 4).
Figure 8.
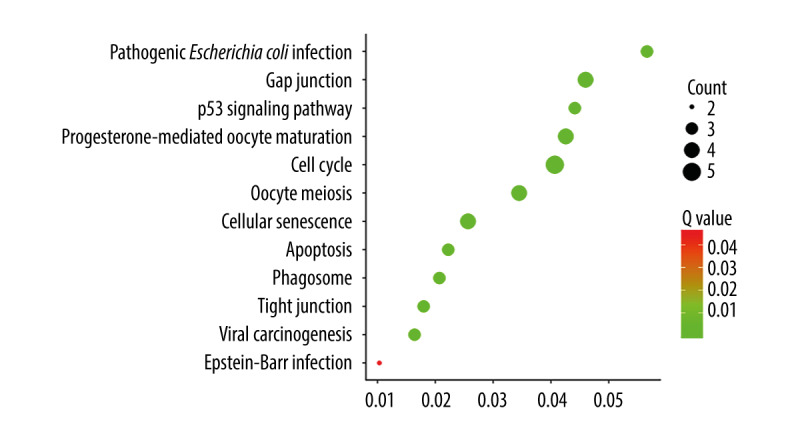
Bubble plot of KEGG pathway enrichment for STMN1 and MKI67.
Table 4.
KEGG pathway enrichment for STMN1 and MKI67.
| Description | Count | Q value | Gene ratio |
|---|---|---|---|
| Cell cycle | 5 | 7.16E-06 | 0.04065 |
| Gap junction | 4 | 4.04E-05 | 0.045977 |
| Progesterone-mediated oocyte maturation | 4 | 4.04E-05 | 0.042553 |
| Oocyte meiosis | 4 | 6.07E-05 | 0.034483 |
| Cellular senescence | 4 | 0.00015 | 0.025641 |
| Pathogenic Escherichia coli infection | 3 | 0.00015 | 0.056604 |
| p53 signaling pathway | 3 | 0.00026 | 0.044118 |
| Apoptosis | 3 | 0.0016 | 0.022222 |
| Phagosome | 3 | 0.0018 | 0.02069 |
| Tight junction | 3 | 0.0024 | 0.017964 |
| Viral carcinogenesis | 3 | 0.0028 | 0.016393 |
| Epstein-Barr virus infection | 2 | 0.0454 | 0.010309 |
Survival analysis
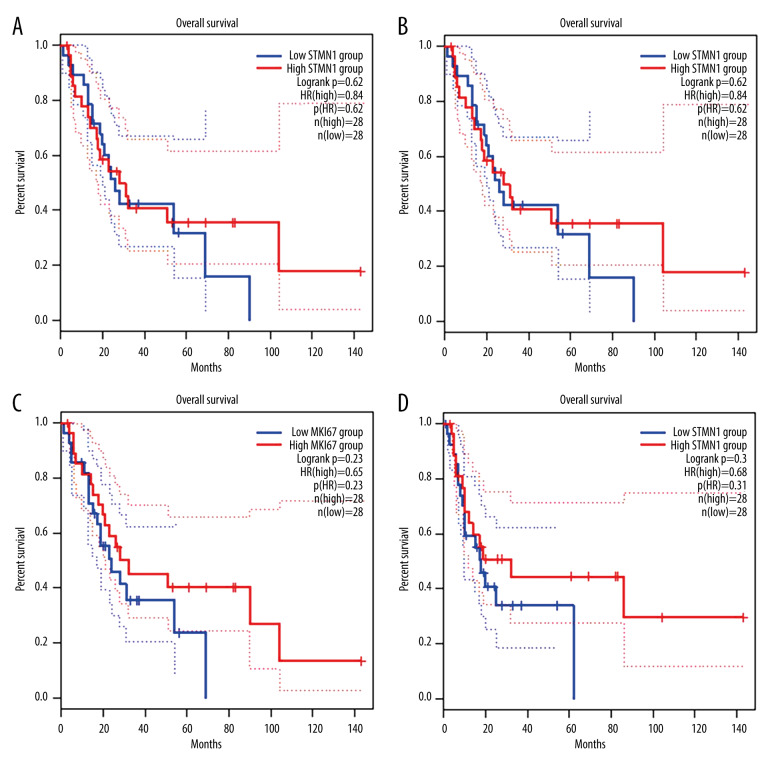
According to the median expression of STMN1 and MKI67 gene mRNA in uterine leiomyosarcoma, the patients were divided into high and low expression groups. The prognosis analysis showed that the high and low expression of STMN1 and MKI67 gene mRNA was not related to overall or disease-free survival (P>0.05) (Figure 9).
Figure 9.
Survival curve of STMN1 and MKI67 expression and patient prognosis (A: Overall survival between STMN1 high and low expression group; B: Disease-free survival between STMN1 high and low expression group; C: Overall survival between MKI67 high and low expression group; D: Disease-free survival between MKI67 high and low expression group).
STMN1 and MKI67 expression examined by real-time PCR and IHC assay
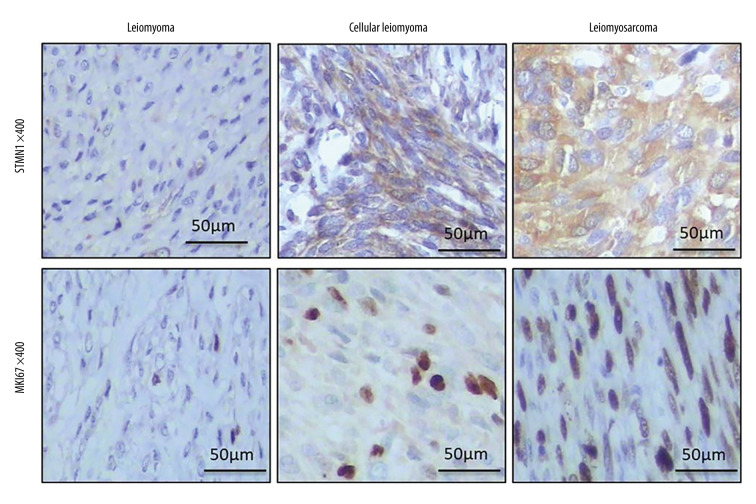
Real-time PCR results indicated that STMN1 and MKI67 mRNA levels were significantly different in the uterine normal smooth muscle tissue (UNSM), uterine leiomyoma (UL), uterine cellular leiomyoma (UCL), and uterine leiomyosarcoma (ULS) (Figure 10). STMN1 protein was mainly positively expressed in the cytoplasm of tumor cells with light-yellow or brownish-brown granules. MKI67 protein positive reaction was mainly located in the nucleus of tumor cells with light-yellow or brownish-brown granules (Figure 11). The positive rate of STMN1 protein in uterine leiomyosarcoma was 100.00%, which was significantly higher than that of the other 3 groups (χ2=11.72, P=0.008). However, there was no significant difference in positive expression of STMN1 protein among the UNSM, UL, and UCL groups (χ2 UNSM, UL=1.76, P=0.18; χ2 UNSM, UCL=0.98, P=0.30; χ2 UL, UCL=0.07, P=0.79) (Table 5). The positive rate of KIM67 protein in uterine leiomyosarcoma was 77.78%, which was significantly higher than that of the other 3 groups (χ2=48.89, P=0.000). However, there was no significant difference between UNSM and UL in KIM67-positive rate (χ2 UNSM, UL=1.02, P=0.31) (Table 5).
Figure 10.
Scatter plot of STMN1 and MIKI67 mRNA relative expression (A: STMN1 mRNA relative expression; B: MKI67 mRNA relative expression). ** p<0.001
Figure 11.
STMN1 and MKI67 expression examined by IHC assay.
Table 5.
STMN1 and MKI67 expression rate in NSMU, LU, CLU and LSU groups.
| Group | n | STMN1 | MKI67 | ||
|---|---|---|---|---|---|
| Negative | Positive | Negative | Positive | ||
| NSMU | 30 | 14 | 16 | 30 | 0 |
| LU | 30 | 9 | 21 | 29 | 1 |
| CLU | 24 | 8 | 16 | 18 | 6 |
| LSU | 18 | 0 | 18 | 4 | 14 |
NSMU – normal smooth muscular tissue of uterus; LU – leiomyoma of uterus; CLU – cellular leiomyoma of uterus; LSU – leiomyosarcoma of uterus.
Correlation between STMN1, MKI67 expression, clinical features, and prognosis
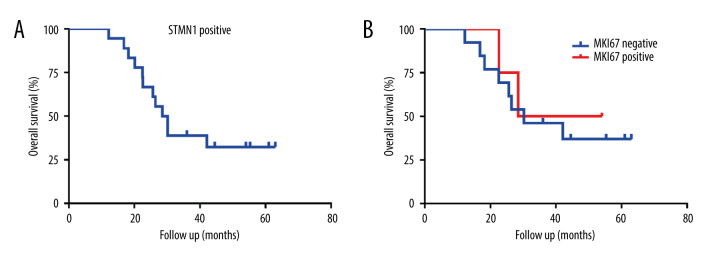
There was no significant correlation between STMN1 and MKI67 expression and patient age, tumor diameter, tumor numbers, and clinical stages in the 4 groups (Table 6). STMN1 was positively expressed in all the uterine leiomyosarcoma patients. The median OS of STMN1-positive patients was 28.5 months. For MKI67, the median OS was 28.5 and 30.2 months for patients with MKI67-positive and -negative expression, respectively, but the difference was not significantly different (HR=1.34, p=0.68) (Figure 12).
Table 6.
Correlation between STMN1, MKI67 expression and clinical features.
| Group | Features | STMN1 | MKI67 | ||
|---|---|---|---|---|---|
| rs | P | rs | P | ||
| NSMU | Age | 0.163 | 0.389 | 0.012 | 0.951 |
| LU | Age | 0.075 | 0.693 | −0.113 | 0.553 |
| Tumor diameter | −0.210 | 0.265 | 0.299 | 0.109 | |
| Tumor number | 0.238 | 0.205 | −0.288 | 0.122 | |
| CLU | Age | −0.194 | 0.363 | −0.357 | 0.087 |
| Tumor diameter | −0.040 | 0.854 | −0.160 | 0.456 | |
| Tumor number | 0.252 | 0.235 | 0.165 | 0.442 | |
| LSU | Age | 0.414 | 0.088 | 0.285 | 0.252 |
| Clinical stage | 0.414 | 0.088 | 0.316 | 0.202 | |
NSMU – normal smooth muscular tissue of uterus; LU – leiomyoma of uterus; CLU – cellular leiomyoma of uterus; LSU – leiomyosarcoma of uterus.
Figure 12.
The overall survival of uterine leiomyosarcoma patients with STMN1 and MKI67 expression (A: Survival curve of STMN1-positive uterine leiomyosarcoma patients; B: Survival curve comparison of MKI67-positive and -negative uterine leiomyosarcoma patients).
Diagnostic efficacy of STMN1 and MKI67 as biomarkers
The diagnostic sensitivity and specificity were 77.78% and 90.74% for STMN1 and MKI67, respectively, with positive predictive value and negative predictive value of 73.68% and 92.45%, respectively (Table 7).
Table 7.
Diagnostic efficacy of STMN1, MKI67 as biomarker for STMN1, MKI67.
| Gene | Expression | Benign | Malignant | SEN (%) | SPE (%) | PPV (%) | NPV (%) |
|---|---|---|---|---|---|---|---|
| STMN1 | 100.00 | 31.48 | 32.73 | 100.00 | |||
| Positive | 37 | 18 | |||||
| Negative | 17 | 0 | |||||
| MKI67 | 77.78 | 87.04 | 66.67 | 92.16 | |||
| Positive | 7 | 14 | |||||
| Negative | 47 | 4 | |||||
| STMN1+ MKI67 | 77.78 | 90.74 | 73.68 | 92.45 | |||
| Positive | 5 | 14 | |||||
| Negative* | 49 | 4 | |||||
Either STMN1 negative or MKI67 negative.
SEN – sensitivity; SEP – specificity; PPV – positive predictive value; NPV – negative predictive value.
Discussion
This study assessed the expression of STMN1 and MKI67 in uterine smooth muscle tumors and their relationship with patients’ clinical characteristics. The expression of STMN1 and MKI67 in uterine smooth muscle tumors was evaluated by immunohistochemical assay. The results showed that STMN1 and MKI67 were expressed at low levels in the myometrium, leiomyoma, and cell-rich smooth muscle tumors, but they were highly expressed in leiomyosarcoma. Further analysis demonstrated the expression of STMN1 and MKI67 in uterine smooth muscle tumors was not correlated with patient age, tumor size, or leiomyosarcoma clinical stages. The STMN1-positive expression rate in the diagnosis of uterine leiomyosarcoma were 100% and 31.48%, respectively, which was consistent with results of a 2015 study by Allen et al. [7]. Although the pathological diagnosis of most cases is mainly based on the HE staining of specimens, there are special types of uterine smooth muscle tumors, such as uterine highly cellular smooth muscle tumors, and uterine malignant potential uncertain smooth muscle tumors, for which the immunohistochemical assay cannot improve the diagnosis. STMN1 expression in uterine leiomyosarcoma has high sensitivity but low specificity. Compared with Allen [7] and other studies that only detected STMN1 and smooth muscle tumor of the uterus, our study combined the detection of MKI67 and STMN1 to improve the specificity for early diagnosis of uterine leiomyosarcoma.
Uterine smooth muscle tumor is the most commonly diagnosed neoplasm in gynecology. It can be divided into 3 categories: benign uterine leiomyoma, uterine leiomyosarcoma, and borderline uterine leiomyoma. One of the most common borderline leiomyomas is uterine cell-rich smooth muscle tumor. Under the microscope, the smooth muscle tumor with rich cells in the uterus shows that the tumor cells are rich, closely arranged, and braided. The size and morphology of the cells are still the same. There is no or little heteromorphism. It is difficult to distinguish a high cell-rich smooth muscle tumor from leiomyosarcoma. Uterine leiomyosarcoma, although rare, has a high degree of malignancy, accounting for 2% to 4% of the malignant tumors of the uterus and 1% of the malignant tumors of the female reproductive system [10], most of which have an extremely poor prognosis [11]. Carcinogenesis is a complex process with many factors and steps, in which many genes and factors participate. Among them, abnormal cell cycle regulation and chromosome instability have been proved to be important topics in oncology. Microtubule depolymerization protein STMN1 is a cell regulatory factor that can change the dynamic balance of the microtubule system by phosphorylation. STMN1 can promote the proliferation, differentiation, and invasion of tumor cells, which are involved in tumor prognosis [12–14]. STMN1 is overexpressed in ovarian cancer [15,16], endometrial cancer [17–19], and cervical cancer [20,21] and its expression level is negatively correlated with the therapeutic effect and prognosis of Taxol chemotherapy drugs. MKI67 is a cell cycle regulatory protein that is a marker of proliferative cell nuclei and is an indicator of tumor proliferation rate. With increased MKI67 expression level, the proliferation activity of tumor cells is also increased. Excessive cell division and proliferation have been proved to be an important part of malignant transformation. MKI67 is highly expressed in ovarian cancer [22], endometrial cancer [23–25], and cervical cancer [26–28], and is positively correlated with aggressive pathological factors such as advanced clinical stages, histological type, tumor differentiation, and myometrial invasion, and negatively correlated with prognosis. However, in the present study, we did not find a correlation between high expression of STMN1 and MKI67 and overall survival or disease-free survival in patients with uterine leiomyosarcoma. These negative results may due to the small sample size and limited statistical power. Our work has certain limitations. In the bioinformatics analysis part, the original data did not provide any information about serum STMN1 and MKI67 genes expression. All of the data about STMN1 and MKI67 genes expression were examined in the tumor and corresponding tissue. Therefore, we were unable to investigate the serum STMN1 and MKI67 genes expression level, and the clinical ability to predict the risk of sarcoma prior to surgery was limited. Another limitation is that gene expression testing needed to be performed in pretreatment biopsy specimens. However, biopsy is not recommended before surgery due to possible seeding of uterine leiomyosarcoma, which is highly malignant. Therefore, detection of expression of these genes difficult in clinical practice.
Conclusions
The results of this study indicated that TMN1 and MKI67 are upregulated in uterine leiomyosarcoma and play important roles in its development. The combined detection of STMN1 and MKI67 has clinical importance in the early diagnosis of uterine leiomyosarcoma.
Footnotes
Source of support: This work was supported by the Wenzhou Science and Technology Project (Y20160361)
References
- 1.Bacanakgil BH, Deveci M, Karabuk E, Soyman Z. Uterine smooth muscle tumor of uncertain malignant potential: Clinicopathologic-sonographic characteristics, follow-up and recurrence. World J Oncol. 2017;8:76–80. doi: 10.14740/wjon1031w. [DOI] [PMC free article] [PubMed] [Google Scholar]
- 2.Suzuki K, Watanabe A, Araki K, et al. High STMN1 expression is associated with tumor differentiation and metastasis in clinical patients with pancreatic cancer. Anticancer Res. 2018;38:939–44. doi: 10.21873/anticanres.12307. [DOI] [PubMed] [Google Scholar]
- 3.Wang J, Yao Y, Ming Y, et al. Downregulation of stathmin 1 in human gallbladder carcinoma inhibits tumor growth in vitro and in vivo. Sci Rep. 2016;6:28833. doi: 10.1038/srep28833. [DOI] [PMC free article] [PubMed] [Google Scholar]
- 4.Niotis A, Tsiambas E, Fotiades PP, et al. ki-67 and Topoisomerase IIa proliferation markers in colon adenocarcinoma. J BUON. 2018;23:24–27. [PubMed] [Google Scholar]
- 5.Menon SS, Guruvayoorappan C, Sakthivel KM, Rasmi RR. Ki-67 protein as a tumour proliferation marker. Clin Chim Acta. 2019;491:39–45. doi: 10.1016/j.cca.2019.01.011. [DOI] [PubMed] [Google Scholar]
- 6.Sales GR, Vagnarelli P. Ki-67: More hidden behind a ‘classic proliferation marker’. Trends Biochem Sci. 2018;43:747–48. doi: 10.1016/j.tibs.2018.08.004. [DOI] [PubMed] [Google Scholar]
- 7.Allen MM, Douds JJ, Liang SX, et al. An immunohistochemical analysis of stathmin 1 expression in uterine smooth muscle tumors: Differential expression in leiomyosarcomas and leiomyomas. Int J Clin Exp Pathol. 2015;8:2795–801. [PMC free article] [PubMed] [Google Scholar]
- 8.Hoffmann R, Valencia A. A gene network for navigating the literature. Nat Genet. 2004;36:664. doi: 10.1038/ng0704-664. [DOI] [PubMed] [Google Scholar]
- 9.Vasaikar SV, Straub P, Wang J, Zhang B. LinkedOmics: Analyzing multi-omics data within and across 32 cancer types. Nucleic Acids Res. 2018;46:D956–63. doi: 10.1093/nar/gkx1090. [DOI] [PMC free article] [PubMed] [Google Scholar]
- 10.Siegel RL, Miller KD, Jemal A. Cancer statistics, 2019. Cancer J Clin. 2019;69:7–34. doi: 10.3322/caac.21551. [DOI] [PubMed] [Google Scholar]
- 11.Veras E, Zivanovic O, Jacks L, et al. “Low-grade leiomyosarcoma” and late-recurring smooth muscle tumors of the uterus: A heterogenous collection of frequently misdiagnosed tumors associated with an overall favorable prognosis relative to conventional uterine leiomyosarcomas. Am J Surg Pathol. 2011;35:1626–37. doi: 10.1097/PAS.0b013e31822b44d2. [DOI] [PubMed] [Google Scholar]
- 12.Lin X, Liao Y, Chen X, et al. Regulation of oncoprotein 18/stathmin signaling by ERK concerns the resistance to taxol in nonsmall cell lung cancer cells. Cancer Biother Radiopharm. 2016;31:37–43. doi: 10.1089/cbr.2015.1921. [DOI] [PubMed] [Google Scholar]
- 13.Golouh R, Cufer T, Sadikov A, et al. The prognostic value of Stathmin-1, S100A2, and SYK proteins in ER-positive primary breast cancer patients treated with adjuvant tamoxifen monotherapy: An immunohistochemical study. Breast Cancer Res Treat. 2008;110:317–26. doi: 10.1007/s10549-007-9724-3. [DOI] [PubMed] [Google Scholar]
- 14.Miceli C, Tejada A, Castaneda A, Mistry SJ. Cell cycle inhibition therapy that targets stathmin in in vitro and in vivo models of breast cancer. Cancer Gene Ther. 2013;20:298–307. doi: 10.1038/cgt.2013.21. [DOI] [PubMed] [Google Scholar]
- 15.Su D, Smith SM, Preti M, Schwartz P, et al. Stathmin and tubulin expression and survival of ovarian cancer patients receiving platinum treatment with and without paclitaxel. Cancer. 2009;115:2453–63. doi: 10.1002/cncr.24282. [DOI] [PubMed] [Google Scholar]
- 16.Sonego M, Schiappacassi M, Lovisa S, et al. Stathmin regulates mutant p53 stability and transcriptional activity in ovarian cancer. EMBO Mol Med. 2013;5:707–22. doi: 10.1002/emmm.201201504. [DOI] [PMC free article] [PubMed] [Google Scholar]
- 17.Werner HM, Trovik J, Halle MK, et al. Stathmin protein level, a potential predictive marker for taxane treatment response in endometrial cancer. PLoS One. 2014;9:e90141. doi: 10.1371/journal.pone.0090141. [DOI] [PMC free article] [PubMed] [Google Scholar]
- 18.Wik E, Birkeland E, Trovik J, et al. High phospho-Stathmin(Serine38) expression identifies aggressive endometrial cancer and suggests an association with PI3K inhibition. Clin Cancer Res. 2013;19:2331–41. doi: 10.1158/1078-0432.CCR-12-3413. [DOI] [PubMed] [Google Scholar]
- 19.Trovik J, Wik E, Stefansson IM, et al. Stathmin overexpression identifies high-risk patients and lymph node metastasis in endometrial cancer. Clin Cancer Res. 2011;17:3368–77. doi: 10.1158/1078-0432.CCR-10-2412. [DOI] [PubMed] [Google Scholar]
- 20.Kong SF, Lv T, Sun X, et al. Suppressing stathmin-l can inhibit chkl protein expression and reduce the invasion and tumorigenicity of cervical cancer cells. Eur J Gynaecol Oncol. 2017;38:271–76. [PubMed] [Google Scholar]
- 21.Wang X, Ren JH, Lin F, et al. Stathmin is involved in arsenic trioxide-induced apoptosis in human cervical cancer cell lines via PI3K linked signal pathway. Cancer Biol Ther. 2010;10:632–43. doi: 10.4161/cbt.10.6.12654. [DOI] [PubMed] [Google Scholar]
- 22.Liu P, Sun YL, Du J, et al. CD105/Ki67 coexpression correlates with tumor progression and poor prognosis in epithelial ovarian cancer. Int J Gynecol Cancer. 2012;22:586–92. doi: 10.1097/IGC.0b013e31823c36b8. [DOI] [PubMed] [Google Scholar]
- 23.Di Donato V, Iacobelli V, Schiavi MC, et al. Impact of hormone receptor status and Ki-67 expression on disease-free survival in patients affected by high-risk endometrial cancer. Int J Gynecol Cancer. 2018;28:505–13. doi: 10.1097/IGC.0000000000001191. [DOI] [PubMed] [Google Scholar]
- 24.Kitson S, Sivalingam VN, Bolton J, et al. Ki-67 in endometrial cancer: Scoring optimization and prognostic relevance for window studies. Mod Pathol. 2017;30:459–68. doi: 10.1038/modpathol.2016.203. [DOI] [PMC free article] [PubMed] [Google Scholar]
- 25.Apostolou G, Apostolou N, Biteli M, et al. Utility of Ki-67, p53, Bcl-2, and Cox-2 biomarkers for low-grade endometrial cancer and disordered proliferative/benign hyperplastic endometrium by imprint cytology. Diagn Cytopathol. 2014;42:134–42. doi: 10.1002/dc.23010. [DOI] [PubMed] [Google Scholar]
- 26.Ovestad IT, Dalen I, Hansen E, et al. Clinical value of fully automated p16/Ki-67 dual staining in the triage of HPV-positive women in the Norwegian Cervical Cancer Screening Program. Cancer Cytopathol. 2017;125:283–91. doi: 10.1002/cncy.21807. [DOI] [PubMed] [Google Scholar]
- 27.Chen CC, Huang LW, Bai CH, Lee CC. Predictive value of p16/Ki-67 immunocytochemistry for triage of women with abnormal Papanicolaou test in cervical cancer screening: A systematic review and meta-analysis. Ann Saudi Med. 2016;36:245–51. doi: 10.5144/0256-4947.2016.245. [DOI] [PMC free article] [PubMed] [Google Scholar]
- 28.Luttmer R, Dijkstra MG, Snijders PJ, et al. p16/Ki-67 dual-stained cytology for detecting cervical (pre)cancer in a HPV-positive gynecologic outpatient population. Mod Pathol. 2016;29:870–78. doi: 10.1038/modpathol.2016.80. [DOI] [PubMed] [Google Scholar]


