

SUMMARY
Clinical actigraphy devices provide adequate estimates of some sleep measures across large groups. In practice, providers are asked to apply clinical or consumer wearable data to individual patient assessments. Inter-individual variability in device performance will impact such patient-specific interpretation. We assessed two devices, clinical and consumer, to determine the magnitude and predictors of this individual-level variability. One hundred two patients (55 (53.9%) female, 56.4 (±16.3) years old) patients undergoing polysomnography wore Jawbone UP3 and/or Actiwatch2. Device total sleep time (TST), sleep efficiency (SE), wake after sleep onset (WASO), and sleep latency (SOL) were compared with polysomnography. Demographics, sleep architecture, and clinical measures were compared to device performance. Actiwatch overestimated TST by 27.2 minutes (95% confidence limits 138.3 minutes over to 84.0 under), overestimated SE by 6.8% (95% CL 34.1% over to 20.5% under), overestimated SOL by 2.6 minutes (95% CL 63.3 over to 58.2 under), and underestimated WASO by 50.7 minutes (95% CL 162.5 under to 61.2 over). Jawbone overestimated TST by 59.1 minutes (95% CL 208.6 minutes over to 90.5 under) and overestimated SE by 14.9% (95% CL 52.6% over to 22.7% under). In multivariate models, age, SOL, WASO, % N1, and AHI explained only some of the variance in device performance. Gender also affected performance. Actiwatch and Jawbone mis-estimate sleep measures with very wide confidence limits and accuracy varies with on multiple patient-level characteristics. Given these large individual inaccuracies, data from these devices must be applied only with extreme caution in clinical practice.
Keywords: sleep measurement, wearables, variability, accuracy, patient-specific factors
INTRODUCTION
Electroencephalographic (EEG)-based measures of sleep during polysomnography (PSG) are the gold-standard for assessing sleep-wake state in patients suspected of having sleep disorders (Rechtschaffen and Kales, 1968). However, this testing carries substantial costs in time, personnel, and equipment. A technician must apply multiple skin electrodes and ensure adequate signal quality with low impedences, and then patients must attempt to sleep while wearing bulky and sometimes uncomfortable equipment, typically in a sleep laboratory instead of their home environment. Raw data must be visually inspected and manually scored by a trained technician, then interpreted by a board-certified physician. Because of the costs involved, only a single night of testing is typically performed, which in many cases is not representative of habitual sleep (Toussaint et al., 1995).
As a result, the move toward at-home testing with alternate data collection strategies has gained considerable momentum. The most widely adopted in clinical practice has been home sleep apnea testing, in which monitoring of respiration, typically without EEG, can be performed in the home setting to assess for obstructive sleep apnea. Although there are limitations to this testing, particularly with respect to accuracy in patients with comorbid cardiopulmonary disease, this home-based testing has been validated as an appropriate method of diagnostic testing in defined populations (Kapur et al., 2017).
Actigraphy devices capture movement, typically through a wristwatch-like device. Using a variety of algorithms, these devices can estimate sleep measures based on the assumption that sleep is a state of low movement and wake is a state of high movement. As such, actigraphy has been proposed as an ambulatory, at-home alternative to in-laboratory measures of key sleep indices, such as total sleep time (TST) and sleep efficiency (SE). In population-based studies, actigraphy generally performs well on average compared to PSG, for example with large, community-based studies showing a difference between PSG-measured and actigraphically-estimated TST of only 12–13 minutes (Matthews et al., 2018).
Performance of actigraphy in clinical populations might be different than in population-based studies, because of a difference in the frequency of sleep disorders. Yet multiple studies of actigraphy in clinical populations have been performed and, taken together, suggest that, especially for TST, there is good correspondence between PSG and actigraphy measures. For example, a recent meta-analysis of insomnia studies comparing actigraphic and PSG TST measures found a mean difference of only 9.5 minutes between these tests, with a 95% CI of −8.1 to 21.7 minutes, including over 600 participants (Smith et al., 2018a). As a result of these and other studies, guidelines state that actigraphy can be clinically useful in evaluating people with insomnia, excessive sleepiness, and circadian rhythm disorders (International Classification of Sleep Disorders, 2014; Smith et al., 2018b).
However, despite multiple studies showing that group averages of some sleep metrics are similar between PSG and actigraphy, wide-spread application of actigraphy to clinical practice requires that actigraphy accurately reflect PSG measures for each individual, not just for the group as a whole. Yet many studies that show good agreement between actigraphy and PSG measures on average have substantial numbers of outliers whose device performance is substantially less accurate (Blackwell et al., 2011;Kolla et al., 2016;Smith et al., 2018a). Thus, studies assessing actigraphy for potential clinical use must emphasize not only average accuracy but the range of accuracy and potential factors that affect this range.
Further, prior work has suggested differences across devices that may be clinically important, suggesting that conclusions may need to be device-specific (Mantua et al., 2016). Complicating this issue are the potential differences between Food and Drug Administration (FDA)-cleared, PSG-validated clinical actigraphy devices and the ever-expanding number of commercial, direct-to-consumer wearable devices such as the Jawbone or Fitbit. This latter group of devices is neither FDA-cleared nor consistently validated, but patient expectations are increasingly that physicians will incorporate data from these devices into their clinical evaluation. The FDA has signaled that it does not intend to regulate general wellness devices unless they are intended for specific clinical populations, which may serve to keep device manufacturers from testing their devices within sleep disorder populations (Kolla et al., 2016). Some of these devices incorporate additional physiologic data, including heart rate and galvanic skin response, into their algorithms, which have the potential to improve diagnostic accuracy but might also introduce new sources of noise and individual variability. Further, the algorithms used by these devices are often proprietary (Kolla et al., 2016), limiting the ability of clinicians to understand exactly what is being measured and how. The American Academy of Sleep Medicine (AASM) has cautioned that these devices cannot supplant current diagnostic tools but encouraged consideration of their benefits for patient engagement and conversations about the importance of sleep (Khosla et al., 2018).
To better understand how actigraphy performs as a PSG-surrogate for sleep metrics in a real world clinical population, we performed a validation study of two different actigraphy devices, one clinical and one marketed directly to consumers, in a large group of patients being studied for suspected sleep disorders. Our aim was to evaluate the inter-individual variability in device accuracy and the potential correlates of this variability.
METHODS
Adult participants (n = 102) undergoing diagnostic PSG, split-night study, or positive airway pressure (PAP) titration were recruited from the Emory Sleep Center. Diagnoses included obstructive sleep apnea (OSA, n=53), a combination of obstructive and central sleep apnea (n=6), isolated central sleep apnea (n=1), idiopathic hypersomnia (n=3), behaviorally-induced insufficient sleep syndrome (n=1), parasomnia (n=2), or nocturnal hypoxia (n=2). Thirty-four participants were studied for suspicion of sleep apnea, but had normal apnea-hypopnea index (AHI) on testing. Characteristics of included participants are shown in Table 1.
TABLE 1:
Patient characteristics
| Mean (standard deviation) or Number (percent) | |
|---|---|
| Age, years | 56.4 (16.3) |
| Female gender | 55 (53.9) |
| Body mass index, kg/m2 | 31.8 (8.0) |
| Epworth Sleepiness Scale score | 9.7 (4.9) |
| Elevated PHQ9 score for depression | 32 (35.6) |
| PSG Total sleep time, minutes | 299.1 (84.1) |
| PSG sleep efficiency, % | 74.8 (16.9) |
| PSG sleep onset latency, minutes | 20.0 (23.9) |
| PSG wake after sleep onset, minutes | 81.6 (64.4) |
| Apnea-hypopnea index | 13.2 (17.0) |
| Periodic limb movements of sleep index | 16.6 (24.0) |
Abbreviations: kg/m2 = kilogram/meter2,PHQ9 = Patient Health Questionnaire-9, PSG = polysomnogram
The Actiwatch 2 (Philips Respironics) is a wearable actigraphy device produced for research and clinical use. It uses an internal accelerometer for movement detection, accompanied by a light sensor. Actiwatch devices were configured for 15-s epochs. Actiware software (version 6.0.8) was set to medium sensitivity for wake detection.
The Jawbone UP3 was a commercially-available device for sale directly to consumers. It derives sleep estimates via accelerometry but additionally contains bio-impedance sensors that measure heart rate, respiration rate, and body temperature, and galvanic skin response. Information on the sleep staging algorithm is not publicly available, but summary sleep measures were obtained via the Jawbone website using de-identified device data. So that each device would fit comfortably at the wrist, participants wore one actigraphy device on each wrist, rather than both on the same wrist. Each PSG used standard electrode placement for electroencephalogram (EEG), electrooculography (EOG), chin and leg electromyogram (EMG), electrocardiography (ECG), respiratory effort, oximetry, body position, airflow, and snoring (Iber et al., 2007). PSGs were manually scored in 30-s epochs by registered sleep technologists using the AASM scoring manual and interpreted by a board-certified sleep specialist.
Because our interest was in the summary measures of sleep that are frequently used in clinical decision-making, TST and SE were obtained from PSG and from each wearable device for analysis, rather than an epoch-by-epoch comparison of PSG and wearable devices. To derive summary measures from the wearable devices, start/end times were set to correspond to the PSG-identified lights-off and lights-on times. These times were used to generate TST and SE directly from the Actiwatch; for the Jawbone, TST was provided by the device and used to generate SE. Sleep efficiency was calculated as TST/ total recording time (TRT). As a result, the imprecision in aligning start/stop time between devices and PSG was +/− 15 seconds for the Actiwatch and +/− 60 seconds for the Jawbone. For the Actiwatch, sleep onset latency (SOL) and wake time after sleep onset (WASO) were also obtained, although these values were not available for the Jawbone at the time of this analysis.
Statistical analyses
Sleep measures estimated by Jawbone and Actiwatch were each compared to PSG measures via Pearson correlation. Difference scores (e.g., PSG_TST – Actiwatch_TST) were calculated to provide a measure of whether the wearable consistently over- or under-estimated each sleep metric compared to PSG. A positive difference score indicates that the wearable device has underestimated the sleep measure. We calculated 95% confidence limits around each mean, i.e., the mean +/− 1.96*standard deviation. We chose to calculate confidence limits as our clinically relevant measure of dispersion, rather than confidence intervals using standard error, because our interest is in applying wearable device data to individual patient decision-making rather than estimating the mean value for a large group of subjects. Bland-Altman plots were constructed to compare each device to PSG on measures of total sleep time and sleep efficiency.
The absolute value of each difference score (e.g., |PSG_TST – Actiwatch_TST|) was also calculated, to provide a measure of amount of imprecision of the wearable devices, regardless of whether the wearable over- or under-estimated the PSG measure. Difference scores and absolute value scores were then examined by demographic, PSG, and clinical features using Pearson correlation for continuous variables and t-tests, corrected for unequal variances when necessary, for categorical variables.
Difference scores for each measure were then assessed using linear regression models, to further assess which clinical and demographic features contributed to device performance. Models were assessed for assumption violations and collinearity. Independent variables initially included were age, gender, AHI, Epworth, PLMI, presence or absence of depression, %N1, %N3, %REM, WASO, and SOL, although the latter was excluded when modeling difference in SOL. Backward elimination was used to determine the most parsimonious model for each dependent variable, with significance for remaining in the model set at 0.05. Because of heteroscedasticity, despite transformations, difference scores for Actiwatch WASO were not further assessed in linear regression.
Depression was defined as a Patient Health Questionnaire-9 (PHQ9) score > 9 (indicates at least moderate depressive symptoms) (Kroenke et al., 2001). Age, body mass index, severity of daytime sleepiness as assessed by Epworth Sleepiness Scale score, AHI, periodic limb movements of sleep, arousal index, and percentage of time spent in each sleep stage were assessed as continuous variables. Analyses were performed using SAS (version 9.4). This study was approved by the Emory Institutional Review Board and all participants provided signed, informed consent.
RESULTS
Wearable Device Performance
There were two Actiwatch device failures, yielding an Actiwatch sample size of 100. There were twelve Jawbone technical failures and four participants who did not wear the Jawbone, yielding a Jawbone sample size of 86. Comparing Actiwatch to PSG, TST was strongly correlated, SE was moderately correlated, and WASO and SOL were only weakly correlated (Table 2). Comparing Jawbone to PSG, there was a moderate positive correlation for TST but a weaker correlation for SE.
Table 2:
Correlations between polysomnography and wearable measures of sleep
| PSG and Actiwatch correlations | PSG and Jawbone correlations | |||
|---|---|---|---|---|
| R | p-value | R | p-value | |
| TST, minutes | 0.75 | <0.0001 | 0.60 | <0.0001 |
| SE, % | 0.61 | <0.0001 | 0.31 | 0.003 |
| SOL, minutes | 0.29 | 0.003 | N/A | N/A |
| WASO, minutes | 0.40 | <0.0001 | N/A | N/A |
Abbreviations:PSG = polysomnogram, TST = total sleep time, SE = sleep efficiency, SOL = sleep onset latency, WASO = wake after sleep onset
Despite these significant correlations, individual subjects demonstrated large differences when comparing PSG and wearable devices. Actiwatch (vs PSG) overestimated TST by 27.2 minutes. The 95% confidence limits (CL, i.e., −1.96*standard deviation to 1.96*standard deviation) for the difference between measures ranged from an underestimation of 84.0 minutes to an overestimation of 138.3 minutes. The Actiwatch overestimated sleep efficiency by 6.8%, with 95% CL of underestimating by 20.5% to overestimating by 34.1%. The Actiwatch overestimated SOL by 2.6 minutes (95% CL 58.2 minutes underestimated to 63.3 minutes overestimated). WASO was the only measure underestimated by the Actiwatch, by 50.7 minutes (95% CL 162.5 minutes underestimated to 61.2 minutes overestimated).
The Jawbone overestimated TST by an average of 59.1 minutes (95% CL underestimated by 90.5 minutes to overestimated by 208.6 minutes). The Jawbone overestimated SE by 14.9% (95% CL underestimating by 22.7% to overestimating by 52.6%). Bland-Altman plots (Figures 1 and 2) highlight the wide range of differences between PSG and wearables, becoming more pronounced as total sleep time and sleep efficiency decrease.
Figure 1:
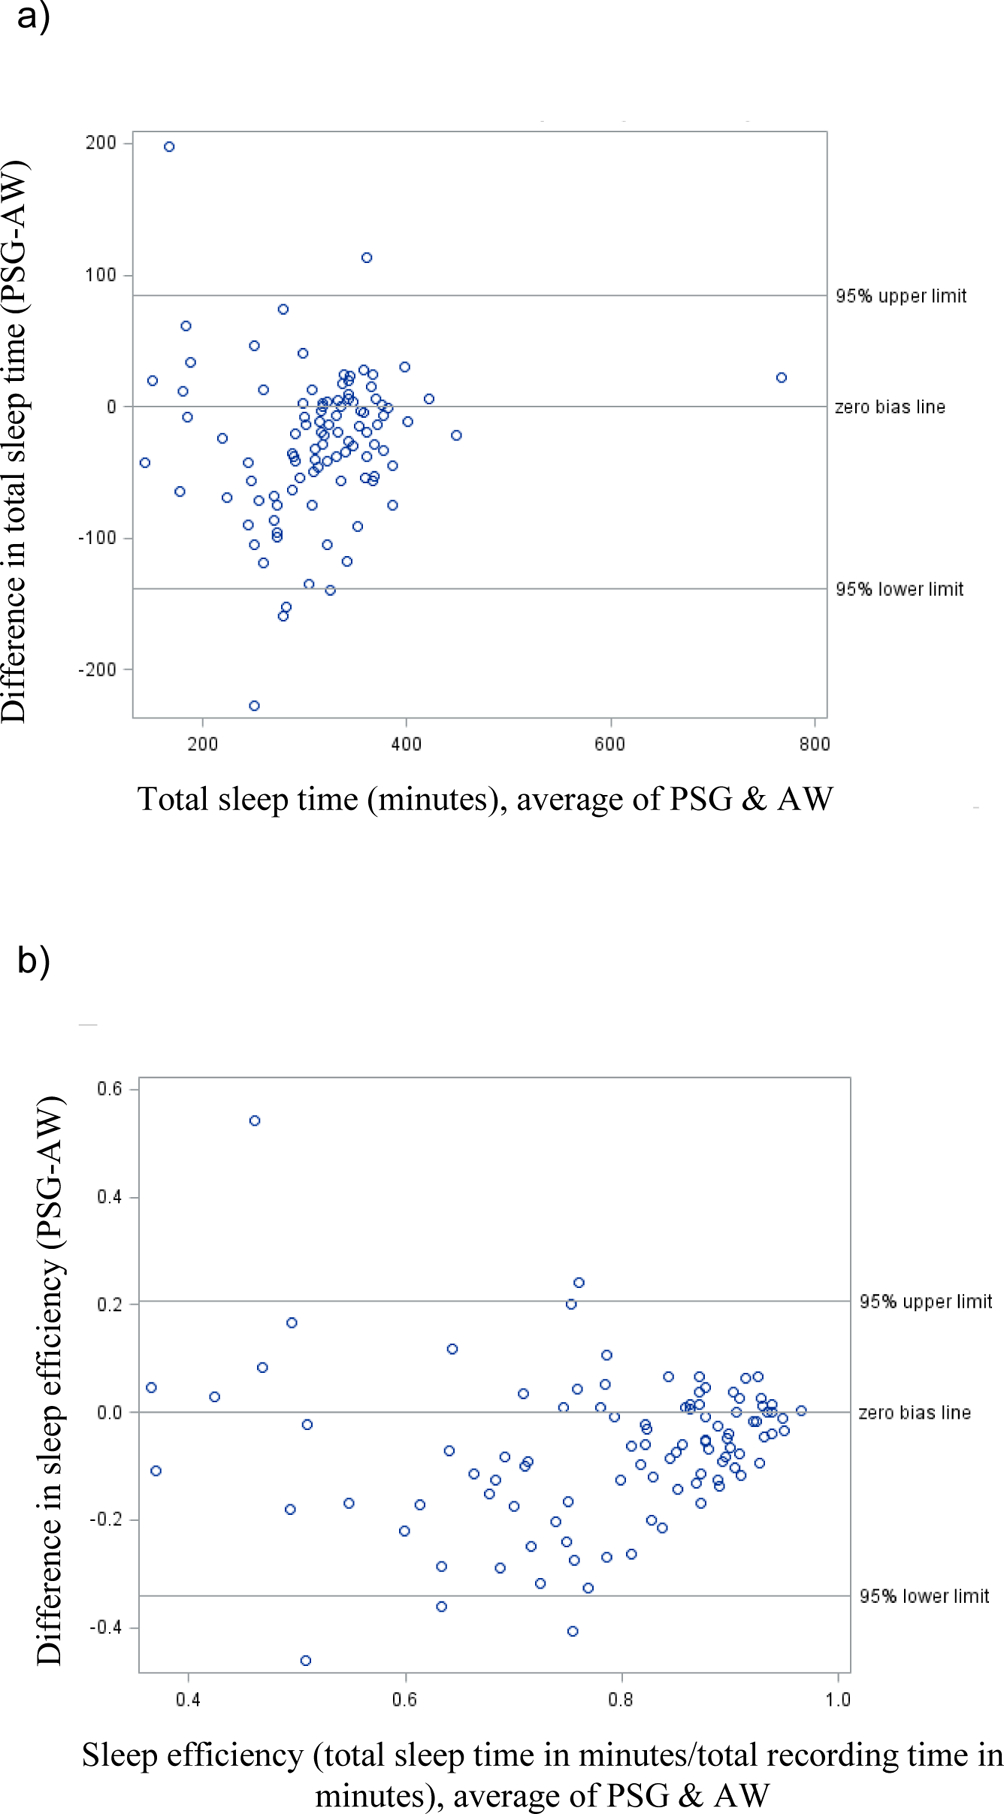
Comparison of Actiwatch measures to polysomnographic measures for a) total sleep time and b) sleep efficiency. AW = Actiwatch, PSG = polysomnography
Figure 2:
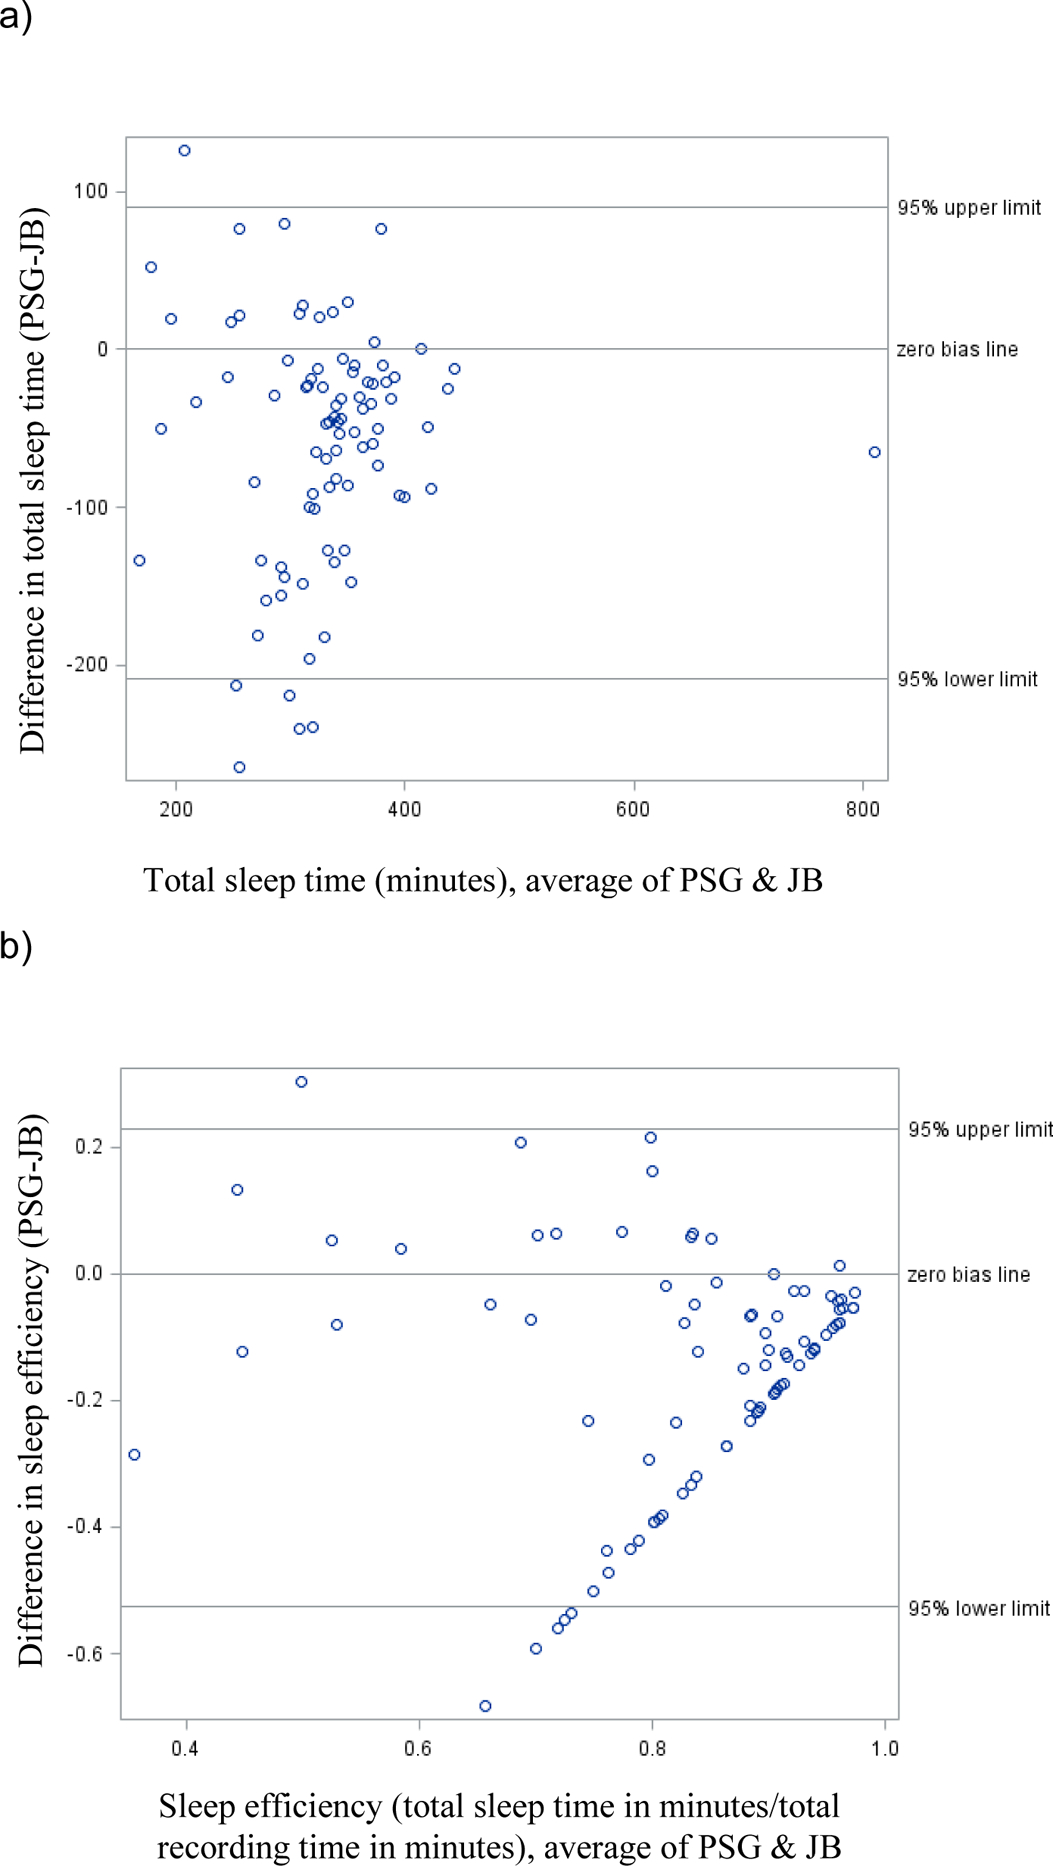
Comparison of Jawbone measures to polysomnographic measures for a) total sleep time and b) sleep efficiency.
Demographic features and wearable device performance
Age was weakly and negatively correlated to the difference scores with PSG for Actiwatch TST, Actiwatch SE, Jawbone TST, and Jawbone SE, i.e. both devices overestimated PSG measures of TST and SE more with increasing age (Tables 3 and 5). The Actiwatch underestimated WASO more with increasing age based on difference scores, but there was no effect of age on Actiwatch SOL.
Table 3:
Actiwatch performance – correlations (r) with demographic and clinical features
| Diff, TST | Diff, SE | Diff, SOL | Diff, WASO | Abs, TST | Abs, SE | Abs, SOL | Abs, WASO | |
|---|---|---|---|---|---|---|---|---|
| Age, years | −0.36# | −0.36# | 0.11 | 0.41* | 0.33# | 0.34# | 0.17 | 0.44* |
| BMI, kg/m2 | 0.18 | 0.17 | −0.08 | −0.29% | −0.14 | −0.14 | 0.05 | −0.30% |
| SOL, minutes | −0.22^ | −0.21^ | 0.47* | 0.01 | 0.26% | 0.25^ | 0.46* | 0.07 |
| WASO, minutes | −0.50* | −0.47* | −0.25^ | 0.95* | 0.57* | 0.55* | 0.22^ | 0.96* |
| N1 | −0.17 | −0.17 | −0.01 | 0.48* | 0.33# | 0.36# | 0.23^ | 0.48* |
| N3 | 0.14 | 0.15 | −0.07 | −0.29% | −0.14 | −0.16 | −0.14 | −0.27% |
| REM | 0.06 | 0.05 | −0.09 | −0.21^ | −0.24^ | −0.26% | −0.21^ | −0.25^ |
| ESS | −0.11 | −0.08 | 0.03 | 0.04 | 0.10 | 0.06 | 0.01 | 0.07 |
| AHI | 0.19 | 0.21^ | −0.21^ | 0.20^ | 0.25^ | 0.28% | 0.22^ | 0.20^ |
| PLMI | 0.04 | 0.04 | 0.04 | 0.07 | −0.04 | −0.04 | 0.17 | 0.07 |
Statistical significance is indicated as follows:
p < 0.0001,
p < 0.001,
p < 0.01,
p < 0.05.
Abbreviations:Diff = difference, i.e., MeasurePSG minus MeasureWearable, Abs = absolute value of difference, i.e., |MeasurePSG minus MeasureWearable|, PSG = polysomnogram, TST = total sleep time in minutes, SE = sleep efficiency (TST/total recording time × 100%), SOL = sleep onset latency in minutes, WASO = wake after sleep onset in minutes, N1 = percentage of time spent in N1 sleep, N3 = percentage of time spent in N3 sleep, REM = percentage of time spent in rapid-eye movement sleep, BMI = body mass index, kg/m2 = kilogram/meter2, REM = rapid eye movement sleep, ESS = Epworth Sleepiness Scale, AHI = apnea-hypopnea index, PLMI = periodic limb movement of sleep index
Table 5:
Jawbone performance -- correlations (r) with demographic and clinical features
| Diff, TST | Diff, SE | Abs, TST | Abs, SE | |
|---|---|---|---|---|
| Age, years | −0.26^ | −0.30% | 0.35# | 0.40# |
| BMI, kg/m2 | 0.29% | 0.27^ | −0.24^ | −0.23^ |
| SOL, minutes | −0.22^ | −0.22^ | 0.22^ | 0.21^ |
| WASO, minutes | −0.59* | −0.58* | 0.73* | 0.71* |
| N1 | −0.30% | −0.31% | 0.38# | 0.39# |
| N3 | 0.24^ | 0.24^ | −0.24^ | −0.24^ |
| REM | 0.24^ | 0.25^ | −0.26^ | −0.27^ |
| ESS | 0.04 | 0.06 | −0.12 | −0.13 |
| AHI | 0.11 | 0.10 | −0.01 | −0.01 |
| PLMI | −0.01 | −0.03 | 0.13 | 0.15 |
Statistical significance is indicated as follows:
p < 0.0001,
p < 0.001,
p < 0.01,
p < 0.05.
Abbreviations:Diff = difference, i.e., MeasurePSG minus MeasureWearable, Abs = absolute value of difference, i.e., |MeasurePSG minus MeasureWearable|, PSG = polysomnogram, TST = total sleep time in minutes, SE = sleep efficiency (TST/total recording time ×100%), SOL = sleep onset latency, WASO = wake after sleep onset, BMI = body mass index, kg/m2 = kilogram/meter2, N1 = percentage of time spent in N1 sleep, N3 = percentage of time spent in N3 sleep, REM = percentage of time spent in rapid eye movement sleep, ESS = Epworth Sleepiness Scale, AHI = apnea-hypopnea index, PLMI = periodic limb movement of sleep index
Gender effects were not apparent in difference scores for either device, with the exception of greater underestimation of WASO among men by the Actiwatch (underestimated by 74.5 minutes in men and 30.0 minutes in women; Table 4). Absolute value scores showed significant gender effects on TST, SE, and WASO, i.e., performance was worse for men with both devices, but the gender effect on TST and SE was not a consistent over- or under-estimation.
Table 4:
Actiwatch performance – tests by categorical group
| Diff, TST | Diff, SE | Diff, SOL | Diff, WASO | Abs, TST | Abs, SE | Abs, SOL | Abs, WASO | ||
|---|---|---|---|---|---|---|---|---|---|
| Gender | Men | −38.5 | −9.5 | −4.4 | 74.5 | 58.0 | 14.8 | 16.4 | 76.9 |
| Women | −17.5 | −4.5 | −1.0 | 30.0 | 33.3 | 8.1 | 18.7 | 34.8 | |
| T | −1.86 | −1.76 | −0.53 | 4.13* | 2.90% | 3.14% | −0.45 | 4.18* | |
| PHQ9 | < 9 | −30.5 | −7.4 | −0.1 | 51.6 | 46.0 | 11.5 | 12.3 | 55.5 |
| > 9 | −22.2 | −6.0 | −10.5 | 50.7 | 42.0 | 10.5 | 29.5 | 53.8 | |
| −0.64 | −0.45 | 1.16 | 0.07 | 0.44 | 0.48 | −2.4^ | 0.13 |
Statistical significance is indicated as follows:
p < 0.0001,
p < 0.001,
p < 0.01,
p < 0.05.
Abbreviations:Diff = difference, i.e., MeasurePSG minus MeasureWearable, Abs = absolute value of difference, i.e., |MeasurePSG minus MeasureWearable|, PSG = polysomnogram, TST = total sleep time in minutes, SE = sleep efficiency (TST/total recording time × 100%), SOL = sleep onset latency in minutes, WASO = wake after sleep onset in minutes, PHQ9 = Patient Health Questionnaire-9
BMI was weakly and negatively correlated with Actiwatch WASO, with more underestimation of WASO as BMI increased, but was unrelated to other Actiwatch measures (Table 3). BMI was weakly and positively correlated to difference scores for Jawbone TST and SE, i.e., the Jawbone overestimated sleep measures more in those with lower BMI.
Sleep architecture and wearable device performance
Wearable device overestimation of TST and SE increased with increasing sleep onset latency, i.e., sleep onset latency was weakly, negatively correlated with difference scores for Actiwatch TST, Actiwatch SE, Jawbone TST, and Jawbone SE (Tables 3 and 5). Sleep onset latency was weakly, positively correlated with difference score for Actiwatch SOL, such that people with longer PSG-measured sleep latencies had less overestimation of sleep latency by the Actiwatch (Table 3).
Similarly, wearable device overestimation of TST, SE, and SOL increased with increasing WASO, as reflected in negative correlations between WASO and difference scores for Actiwatch TST, Actiwatch SE, Actiwatch SOL, Jawbone TST, and Jawbone SE (Tables 3 and 5). PSG-measured WASO had a very strong positive correlation (r = 0.95) with WASO difference score for the Actiwatch.
Considering sleep stage data and difference scores, the only Actiwatch feature related to sleep stages was WASO. The Actiwatch tended to underestimate WASO more as percentage of N1 increased and percentages of N3 and REM sleep decreased (Table 3). Absolute value scores were additionally related to sleep stages for Actiwatch TST, SE, and SOL, such that N1 and REM percentages affect Actiwatch accuracy but without a consistent effect on under- versus over-estimating these measures. Difference scores for both Jawbone measures of TST and SE were related to percentages of N1, N3, and REM sleep (Table 5). Jawbone overestimates sleep measures more as N1 increases and REM and N3 decrease.
Clinical features and wearable device performance
Epworth scores were unrelated to device performance. AHI was related to Actiwatch accuracy of SE, SOL, and WASO, with less overestimation of SE, more overestimation of SOL, and more underestimation of WASO with increasing severity of sleep apnea (Table 3). AHI was unrelated to Jawbone performance. PLMS were unrelated to performance of either device. Presence or absence of depression minimally affected device performance, with only Actiwatch SOL showing less accuracy in those with elevated PHQ9 depression scores (Table 4).
Linear regression
Using backward model selection of linear regression models for difference scores, between one and four variables were retained in each model as significant predictors of wearable tracker error (Table 7). Significant predictors for each model varied by sleep metric and wearable device, but included age, SOL, WASO, % N1, and AHI, with WASO retained in all models and AHI in all but one. Overall explanatory power of the independent variables was low, with amount of variance explained by the models (i.e., adjusted r-squared values) ranging from 0.18 to 0.38.
Table 7:
Final linear regression models
| Actiwatch | Jawbone | ||||
|---|---|---|---|---|---|
| Diff, TST | Diff, SE | Diff, SOL | Diff, TST | Diff, SE | |
| Age, years | -- | B = −0.20 | B = 0.59 | -- | -- |
| AHI | B = 0.98 | B = 0.29 | B = −0.54 | B = 0.90 | -- |
| SOL, minutes | B = −0.44 | -- | -- | -- | -- |
| WASO, minutes | B = −0.50 | B = −0.10 | B = −0.23 | B = −0.76 | B = −0.18 |
| N1 | -- | -- | B = 1.01 | -- | -- |
| Overall model adjusted R-squared | 0.35 | 0.34 | 0.18 | 0.38 | 0.32 |
All models significant at p < 0.0001. Abbreviations:B = beta coefficient, Diff = difference, i.e., MeasurePSG minus MeasureWearable, TST = total sleep time in minutes, SE = sleep efficiency (calculated as TST/total recording time × 100%), SOL = sleep onset latency, AHI = apnea-hypopnea index, WASO = wake after sleep onset, N1 = percentage of time spent in N1 sleep
DISCUSSION
Prior studies have shown that wearable devices may be useful tools for the evaluation of group differences in certain sleep metrics (Smith et al., 2018b), given sufficiently large group sizes, but our study highlights the difficulties in using this wearable device data on an individual patient level. We have demonstrated large amounts of individual variability between the gold standard PSG and two different wearable devices, one clinical and one targeted to consumers. We have also identified several relevant, common demographic and clinical features that impact wearable device accuracy.
Both the clinical and the consumer device over-estimated TST and SE on average, with worse performance by the consumer Jawbone than the clinical Actiwatch. The inaccuracies of these devices in our clinical population were large enough to be problematic for clinical decision making, e.g., the Actiwatch overestimated total sleep time by nearly half an hour on average. More importantly, the range of individual-level inaccuracies were of clinically-significant magnitude, such that a clinician attempting to apply the Actiwatch result would not know whether it was overestimating sleep time by more than 2 hours or underestimating by almost 1.5 hours (Figure 1A). Similarly wide ranges for Actiwatch SE, SOL, WASO, and both Jawbone measures seriously limits the clinical utility of these devices for sleep center patients.
Several demographic features affected the performance of the wearable devices. With increasing age, wearables became modestly but significantly less accurate compared to PSG, with wearable devices tending to increasingly overestimate sleep measures of TST and SE with increasing age. Because wearable devices often fail to correctly identify wake after sleep onset (WASO) (Meltzer et al., 2012), the age effect may reflect the decreases in total sleep time and increases in WASO seen with advancing age (Ohayon et al., 2004).
Gender significantly affected the results for both Actiwatch and Jawbone, with both wearable devices performing substantially worse in men. While some studies have also found a difference in accuracy based on gender (Johnson et al., 2007), others suggest its impact is minimal (Marino et al., 2013). This discrepancy between studies may reflect a difference in the age of included participants or the particular wearable devices under study. More research is needed to understand potential mechanisms related to the decreased accuracy in men compared to women.
The effect of BMI on wearable device performance differed for the two devices, in that BMI only affected Actiwatch estimation of WASO, while BMI affected both measures of Jawbone performance. Further, increasing BMI was associated with worse performance of Actiwatch but better performance of Jawbone with increasing BMI. It is possible, but speculative, that some of this difference could reflect differences in sensor type between the two devices, i.e., accelerometry alone versus accelerometry plus bio-impedance data.
Increasing severity of sleep apnea affected some, but not all, Actiwatch measures. The effects of sleep apnea were not consistent, with relatively better performance in SE with increasing sleep apnea severity but worse estimation of SOL and WASO with increasing severity. This is somewhat in contrast with the findings in the MrOS study, which found underestimation of sleep time in those with severe sleep apnea (Blackwell et al., 2011). Depression, as defined by an elevated PHQ9 score, minimally affected device performance. Although others have found that periodic limb movements of sleep are associated with less overestimation of sleep metrics by actigraphy (Blackwell et al., 2011), we could not confirm this in our patient population.
Validation studies of earlier versions of the Jawbone UP have shown similar limitations in device performance to what we have described with the Jawbone UP3. Differences between TST measured by UP and PSG in two studies were 9 minutes and 63 minutes, respectively, while differences in SE were 2% and 9% (Gruwez et al., 2019;Toon et al., 2016). Even in the study that showed relatively small mean differences between PSG and UP, participants had a clinically significant difference in PSG and UP estimates of TST in 36% of participants and SE in 47% of participants (Toon et al., 2016). These two studies differed in their patient population, with children and adolescents in the study with better wearable performance and adults in the other. Among children, age significantly affected UP performance, with underestimation of TST in preschool children but overestimation in adolescents (Toon et al., 2016). In the study of children, sleep apnea did not affect UP performance on measures of TST, WASO, or SE but less underestimation of SOL was seen with increasing severity of sleep-disordered breathing (Toon et al., 2016). These studies underscore the potential inaccuracy of the UP device and potentially meaningful effects of age and, to a lesser extent, sleep disordered breathing.
Although multiple factors affected device accuracy in our study, most correlations were modest. In linear regression, most models retained only 1–3 variables, and the best models explained only approximately 1/3rd of the variance in device performance. This suggests that other, unidentified factors additionally contribute to the wide variability of device performance. This relatively weak explanatory power of commonly-assessed clinical and demographic features further limits clinical application, as predictions about how an individual patient’s characteristics may affect device accuracy cannot be made with much certainty. Further, many associations held true for only one or the other wearable device, highlighting device-specific differences that prevent categorical assumptions about how particular patient-specific features may or may not affect wearable device accuracy.
This study had several limitations. We studied sleep lab patients, so the results may not apply to those without sleep disorders or symptoms. Single night PSG does not perfectly reflect habitual sleep, due to first-night effect (disruption due to a new sleeping environment) (Toussaint et al., 1995). There may be factors in the home environment, e.g., pets, that affect accuracy of wearable devices but cannot be easily tested with in-laboratory PSG. Because our interest was in summary measures used in clinical practice, we did not perform epoch-by-epoch comparisons. We studied the Jawbone UP3, which has subsequently been removed from the market; there are recent plans for re-launch (website, 2017). Finally, we chose to start and stop the actigraphy device monitoring period based on the lights-off and lights-on time for PSG, to allow standardization of recording time. However, this may artificially bolster device performance, as this information is not as precisely available in the home setting (Trotti, 2019).
Wearable devices have benefits, including lower cost, use in the habitual sleep environment, and patient engagement. However, both clinical and consumer devices have substantial limitations in estimating sleep time and sleep efficiency in individuals with sleep disorders and are significantly impacted by OSA, sleep stages, age, and gender. Routine application of data from these devices into clinical practice would introduce substantial diagnostic error, and these devices are not currently accurate enough to supplant existing diagnostic tools. Sleep specialists should interpret data from these devices with extreme caution and discuss the limitations of these devices with those patients who wish to or already are using these devices in hopes of improving their sleep. There is an urgent need for collaboration between sleep specialists, engineers, and device manufacturers to yield improved sleep tracking devices accurate enough to apply to individual patient decision-making, across a variety of sleep and medical disorders.
Table 6:
Jawbone performance by categorical group
| Diff, TST | Diff, SE | Abs, TST | Abs, SE | ||
|---|---|---|---|---|---|
| Gender | Men | −73.0 | −18.6 | 87.5 | 22.2 |
| Women | −45.2 | −11.3 | 58.7 | 14.6 | |
| T | −1.71 | −1.79 | 2.17^ | 2.26^ | |
| PHQ9 | < 9 | −53.4 | −13.5 | 69.1 | 17.5 |
| > 9 | −72.6 | −18.1 | 80.3 | 19.8 | |
| T | 1.07 | 1.02 | −0.74 | −0.60 |
Statistical significance is indicated as follows:
p < 0.0001,
p < 0.001,
p < 0.01,
p < 0.05.
Abbreviations:Diff = difference, i.e., MeasurePSG minus MeasureWearable, Abs = absolute value of difference, i.e., |MeasurePSG minus MeasureWearable|, PSG = polysomnogram, TST = total sleep time in minutes, SE = sleep efficiency (calculated as TST/total recording time × 100%), PHQ9 = Patient Health Questionnaire-9
ACKNOWLEDGEMENTS:
This work was supported by NIH grants K23 NS083748 (LMT) and K23 HL127251 (AS).
Footnotes
CONFLICTS OF INTERESTS:
The authors report no conflicts of interest.
REFERENCES
- International classification of sleep disorders. 3rd ed. Darien, IL: American Academy of Sleep Medicine; 2014. [DOI] [PMC free article] [PubMed] [Google Scholar]
- Jawbone Health Hub: What we know so far. 2017. [05/05/19]; Available from: https://www.wareable.com/wearable-tech/jawbone-health-hub-medical-health-wearable-2144.
- Blackwell T, Ancoli-Israel S, Redline S, Stone KL, Osteoporotic Fractures in Men Study G. Factors that may influence the classification of sleep-wake by wrist actigraphy: the MrOS Sleep Study. J Clin Sleep Med. 2011. August 15;7:357–67. [DOI] [PMC free article] [PubMed] [Google Scholar]
- Gruwez A, Bruyneel AV, Bruyneel M The validity of two commercially-available sleep trackers and actigraphy for assessment of sleep parameters in obstructive sleep apnea patients. PLoS One. 2019;14:e0210569. [DOI] [PMC free article] [PubMed] [Google Scholar]
- Iber C, Ancoli-Israel S, Chesson A, Quan SF, AASM The AASM Manual for the Scoring of Sleep and Associated Events. Westchester, IL: American Academy of Sleep Medicine; 2007. [Google Scholar]
- Johnson NL, Kirchner HL, Rosen CL, et al. Sleep estimation using wrist actigraphy in adolescents with and without sleep disordered breathing: a comparison of three data modes. Sleep. 2007. July;30:899–905. [DOI] [PMC free article] [PubMed] [Google Scholar]
- Kapur VK, Auckley DH, Chowdhuri S, et al. Clinical Practice Guideline for Diagnostic Testing for Adult Obstructive Sleep Apnea: An American Academy of Sleep Medicine Clinical Practice Guideline. J Clin Sleep Med. 2017. March 15;13:479–504. [DOI] [PMC free article] [PubMed] [Google Scholar]
- Khosla S, Deak MC, Gault D, et al. Consumer Sleep Technology: An American Academy of Sleep Medicine Position Statement. J Clin Sleep Med. 2018. May 15;14:877–80. [DOI] [PMC free article] [PubMed] [Google Scholar]
- Kolla BP, Mansukhani S, Mansukhani MP Consumer sleep tracking devices: a review of mechanisms, validity and utility. Expert Rev Med Devices. 2016. May;13:497–506. [DOI] [PubMed] [Google Scholar]
- Kroenke K, Spitzer RL, Williams JB The PHQ-9: validity of a brief depression severity measure. J Gen Intern Med. 2001. September;16:606–13. [DOI] [PMC free article] [PubMed] [Google Scholar]
- Mantua J, Gravel N, Spencer RM Reliability of Sleep Measures from Four Personal Health Monitoring Devices Compared to Research-Based Actigraphy and Polysomnography. Sensors (Basel). 2016. May 5;16. [DOI] [PMC free article] [PubMed] [Google Scholar]
- Marino M, Li Y, Rueschman MN, et al. Measuring sleep: accuracy, sensitivity, and specificity of wrist actigraphy compared to polysomnography. Sleep. 2013. November 1;36:1747–55. [DOI] [PMC free article] [PubMed] [Google Scholar]
- Matthews KA, Patel SR, Pantesco EJ, et al. Similarities and differences in estimates of sleep duration by polysomnography, actigraphy, diary, and self-reported habitual sleep in a community sample. Sleep Health. 2018. February;4:96–103. [DOI] [PMC free article] [PubMed] [Google Scholar]
- Meltzer LJ, Montgomery-Downs HE, Insana SP, Walsh CM Use of actigraphy for assessment in pediatric sleep research. Sleep Med Rev. 2012. October;16:463–75. [DOI] [PMC free article] [PubMed] [Google Scholar]
- Ohayon MM, Carskadon MA, Guilleminault C, Vitiello MV Meta-analysis of quantitative sleep parameters from childhood to old age in healthy individuals: developing normative sleep values across the human lifespan. Sleep. 2004. November 1;27:1255–73. [DOI] [PubMed] [Google Scholar]
- Rechtschaffen A, Kales A, editors. A Manual of Standardized Terminology, Techniques, and Scoring System for Sleep Stages of Human Subjects. Los Angeles: BIS/BRI; 1968. [DOI] [PubMed] [Google Scholar]
- Smith MT, McCrae CS, Cheung J, et al. Use of Actigraphy for the Evaluation of Sleep Disorders and Circadian Rhythm Sleep-Wake Disorders: An American Academy of Sleep Medicine Systematic Review, Meta-Analysis, and GRADE Assessment. J Clin Sleep Med. 2018a. July 15;14:1209–30. [DOI] [PMC free article] [PubMed] [Google Scholar]
- Smith MT, McCrae CS, Cheung J, et al. Use of Actigraphy for the Evaluation of Sleep Disorders and Circadian Rhythm Sleep-Wake Disorders: An American Academy of Sleep Medicine Clinical Practice Guideline. J Clin Sleep Med. 2018b. July 15;14:1231–7. [DOI] [PMC free article] [PubMed] [Google Scholar]
- Toon E, Davey MJ, Hollis SL, Nixon GM, Horne RS, Biggs SN Comparison of Commercial Wrist-Based and Smartphone Accelerometers, Actigraphy, and PSG in a Clinical Cohort of Children and Adolescents. J Clin Sleep Med. 2016. March;12:343–50. [DOI] [PMC free article] [PubMed] [Google Scholar]
- Toussaint M, Luthringer R, Schaltenbrand N, et al. First-night effect in normal subjects and psychiatric inpatients. Sleep. 1995. July;18:463–9. [DOI] [PubMed] [Google Scholar]
- Trotti LM Are We There Yet? Getting Closer to Certainty in Idiopathic Hypersomnia Diagnosis. J Clin Sleep Med. 2019. April 15;15:539–40. [DOI] [PMC free article] [PubMed] [Google Scholar]