

Abstract
Recently, the coronavirus disease 2019 (COVID-19) has become a worldwide public health threat. Early and quick identification of the potential risk zones of COVID-19 infection is increasingly vital for the megacities implementing targeted infection prevention and control measures. In this study, the communities with confirmed cases during January 21–February 27 were collected and considered as the specific epidemic data for Beijing, Guangzhou, and Shenzhen. We evaluated the spatiotemporal variations of the epidemics before utilizing the ecological niche models (ENM) to assemble the epidemic data and nine socioeconomic variables for identifying the potential risk zones of this infection in these megacities. Three megacities were differentiated by the spatial patterns and quantities of infected communities, average cases per community, the percentages of imported cases, as well as the potential risks, although their COVID-19 infection situations have been preliminarily contained to date. With higher risks that were predominated by various influencing factors in each megacity, the potential risk zones coverd about 75% to 100% of currently infected communities. Our results demonstrate that the ENM method was capable of being employed as an early forecasting tool for identifying the potential COVID-19 infection risk zones on a fine scale. We suggest that local hygienic authorities should keep their eyes on the epidemic in each megacity for sufficiently implementing and adjusting their interventions in the zones with more residents or probably crowded places. This study would provide useful clues for relevant hygienic departments making quick responses to increasingly severe epidemics in similar megacities in the world.
Abbreviations: COVID-19, the coronavirus disease 2019; ENM, ecological niche model; NHC, national health commission; AUC, the area under the curve; ROC, receiver operating characteristic
Keywords: COVID-19, Ecological niche model, China's megacities, Risk zones, Early forecasting
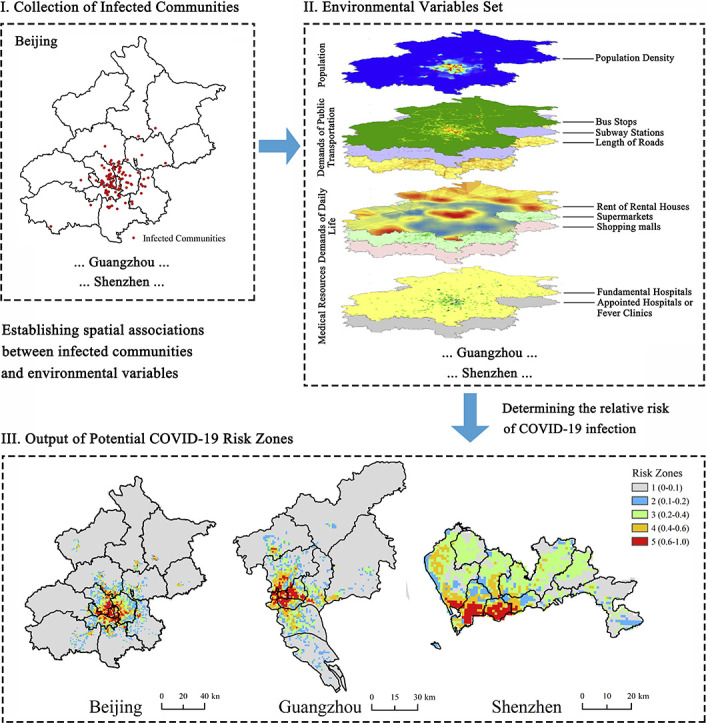
Graphical abstract
Highlights
-
•
COVID-19 infection still poses increasing threat to public health in the world.
-
•
We explored the feasibility of Maxent models in identifying the potential risks.
-
•
Socioeconomic factors affected the spatial distribution of potential risk zones.
-
•
Dominant influencing factors on potential risk zones varied in the megacities.
-
•
Maxent models were suitable for early identifying potential COVID-19 risk zones.
1. Introduction
Involving six continents, the outbreaks of the coronavirus diseases 2019 (COVID-19) were still raging and have become a global public health concern (WHO, 2020a, WHO, 2020b, WHO, 2020c). It was considerably urgent for the countries or regions to implement effective strategies for containing the increasingly severe epidemics as soon as possible.
Many epidemiological and clinical studies have pointed out that the COVID-19 infection could be characterized as a person-to-person transmission, especially in the community in some affected geographic areas during its incubation period (Chan et al., 2020; Huang et al., 2020; Li et al., 2020a; Pongpirul et al., 2020; Yu et al., 2020). The current critical and effective prevention and control strategies are to block person-to-person transmission and to avoid being exposed to this virus because there is currently no effective vaccine or specific therapeutic drug to prevent this disease (Deng and Peng, 2020; Wang et al., 2020).
Numerous reports have accomplished early forecasting of the potential COVID-19 outbreaks' situations on the size and the duration to support making effective infection prevention and control strategies in China and the other countries using various models (Kucharski et al., 2020; Li et al., 2020a; McBryde, 2020; Roosa et al., 2020; Sun et al., 2020; Wu and McGoogan, 2020; Xu et al., 2020). Furthermore, the identification of the potential risk zones or regions of infectious disease and their influencing factors is equally meaningful for hygienic authorities to precisely implement effective infection prevention and control measures on a fine-scale (Gao and Cao, 2019; Li et al., 2017). However, it was seldom concerned in previous investigations.
Due to much larger population sizes and more active socioeconomic vitalities, China's megacities were confronted with greater stresses from the COVID-19 outbreaks. Therefore, our study utilizes the ecological niche models (ENM) to identify the potential risk zones of the COVID-19 infection from January 21 to February 27, as well as their predominant influencing factors in Beijing, Guangzhou, and Shenzhen. This study would supply useful clues for local hygienic authorities deciding where to prioritize effective interventions on a fine scale.
2. Matereial and methods
2.1. Data collection and processing
2.1.1. Specific epidemic data
Beijing, Guangzhou, Shanghai, and Shenzhen were well-known as four megacities for their much higher overall strength and top-ranking competitiveness in China. These megacities are not only the leading and core of China's economy but also pose global influences on world economies. In this study, Shanghai was not included for the data missing of this city. During the COVID-19 outbreak, the number of laboratory-confirmed cases by detection of virus nucleic acid, as well as clinically diagnosed by Diagnosis and Treatment Program of 2019 New Coronavirus Pneumonia by China's National Health Commission (NHC), were day by day issued by hygienic authorities (Table 1 )). In this study, the location (name of the community) of each confirmed case in January 21–February 27 was transformed into a spatial point layer for the specific epidemic data in these megacities using the geocoding tool (http://www.gpsspg.com/xGeocoding) and ArcGIS 10.3 software (ESRI, Redlands, CA, USA).
Table 1.
The information of collected epidemic data and socioeconomic variables.
| Variables | Data processing⁎ | Data sources |
|---|---|---|
| Epidemic data | Infected Communities | Beijing: http://wjw.beijing.gov.cn/; Guangzhou: http://wjw.gz.gov.cn/; Shenzhen: http://wjw.sz.gov.cn/ |
| Population | Population density | https://sedac.ciesin.columbia.edu/data/set/gpw-v4-population-density-rev11/data-download |
| Bus stops | Number of bus stops | Open Street Map: https://download.geofabrik.de/asia.html |
| Subway stations | Number of subway stations | |
| Length of roads | The total length of roads | |
| Shopping malls | Number of shopping malls | Points of interest (POI) from Gaode Map: https://www.amap.com/ |
| Supermarkets | Number of supermarkets | |
| Rent of rental houses | Average prices of rental houses | Beijing: https://bj.lianjia.com/zufang/; Guangzhou: https://gz.lianjia.com/zufang/; Shenzhen: https://sz.lianjia.com/zufang/ |
| Fundamental hospitals | Number of fundamental hospitals (Class A, B, and C) | Beijing: http://ybj.beijing.gov.cn/cxfw/jgmlcx/yljg/; Guangzhou: http://wjw.gz.gov.cn/fwcx/yljgcx/; Shenzhen: http://wjw.sz.gov.cn/bmfw/wycx/fwyl/yycx/ |
| Appointed hospitals | Number of appointed hospitals with fever clinics | https://news.qq.com//zt2020/page/feiyan.htm#prevent; |
All these variables were unified on the 1Km × 1Km scale.
2.1.2. Socioeconomic variables
At present, more detailed and evidential acknowledges, like the means and modes of transmission, the transmissibility, as well as its risk factors, are still to be well explored through enhanced surveillance and further investigation on this disease (Wong et al., 2020; Wu and McGoogan, 2020; Zhu et al., 2020). However, several recent epidemiological investigations on the COVID-19 have pointed out that person-to-person transmission caused by confirmed cases and suspected cases indeed exists at the community level in some affected geographic regions during its incubation period (Chan et al., 2020; Huang et al., 2020; Li et al., 2020b; Pongpirul et al., 2020; Yu et al., 2020). Here, we mainly considered the place with a crowded population or large floating population as an important influencing factor of this infection. Nine socioeconomic factors were collected and categorized into four types, i.e., population density, floating population or demands of public transportation (bus stops, subway stations, and length of roads), demands of daily life (rent of rental houses, shopping malls, and supermarkets or convenient stores), and medical resources (major hospitals, and appointed hospitals or fever clinics for diagnosing the COVID-19 infection).
Furthermore, these factors were indexed by the densities on the 1Km × 1Km scale across Beijing, Guangzhou, and Shenzhen City. The sources, types, and processing of the above variables are shown in Table 1. Fig. S1A–C (supplementary material) presented the spatial distribution of above nine socioecnonomic conditions in three megacities. Socioeconomic variables in Beijing and Guangzhou presented similar spaital patterns that were mostly distributed in the their central regions (districts). In comparison, several socioeconomic conditions (including bus stops, subway stations, shopping malls, supermarkets, hostpitals, and appointed hospitals) distributed evenly relatively across Shenzhen that was featured by relatively small urban size, quick and huge achievements of urbanization and industrialization in the past forty years. Meanwhile, the rest (i.e., length of roads, average rental price, population density) displayed spatial clustering in its central (administrative, social, and economic) regions.
2.2. Modeling for COVID-19 infection risk zones
Ecological Niche Models (ENMs), which predict the distribution of species with niche theory (Phillips et al., 2006), have been widely applied to estimate the risk of disease based on known case locations and a set of environmental variables that describe some of the factors that likely influence the spread of the epidemic (Aguiar et al., 2018; Ardestani and Mokhtari, 2020).
As a typical ENM (https://biodiversityinformatics.amnh.org/open_source/maxent), the Maxent model was employed in our study to identify the potential risk zones of COVID-19 infection, as well as their predominant influencing factors. Fig. 1 illustrated the whole process of the Maxent model in detail. A stable and efficient result was obtained through 10 replicates and the cross-validation method that all the samples were randomly divided into ten folds, and each fold, in turn, used for test data. In this way, 90% of the sample data was used for training, and the remaining 10% of data was employed for testing each time. As a result, three Maxent models (Model 1, Model 2, and Model 3) were respectively built on the basis of the epidemic data during 21st Jan - 3rd Feb, 21st Jan - 8th Feb, and 21st Jan - 12th Feb for each megacitiy.
Fig. 1.

The framework of identifying potential risk zones of the COVID-19 infection using the Maxent model (e.g., Beijing).
The performances of the Maxent models were assessed in terms of the area under the curve (AUC) of receiver operating characteristic (ROC) (Ardestani and Mokhtari, 2020). A higher AUC value represents a more reliable prediction being away from a random distribution ranging from 0 to 1. Often, there was an AUC-division standard as below: excellent (0.9–1.0), good (0.8–0.9), acceptable (0.7–0.8), Bad (0.6–0.7), and insufficient (0.5–0.6) (Greiner et al., 2000; Li et al., 2017). Furthermore, the output values (predicted risk results as logistic output) from the models were reclassified into five grades: 1 (0–0.1), 2 (0.1–0.2), 3 (0.2–0.4), 4 (0.4–0.6), and 5 (0.6–1), among which much higher risks (grade 4–5) were focused in this study. Besides, these models were further respectively validated by the epidemic data of infected communities in 6th–8th Feb, 9th–12th Feb, 13th–27th Feb, and 6th–27th Feb, resulting in a set of percentages of infected communities covered by the potential risk zones.
Besides, the percent contributions which were somewhat equal to the influences of the socioeconomic variables on the risk distribution. The response of the risk distribution to these independent variables were derived from these models.
3. Results
In three megacities, the numbers of infected communities, average cases per infected community, and the percentages of imported cases from outside regions decreased from 21st Jan to 27th Feb (Table 2 ). Meanwhile, the COVID-19 infections in Beijing seemed to be clustered at the community level for its larger average values of cases per community. Guangzhou and Shenzhen tended to be always heavily affected by imported infections because of their higher percentages of imported cases. Also, the infected communities in each megacity possessed different spatial patterns. As of 27th Feb, the majority of infected communities were spatially clustered in its central districts in Beijing and Guangzhou (Fig. 2 ), respectively. By contrast, the infected communities seemed to be somewhat dispersedly distributed across Shenzhen (Fig. 2). These results showed that the COVID-19 epidemic in each megacity was different from each other, although the COVID-19 infection has been preliminarily contained.
Table 2.
Comparison of current situations of COVID-19 infection in Beijing, Guangzhou, and Shenzhen during the analysis period.
| Megacities | Periods | Number of infected communities | Number of new cases (percentage of imported cases) | ⁎Average case per infected community |
|---|---|---|---|---|
| Beijing | 21st Jan–3rd Feb | 46 | 223(66.82%) | 4.85 |
| 6th–8th Feb | 30 | 52(25.00%) | 3.62 | |
| 9th–12th Feb | 25 | 40(10.00%) | 3.12 | |
| 13th–27th Feb | 25 | 44(6.82%) | 2.85 | |
| 21st Jan–27th Feb | 126 | 359(47.08%) | / | |
| Guangzhou | 21st Jan–3rd Feb | 112 | 216(71.76%) | 1.93 |
| 6th–8th Feb | 39 | 49(20.41%) | 1.75 | |
| 9th–12th Feb | 18 | 23(N/A) | 1.70 | |
| 13th–27th Feb | 12 | 19(N/A) | 1.70 | |
| 21st Jan–27th Feb | 181 | 307(≥53.75%) | / | |
| Shenzhen | 21st Jan–3rd Feb | 82 | 269(85.13%) | 3.28 |
| 6th–8th Feb | 57 | 50(54.00%) | 2.29 | |
| 9th–12th Feb | 23 | 27(66.67%) | 2.14 | |
| 13th–27th Feb | 17 | 26(57.69%) | 2.08 | |
| 21st Jan–27th Feb | 179 | 372(77.69%) | / |
Average values of cases per community were calculated for the periods of 21st Jan–3rd Feb, 21st Jan–8th Feb, 21st Jan–12th Feb, and 21st Jan–27th Feb, because the newly confirmed cases may belong to some previously infected communities. N/A: the numbers of imported cases in Guangzhou in these periods were not obtained. The second stage only covered Feb 6th–8th due to the missing detailed information of infected communities in 4th–5th Feb.
Fig. 2.

Spatial distribution of communities with confirmed COVID-19 cases at four stages in Beijing, Guangzhou, and Shenzhen.
With mean AUC values of 0.80–0.95, the Maxent models presented outstanding performances (Fig. 3 ). All the infected communities were well covered by the potential COVID-19 risk zones derived from three models (Table 3 ). In particular, Model 1, based on the earliest epidemic data (21st Jan–3rd Feb), possessed comparable precision rates for the risk zones with grades 4–5 in each megacity, covering 65%–68% of the currently infected communities from 6th to 27th Feb. For the time-efficient consideration, earlier and reliably forecasting was achieved from Mode 1 for identifying the potential COVID-19 infection risks in each megacity.
Fig. 3.

The AUC values derived from the Maxent models (1, 2, and 3) for predicting the COVID-19 infection risks in Beijing (a-c), Guangzhou (d-f), and Shenzhen (g-i). AUC is an abbreviation of the area under the curve of receiptor operating characteristic (ROC) processing during modeling.
Table 3.
Precision rates termed for the validations on Model 1, 2, and 3 in Beijing, Guangzhou, and Shenzhen.
| Periods | Grades | Models for Beijing |
Models for Guangzhou |
Models for Shenzhen |
||||||
|---|---|---|---|---|---|---|---|---|---|---|
| 1 | 2 | 3 | 1 | 2 | 3 | 1 | 2 | 3 | ||
| 6th–8th Feb | 1–2 | 20% | 18% | 5% | ||||||
| 3 | 20% | 15% | 23% | |||||||
| 4–5 | 60% | 67% | 72% | |||||||
| 9th–12th Feb | 1–2 | 16% | 16% | 17% | 6% | 4% | 9% | |||
| 3 | 20% | 20% | 16% | 33% | 39% | 30% | ||||
| 4–5 | 64% | 64% | 67% | 61% | 57% | 61% | ||||
| 13th–27th Feb | 1–2 | 20% | 16% | 20% | 25% | 25% | 25% | 0% | 0% | 0% |
| 3 | 8% | 12% | 20% | 0% | 0% | 8% | 29% | 24% | 24% | |
| 4–5 | 72% | 72% | 60% | 75% | 75% | 67% | 71% | 76% | 76% | |
| ⁎6th/9th–27th Feb | 1–2 | 19% | 16% | 19% | 13% | 4% | 5% | |||
| 3 | 16% | 16% | 13% | 20% | 28% | 27% | ||||
| 4–5 | 65% | 68% | 68% | 67% | 68% | 68% | ||||
The subsequently summed communities in 6th–27th Feb and 9th–27th Feb were utilized for Model 1 and 2. Model 1, 2, and 3 were respectively validated by the dataset of infected communities in 6th–8th Feb, 9th–12th Feb, and 13th–27th Feb.
Fig. 4 presented the spatial distribution of potential risk zones of the COVID-19 in three megacities. On the 1 km × 1 km scale, the zones with much higher risks (grade 4–5) in Beijing were densely distributed in the central regions and were gradually and closely surrounded by the risk zones with grade 3–2 in the outer regions (Fig. 4). Slightly differently, the potential zones with much higher risks in Guangzhou were mainly located in the central regions, with surrounding zones of grade 3–2 in the north and south directions (Fig. 4). In comparison, the risk zones with grades 4–5 were mostly concentrated in the southwestern regions in Shenzhen (Fig. 4). As a result, the seriousness of the potential COVID-19 infection in three megacities was different from each other. Shenzhen presented much higher values of area proportions of the risk zones (grade 4–5) than those of Beijing and Guangzhou (see Table S1 in supplementary material).
Fig. 4.

Spatial distribution of the potential COVID-19 risk zones in Beijing, Guangzhou, and Shenzhen.
Table 4 showed the percent contributions of nine socioeconomic variables to the COVID-19 infection risks derived from the Maxent models in Beijing, Guangzhou, and Shenzhen. With various percent contributions, these socioeconomic variables differed from each other. Some socioeconomic variables in the first group, possessing larger individual percent contribution than 20% to the potential COVID-19 infection risks, were considered as the predominant influencing factors (Table 4). Moreover, the socioeconomic factors in the second group possessed individual percent contributions of 1%–10% while the rest socioeconomic variables with individual percent contributions of 0–1% were categorized into the third group derived from Model1. Besides, all the factors presented temporal variations of the percent contributions in three megacities among Model 1, 2, and 3.
Table 4.
Percent contributions of nine socioeconomic variables to the COVID-19 infection risks derived from the Maxent mdoels in Beijing, Guanghzhou, and Shenzhen.
| Megacities | Groups | Variable | Percent contribution (%) |
||
|---|---|---|---|---|---|
| Model 1 | Model 2 | Model 3 | |||
| Beijing | 1st group | Population | 57.5 | 65.2 | 45.9 |
| Supermarkets | 31.7 | 23.2 | 31.9 | ||
| 2nd group | Subway stations | 4.5 | 2.0 | 1.5 | |
| Length of roads | 3.9 | 7.1 | 11.9 | ||
| 3rd group | Rent | 0.6 | 0.2 | 0.8 | |
| Appointed hospitals | 0.6 | 0.7 | 0.2 | ||
| Bus stops | 0.6 | 1.3 | 6.9 | ||
| Hospitals | 0.3 | 0.0 | 0.5 | ||
| Shopping malls | 0.2 | 0.3 | 0.3 | ||
| Guangzhou | 1st group | Supermarkets | 35.2 | 28.6 | 25.9 |
| Population | 31.1 | 33.3 | 33.4 | ||
| Bus stops | 23.4 | 25.3 | 31.0 | ||
| 2nd group | Length of roads | 5.2 | 7.0 | 3.9 | |
| Rent | 3.6 | 3.7 | 4.0 | ||
| 3rd group | Subway stations | 0.7 | 0.7 | 0.7 | |
| Shopping malls | 0.3 | 0.9 | 0.6 | ||
| Appointed hospitals | 0.3 | 0.3 | 0.2 | ||
| Hospitals | 0.2 | 0.2 | 0.2 | ||
| Shenzhen | 1st group | Rent | 39.2 | 30.6 | 28.3 |
| Bus stops | 32.8 | 26.2 | 27.8 | ||
| Length of roads | 22.5 | 27.1 | 28.9 | ||
| 2nd group | Supermarkets | 1.8 | 2.7 | 2.1 | |
| Appointed hospitals | 1.5 | 4.7 | 5.0 | ||
| Population | 1.2 | 2.2 | 2.5 | ||
| 3rd group | Hospitals | 0.6 | 0.3 | 0.4 | |
| Subway stations | 0.4 | 0.1 | 0.2 | ||
| Shopping malls | 0.0 | 6.2 | 4.8 | ||
Note: Models 1, 2, and 3 were respectively built with the epidemic data in 21st Jan -3rd Feb, 21st Jan -8th Feb, and 21st Jan - 12th Feb.
As illustrated in Fig. 5 , the potential COVID-19 infection risks derived from the Maxent models for three megacities made various responses to above predominant influencing factors. There were much higher risks (beyond 0.71, grade 5) of the COVID-19 infection in the zones with both larger population density (beyond 3400 persons per km2) and a moderate number of supermarkets (3.54–29.99 per km2) across Beijing. In Guangzhou, the zones with larger population density (beyond 1000 persons per km2), more supermarkets than 0.11 per km2, and bus stops seemed to present much higher infection risks (grade 4–5). In Shenzhen, much higher risks of the COVID-19 infection tended to occur in the zones with a larger length of roads (0.42 km per km2), higher rent of rental houses (>45.65 Yuan per m2), and more bus stops (>0.92 per km2). In general, much higher infection risks in these megacities were very likely to appear in the zones featured by large values of prevailing socioeconomic conditions for themselves.
Fig. 5.

Response curves of the COVID-19 infection risks to predominant factors derived from Model 1,2, and 3 in Beijing (a and b), Guangzhou (c-e), and Shenzhen (f-h).
4. Discussion
In the past tens of days, China's megacities, like Beijing, Guangzhou, and Shenzhen, were confronted with higher stresses from the COVID-19 outbreaks because of their much larger population and more active socioeconomic vitalities. Fortunately, the COVID-19 epidemics in these megacities have been preliminarily contained by implementing effective and precise strategies to date. In this study, we evaluated the spatial and temporal patterns of the timely issused communities with comfirmed COVID-19 cases before exploring the feasibility of the Maxent method in early identifying the potential infection risk zones in these megacities. Several notable findings were achieved and would provide a useful reference for the regions with increasingly local transmission making and implementing targeted containment efforts for fight against the epidemic of this disease.
In the early periods of the COVID-19 outbreaks, many studies already have accomplished now-casting or early forecasting of the sizes, duration, or dynamics of potential outbreaks through various models (Hellewell et al., 2020; Roosa et al., 2020; Sun et al., 2020; Wu and McGoogan, 2020), by which some useful clues have been timely provided for hygienic authorities at various administrative levels in China and/or other countries/territories/areas. In comparison, our study identified the spatial distribution of potential infection risk zones on a fine scale (1 km × 1 km), its predominant influencing factors, as well as their area and population proportions, which is equally meaningful for hygienic authorities keep local residents from being exposed to these zones with higher potential COVID-19 infection risks in Beijing, Guangzhou, and Shenzhen. In particular, Model 1, based on the earliest epidemic data, presented comparable precision rates and excellent performances among three models assembling different timelines epidemic data (infected communities). That is to say that the ENM method could meet the timeliness and fine spatial scale of forecasting the raging outbreaks of this disease. In other words, it is feasible to employ the ENM method for early forecasting potential COVID-19 infection risks on a fine scale in the countries or megacities suffering from this disease.
Beijing, Guangzhou, and Shenzhen presented obviously different patterns of potential COVID-19 infection, including the severities, spatial heterogeneities, and their predominant influencing factors. There may be several reasons for these differences. The first is that the spatial distribution of selected nine socioeconomic variables was obviously different among three megacities for their own socioeconomic development (Fig. S1A–C in supplementary material), by which the differences of potential severities (either area or population proportions) of the risk zones, as well as their spatial heterogeneities could be well explained. Beijing (the Capital of China) and Guangzhou (the South Gate of China) are two major central megacities with the socioeconomic resources more densely distributed in their central districts. By contrast, Shenzhen is a relatively younger city that has underwent a quick socioeconomic development over the past four decades, leading to the sparsely distributed socioeconomic conditions across this city (Fig. S1C). Secondly, the realistic situations of increasing local transmission featured by familiar clustering in Beijing and Guangzhou could be a reasonable explanation for that the potential COVID-19 infection risks were heavily influenced by population density, the number of supermarkets, and the number of bus stops (in Guangzhou only) in Table 4. Also, the larger migrant floating population from other provinces (including Hubei Province) in Shenzhen who mainly resided in the rental houses, which may be an interpretation for the distinct contribution of the rent of rental houses to the infection risks in this megacity. These results indicated that the potential COVID-19 situation in each megacity tended to be spatially influenced by not only current situation but also the socioeconomic conditions.
In our study, much higher infection risks were very likely to occur in the zones where there were more residents and/or probably highly crowded floating people. It could be well interpreted by the characteristics of person-to-person transmission (Chan et al., 2020; Huang et al., 2020; Li et al., 2020a; Pongpirul et al., 2020; Yu et al., 2020). The timely identification of the places with dense population (local residents or highly crowded floating people) should be considered as one of the critical measures for cutting off the chain transmission (Anderson et al., 2020; Phelan et al., 2020; Wu and McGoogan, 2020). In the past days, a series of tailored infection prevention and control measures has been fully implemented at the grassroots level to isolate either the confirmed or suspected cases and to cut off the chain of transmission, resulting in remarkably reduced local COVID-19 transmission across China (without Hubei Province) (e.g., local cases below ten from February 13 in three megacities). For this point, it can be accordingly understood that the ranks of the predominant influencing factors were slightly different among Model 1–3 with the epidemic data of various timeliness. Then, we cautiously suggest that the risk zones (specific regions) of the potential COVID-19 infection and targeted intervention strategies relying on the predominant factors should be timely updated and adjusted by local hygienic authorities keeping their eyes on the ongoing epidemic.
Besides, a lot of efficient infection intervention measures have shortened the time for China containing the epidemic and have provided important supports for the quick resumption of production in February and March (Tian et al., 2020; Zhao et al., 2020). These achievements would have saved a lot of time for the other countries containing this epidemic (Heymann, 2020; Special Expert Group for Control of the Epidemic of Novel Coronavirus Pneumonia of the Chinese Preventive Medicine, A, 2020; Wang et al., 2020; WHO, 2020c). Outside China, however, there has been a total of 2,234,827 confirmed cases in 212 infected countries/territories/ areas in the world to date (WHO, 2020a), in which local transmission of this disease was not well cut off. Fortunately, local transmission had been well controlled through implementing analogous measures (suspension of major events and rigorous stay-home notice) in Singapore) although the first imported case was already reported on 23rd Jan (Wong et al., 2020). Similarly, several similar infection prevention and control strategies were also adopted in some recently infected countries, like special quarantine of Daegu and Gyeongsangbuk-do in Republic of Korea, as well as Lombardia and Veneto in Italy. Therefore, we cautiously suggest that some enhanced strategies should be strictly implemented as soon as possible to further block local transmission in the hotspot regions.
Our findings are subject to several limitations. First, the identifications of the potential COVID-19 infection risk zones could be properly improved by considering more potential variables since many rigorous intervention measures had been implemented in these megacities, and the epidemiological investigations are increasingly conducted on this epidemic. Secondly, several spatial models (e.g., geographically weighted regression) should be further employed to explore the spatial heterogeneities of responses of the infection risks to socioeconomic variables, by which the strength of socioeconomic conditions influences the infection risks would also be spatially determined for the risk zones. Finally, the influences of imported cases (local residents and migrants from outer regions) should be spatially characterized through exploring their real addresses although it could be partly reflected by the spatial distribution of the rental houses.
5. Conclusions
In summary, the ENM method was an effective early forecasting tool for identifying the potential COVID-19 infection risk zones and their predominant influencing factors before containing the outbreak efficiently in the megacities. We cautiously suggest that attention should be continuously paid to the ongoing epidemics, although the current infection intervention strategies have made huge contributions to the preliminary containment of this disease in China's megacities. Our study implies that these efficient strategies relying on the predominant socioeconomic influencing factors on the COVID-19 infection should be more strictly enhanced in the countries, regions, and cities with increasingly serious epidemics.
The following are the supplementary data related to this article.
Spatial distribution of nine socioeconomic conditions (bus stops, subway stations, length of roads, average rental price, shopping malls, supermarkets, fundamental hospitals, appointed hospitals, and population density) in Beijing (A), Guangzhou (B), and Shenzhen (C).
The proportions of area and population in the risk zones derived from Model 1for Beijing, Guangzhou, and Shenzhen.
Data availability statement
No additional data available.
Funding
This study was funded by the National Natural Science Foundation of China (Grant No. 41571158) and the National Key Research and Development Program of China (2017YFB0503500).
CRediT authorship contribution statement
Hongyan Ren:Conceptualization, Validation, Writing - original draft.Lu Zhao:Data curation, Methodology, Visualization, Software.An Zhang:Conceptualization, Data curation, Writing - review & editing.Liuyi Song:Data curation, Software, Validation.Yilan Liao:Visualization, Investigation.Weili Lu:Data curation, Visualization.Cheng Cui:Data curation, Visualization.
Declaration of competing interest
The authors declare that they have no known competing financial interests or personal relationships that could have appeared to influence the work reported in this paper.
Acknowledgments
We thank all the persons involved in response to this outbreak. We also thank Miss. Lei Yan-hui for her help during the Maxent modeling in this manuscript.
References
- Aguiar B.S., Lorenz C., Virginio F., Suesdek L., Chiaravalloti-Neto F. Potential risks of Zika and chikungunya outbreaks in Brazil: a modeling study. Int. J. Infect. Dis. 2018;70:20–29. doi: 10.1016/j.ijid.2018.02.007. [DOI] [PubMed] [Google Scholar]
- Anderson R.M., Heesterbeek H., Klinkenberg D., Hollingsworth T.D. How will country-based mitigation measures influence the course of the COVID-19 epidemic? Lancet. 2020 doi: 10.1016/S0140-6736(20)30567-5. [DOI] [PMC free article] [PubMed] [Google Scholar]
- Ardestani E.G., Mokhtari A. Modeling the lumpy skin disease risk probability in central Zagros Mountains of Iran. Prev. Vet. Med. 2020;104887 doi: 10.1016/j.prevetmed.2020.104887. [DOI] [PubMed] [Google Scholar]
- Chan J.F.-W., Yuan S., Kok K.-H., To K.K.-W., Chu H., Yang J., Xing F., Liu J., Yip C.C.-Y., Poon R.W.-S., Tsoi H.-W., Lo S.K.-F., Chan K.-H., Poon V.K.-M., Chan W.-M., Ip J.D., Cai J.-P., Cheng V.C.-C., Chen H., Hui C.K.-M., Yuen K.-Y. A familial cluster of pneumonia associated with the 2019 novel coronavirus indicating person-to-person transmission: a study of a family cluster. Lancet. 2020;395:514–523. doi: 10.1016/s0140-6736(20)30154-9. [DOI] [PMC free article] [PubMed] [Google Scholar]
- Deng S.Q., Peng H.J. Characteristics of and public health responses to the Coronavirus disease 2019 outbreak in China. J. Clin. Med. 2020;9 doi: 10.3390/jcm9020575. [DOI] [PMC free article] [PubMed] [Google Scholar]
- Gao X., Cao Z. Meteorological conditions, elevation and land cover as predictors for the distribution analysis of visceral leishmaniasis in Sinkiang province, mainland China. Sci. Total Environ. 2019;646:1111–1116. doi: 10.1016/j.scitotenv.2018.07.391. [DOI] [PubMed] [Google Scholar]
- Greiner M., Pfeiffer D., Smith R.D. Principles and practical application of the receiver-operating characteristic analysis for diagnostic tests. Prev. Vet. Med. 2000;45:23–41. doi: 10.1016/s0167-5877(00)00115-x. [DOI] [PubMed] [Google Scholar]
- Hellewell J., Abbott S., Gimma A., Bosse N.I., Jarvis C.I., Russell T.W., Munday J.D., Kucharski A.J., Edmunds W.J., Funk S., Eggo R.M., Sun F., Flasche S., Quilty B.J., Davies N., Liu Y., Clifford S., Klepac P., Jit M., Diamond C., Gibbs H., van Zandvoort K. Feasibility of controlling COVID-19 outbreaks by isolation of cases and contacts. Lancet Glob. Health. 2020 doi: 10.1016/s2214-109x(20)30074-7. [DOI] [PMC free article] [PubMed] [Google Scholar]
- Heymann D.L. Data sharing and outbreaks: best practice exemplified. Lancet. 2020;395:469–470. doi: 10.1016/S0140-6736(20)30184-7. [DOI] [PMC free article] [PubMed] [Google Scholar]
- Huang R., Xia J., Chen Y., Shan C., Wu C. A family cluster of SARS-CoV-2 infection involving 11 patients in Nanjing, China. Lancet Infect. Dis. 2020 doi: 10.1016/s1473-3099(20)30147-x. [DOI] [PMC free article] [PubMed] [Google Scholar]
- Kucharski A.J., Russell T.W., Diamond C., Liu Y., Edmunds J., Funk S., Eggo R.M., Sun F., Jit M., Munday J.D., Davies N., Gimma A., van Zandvoort K., Gibbs H., Hellewell J., Jarvis C.I., Clifford S., Quilty B.J., Bosse N.I., Abbott S., Klepac P., Flasche S. Early dynamics of transmission and control of COVID-19: a mathematical modelling study. Lancet Infect. Dis. 2020 doi: 10.1016/s1473-3099(20)30144-4. [DOI] [PMC free article] [PubMed] [Google Scholar]
- Li J., Jun Li, Xie X., Cai X., Huang J., Tian X., Zhu H. Game consumption and the 2019 novel coronavirus. Lancet Infect. Dis. 2020 doi: 10.1016/s1473-3099(20)30063-3. [DOI] [PMC free article] [PubMed] [Google Scholar]
- Li Q., Ren H., Zheng L., Cao W., Zhang A., Zhuang D., Lu L., Jiang H. Ecological niche modeling identifies fine-scale areas at high risk of dengue fever in the pearl river delta, China. Int. J. Environ. Res. Public Health. 2017;14 doi: 10.3390/ijerph14060619. [DOI] [PMC free article] [PubMed] [Google Scholar]
- Li Q., Guan X., Wu P., Wang X., Zhou L., Tong Y., Ren R., Leung K.S.M., Lau E.H.Y., Wong J.Y., Xing X., Xiang N., Wu Y., Li C., Chen Q., Li D., Liu T., Zhao J., Li M., Tu W., Chen C., Jin L., Yang R., Wang Q., Zhou S., Wang R., Liu H., Luo Y., Liu Y., Shao G., Li H., Tao Z., Yang Y., Deng Z., Liu B., Ma Z., Zhang Y., Shi G., Lam T.T.Y., Wu J.T.K., Gao G.F., Cowling B.J., Yang B., Leung G.M., Feng Z. Early transmission dynamics in Wuhan, China, of Novel Coronavirus-infected pneumonia. N. Engl. J. Med. 2020 doi: 10.1056/NEJMoa2001316. [DOI] [PMC free article] [PubMed] [Google Scholar]
- McBryde E. The value of early transmission dynamic studies in emerging infectious diseases. Lancet Infect. Dis. 2020 doi: 10.1016/s1473-3099(20)30161-4. [DOI] [PMC free article] [PubMed] [Google Scholar]
- Phelan A.L., Katz R., Gostin L.O. The Novel Coronavirus originating in Wuhan, China: challenges for Global Health governance. JAMA. 2020 doi: 10.1001/jama.2020.1097. [DOI] [PubMed] [Google Scholar]
- Phillips S.J., Anderson R.P., Schapire R.E. Maximum entropy modeling of species geographic distributions. Ecol. Model. 2006;190:231–259. [Google Scholar]
- Pongpirul W.A., Pongpirul K., Ratnarathon A.C., Prasithsirikul W. Journey of a Thai taxi driver and Novel Coronavirus. N. Engl. J. Med. 2020 doi: 10.1056/NEJMc2001621. [DOI] [PMC free article] [PubMed] [Google Scholar]
- Roosa K., Lee Y., Luo R., Kirpich A., Rothenberg R., Hyman J.M., Yan P., Chowell G. Real-time forecasts of the COVID-19 epidemic in China from February 5th to February 24th, 2020. Infect. Dis. Model. 2020;5:256–263. doi: 10.1016/j.idm.2020.02.002. [DOI] [PMC free article] [PubMed] [Google Scholar]
- Special Expert Group for Control of the Epidemic of Novel Coronavirus Pneumonia of the Chinese Preventive Medicine, A An update on the epidemiological characteristics of novel coronavirus pneumonia(COVID-19) Zhonghua liuxingbingxue zazhi. 2020;41:139–144. doi: 10.3760/cma.j.issn.0254-6450.2020.02.002. [DOI] [PubMed] [Google Scholar]
- Sun K., Chen J., Viboud C. Early epidemiological analysis of the coronavirus disease 2019 outbreak based on crowdsourced data: a population-level observational study. Lancet Digit. Heal. 2020 doi: 10.1016/s2589-7500(20)30026-1. [DOI] [PMC free article] [PubMed] [Google Scholar]
- Tian H., Liu Y., Li Y., Wu C.-H., Chen B., Kraemer M.U.G., Li B., Cai J., Xu B., Yang Q., Wang B., Yang P., Cui Y., Song Y., Zheng P., Wang Q., Bjornstad O.N., Yang R., Grenfell B.T., Pybus O.G., Dye C. An investigation of transmission control measures during the first 50 days of the COVID-19 epidemic in China. Science (80-. ) 2020:eabb6105. doi: 10.1126/science.abb6105. [DOI] [PMC free article] [PubMed] [Google Scholar]
- Wang C., Horby P.W., Hayden F.G., Gao G.F. A novel coronavirus outbreak of global health concern. Lancet. 2020;395:470–473. doi: 10.1016/S0140-6736(20)30185-9. [DOI] [PMC free article] [PubMed] [Google Scholar]
- WHO Coronavirus Disease 2019 (COVID-19): Situation Report-91 2020. 2020. https://www.who.int/emergencies/diseases/novel-coronavirus-2019 [WWW Document]. URL.
- WHO Coronavirus Disease 2019 (COVID-19): Situation Report-51 2020. 2020. https://www.who.int/docs/default-source/coronaviruse/situation-reports/20200311-sitrep-51-covid-19.pdf?sfvrsn=1ba62e57_4 [WWW Document]. URL.
- WHO Coronavirus Disease 2019 (COVID-19): Situation Report-30 2020. 2020. https://www.who.int/docs/default-source/coronaviruse/situation-reports/20200219-sitrep-30-covid-19.pdf?sfvrsn=6e50645_2 [WWW Document]. URL.
- Wong J.E.L., Leo Y.S., Tan C.C. COVID-19 in Singapore—current experience: critical global issues that require attention and action. JAMA. 2020 doi: 10.1001/jama.2020.2467. [DOI] [PubMed] [Google Scholar]
- Wu Z., McGoogan J.M. Characteristics of and important lessons from the Coronavirus disease 2019 (COVID-19) outbreak in China: summary of a report of 72314 cases from the Chinese Center for Disease Control and Prevention. JAMA. 2020 doi: 10.1001/jama.2020.2648. [DOI] [PubMed] [Google Scholar]
- Xu B., Kraemer M.U.G., Xu B., Gutierrez B., Mekaru S., Sewalk K., Loskill A., Wang L., Cohn E., Hill S., Zarebski A., Li S., Wu C.-H., Hulland E., Morgan J., Scarpino S., Brownstein J., Pybus O., Pigott D., Kraemer M. Open access epidemiological data from the COVID-19 outbreak. Lancet Infect. Dis. 2020 doi: 10.1016/s1473-3099(20)30119-5. [DOI] [PMC free article] [PubMed] [Google Scholar]
- Yu P., Zhu J., Zhang Z., Han Y., Huang L. A familial cluster of infection associated with the 2019 novel coronavirus indicating potential person-to-person transmission during the incubation period. J. Infect. Dis. 2020 doi: 10.1093/infdis/jiaa077. [DOI] [PMC free article] [PubMed] [Google Scholar]
- Zhao X., Li X., Nie C. Backtracking transmission of COVID-19 in China based on big data source, and effect of strict pandemic control policy. Bull. Chin. Acad. Sci. 2020;35:248–255. [Google Scholar]
- Zhu N., Zhang D., Wang W., Li X., Yang B., Song J., Zhao X., Huang B., Shi W., Lu R., Niu P., Zhan F., Ma X., Wang D., Xu W., Wu G., Gao G.F., Tan W., China Novel Coronavirus I., Research T. A Novel Coronavirus from patients with pneumonia in China, 2019. N. Engl. J. Med. 2020;382:727–733. doi: 10.1056/NEJMoa2001017. [DOI] [PMC free article] [PubMed] [Google Scholar]
Associated Data
This section collects any data citations, data availability statements, or supplementary materials included in this article.
Supplementary Materials
Spatial distribution of nine socioeconomic conditions (bus stops, subway stations, length of roads, average rental price, shopping malls, supermarkets, fundamental hospitals, appointed hospitals, and population density) in Beijing (A), Guangzhou (B), and Shenzhen (C).
The proportions of area and population in the risk zones derived from Model 1for Beijing, Guangzhou, and Shenzhen.
Data Availability Statement
No additional data available.