

Abstract
Critical to the bacterial stringent response is the rapid relocation of resources from proliferation toward stress survival through the respective accumulation and degradation of (p)ppGpp by RelA and SpoT homologues. While mammalian genomes encode MESH1, a homologue of the bacterial (p)ppGpp hydrolase SpoT, neither (p)ppGpp nor its synthetase has been identified in mammalian cells. Here, we show that human MESH1 is an efficient cytosolic NADPH phosphatase that facilitates ferroptosis. Visualization of the MESH1-NADPH crystal structure revealed a bona fide affinity for the NADPH substrate. Ferroptosis-inducing erastin or cystine deprivation elevates MESH1, whose overexpression depletes NADPH and sensitizes cells to ferroptosis, whereas MESH1 depletion promotes ferroptosis survival by sustaining the levels of NADPH and GSH and by reducing lipid peroxidation. The ferroptotic protection by MESH1 depletion is ablated by suppression of the cytosolic NAD(H) kinase, NADK, but not its mitochondrial counterpart NADK2. Collectively, these data shed light on the importance of cytosolic NADPH levels and their regulation under ferroptosis-inducing conditions in mammalian cells.
Introduction
Stringent response is the main strategy for bacteria to cope with fluctuating nutrient supplies and metabolic and oxidative stresses1,2. This process rapidly redirects energy from cell proliferation toward stress survival by reduction of biosynthesis, conservation of ATP, and blockage of GTP production3. The stringent response is triggered by the accumulation of the bacterial “alarmone” (p)ppGpp (guanosine tetra- or penta-phosphate, shortened as ppGpp below) through the regulation of ppGpp synthetases and hydrolases in the RelA and SpoT Homologue family2.
Recent studies suggest that the stringent response may also function in metazoans, as metazoan genomes encode a homologue of bacterial SpoT—MESH1 (Metazoan SpoT Homolog 1, encoded by HDDC3)—that can hydrolyze ppGpp in vitro and functionally complement SpoT in E. coli4. Furthermore, Mesh1 deletion in Drosophila displays impaired starvation resistance and extensive transcriptional reprogramming4. Despite these supporting lines of evidence, neither ppGpp nor its synthetase has been discovered in metazoans, mystifying the genuine function and the relevant substrate(s) of MESH1 in mammalian cells. Here, we have identified NADPH as an efficient substrate of MESH1. MESH1 is a cytosolic NADPH phosphatase that is induced under stress conditions, leading to the NADPH depletion and ferroptosis—a novel form of iron-dependent regulated cell death characterized by lipid peroxidation5. Accordingly, MESH1 removal preserves the NADPH level in stressed cells and promotes their ferroptotic survival.
Results
MESH1 is an efficient NADPH phosphatase
We reasoned that MESH1 may function through alternate metabolic substrate(s) from ppGpp in mammalian cells and examined metabolites with a similar molecular architecture to ppGpp. The metabolite NADPH shares many similarities with ppGpp, including a purine nucleoside, a 2’-phosphate group, and a 5’-pyrophosphate group (Fig. 1a). Although NADPH differs from ppGpp in that it contains a 2’-phosphate instead of a 3’-pyrophosphate in ppGpp, the crystal structure of the bifunctional RelA/SpoT homologue from Streptococcus dysgalactiae subsp. equisimilis captured an unusual ppGpp derivative, GDP-2’,3’-cyclic monophosphate, in the active site of the hydrolase domain6, suggesting that the enzyme may accommodate a 2’-substituted phosphate group6. Based on the observation that SpoT catalyzes the hydrolysis of the 3’-pyrophosphate group of ppGpp, we predicted that MESH1 would similarly hydrolyze the 2’-phosphate group of NADPH to yield NADH and an inorganic phosphate (Fig. 1a).
Figure 1. MESH1 is a mammalian NADPH phosphatase.

a, Chemical similarity between NADPH and ppGpp, and the proposed chemical reaction of MESH1. b, Detection of the hMESH1-catalyzed phosphate release from NADPH by color change (yellow to green) in the malachite green assay. c, Linear product accumulation of the NADPH dephosphorylation reaction catalyzed by hMESH1 (n=3 biologically independent samples, error bars indicate s.d.). d, Validation of the formation of NADH by mass spectrometry analysis. This experiment was repeated for three independent times with similar results. e, Enzymatic characterization of hMESH1 toward NADPH and NADP+ (mean ± s.d., n=4 independent experiments). f, Effects of Zn2+ substitution and active site mutation on the specific activity of purified recombinant hMESH1 (mean ± s.d., n=3 independent experiments). g. hMESH1 is a significant contributor to the NADPH phosphatase activity in RCC4 lysates. Black dots represent siNT samples, and blue dots represent siMESH1 samples. n=4 biologically independent samples for each condition; Samples were analyzed by Western blot to confirm knock-down efficiency. h, Cell fractionation separating cytosol from nucleus and mitochondria, showing that MESH1 is specifically enriched in the cytosolic compartment. This representative western blot was repeated independently for 3 times on RCC4 cells and HEK-293T cells with similar results. Error bars indicate s.d. One-way ANOVA with Tukey HSD post-hoc test, *P<0.05, **P<0.01.
Indeed, treatment of NADPH with hMESH1 readily released inorganic phosphate, yielding a green solution in the malachite green assay7 (Fig. 1b). Importantly, the phosphate accumulation was linear over time (Fig. 1c), reflecting continuous enzymatic turnover of NADPH by hMESH1. Furthermore, mass spectrometry analysis revealed a peak at m/z 664.141 as [M-H]−, verifying the product as NADH (Fig. 1d). We then analyzed the steady state kinetics parameters of hMESH1 toward NADPH (Fig. 1e). hMESH1 is an efficient NADPH phosphatase, with a catalytic efficiency (kcat/KM) of 14.4 ± 1.1 s−1mM−1; its KM value of 0.12 ± 0.01 mM is on par with that from other reported cellular enzymes that utilize NADPH (e.g., KM value of 0.11 mM for the human phagocytic NADPH oxidase8), supporting its role as a physiologically relevant NADPH phosphatase in cells. While hMESH1 also displays measurable activity towards NADP+ in vitro, it is ~10-fold less efficient (kcat/KM = 1.4 ± 0.1 s−1mM−1), and its KM value of 0.43 ± 0.04 mM is significantly higher than the estimated cytosolic concentration of NADP+, rendering hMESH1 an ineffective phosphatase for NADP+ in cells (Fig. 1e).
Previous biochemical and structural analysis has revealed MESH1 as a Mn2+-dependent enzyme4. Accordingly, we found that the NADPH phosphatase activity of hMESH1 was reduced by >104-folds when Mn2+ was substituted with other metal ions, such as Zn2+ (Fig. 1f). Likewise, mutations of hMESH1 residues near the Mn2+ ion on the active site, including E65A and D66K, severely compromised the NADPH phosphatase activity by >104-folds in enzymatic assays (Fig. 1f).
In order to determine whether MESH1 is a significant contributor to the cellular NADPH phosphatase activity, we measured the enzymatic activity in cell lysates extracted from two human cell lines, RCC4 cells (a human clear cell renal carcinoma cell line) and HEK-293T cells (a human embryonic kidney cell line). We found that lysates from MESH1-silenced cells had a noticeable decrease of the NADPH phosphatase activity (Fig. 1g, Extended Data Fig. 1a). Conversely, overexpression of wild-type hMESH1, but not the catalytically deficient E65A hMESH1 mutant, markedly enhanced the cellular NADPH phosphatase activity (Extended Data Fig. 1b). We also investigated the primary subcellular compartment where MESH1 functions. Cellular fractioning experiments9 indicated that MESH1 was predominately enriched in the cytosolic, but not the mitochondrial or nuclear pools (Fig. 1h). Taken together, these observations verify hMESH1 as a significant contributor to the cytosolic NADPH phosphatase activity in human cells. It is worth noting that the siRNA of MESH1 did not suppress NADPH phosphatase activity completely, indicating the possible existence of another NADPH phosphatase or non-specific phosphatase activity released during sample processing that also contributed to the NADPH phosphatase activity in mammalian cells. One possible candidate is the NADP(H) phosphatase activity previously observed in rat liver lysates10, though the reported enzymatic activity favors NADP+ and the identity of the enzyme has remained unknown in animal cells11. Another contributor could be an unrelated mitochondrial NADPH phosphatase, Curl 12, reported after the release of our discovery at bioRxiv13. Therefore, to the best of our knowledge, the cytosolic NADPH phosphatase activity of MESH1 is distinct from the previously observed activity and unique to be studied and represents the first description of a cytosolic NADPH phosphatase in human cells.
Molecular recognition of NADPH by hMESH1
In order to visualize the molecular details of the NADPH recognition, we determined the co-crystal structure of the specific hMESH1-NADPH complex by comparing it to the catalytically compromised D66K mutant enzyme and by substituting the catalytic Mn2+ ion with Zn2+. The structure was refined to 2.1 Å resolution (Supplementary Table 1). The crystallographic asymmetric unit consists of two protomers of hMESH1 (Extended Data Fig. 2a), each adopting a compact fold of ten α-helices and a short β-hairpin (Fig. 2a) previously observed in the structure of apo hMESH14. Although the active sites of both protomers were occupied by the adenosine portion of the substrate (Extended Data Fig. 2b), the molecular recognition of the entire NADPH molecule, including that of the nicotinamide moiety, was only visible in one of the two protomers (Extended Data Fig. 2b), which is described below.
Figure 2. Structure of the hMESH1 (D66K)-NADPH complex.

a, The architecture of the hMESH1 active site. MESH1 is shown in the ribbon diagram, NADPH in the stick model, and the Zn2+ (grey) and Na+ (pink) ions are shown as spheres. Secondary structures are labeled, with MESH1-NADPH-interacting motifs annotated in magenta. b, Coordination of the active site Zn2+ ion in a distorted octahedral geometry. NADPH and sidechains of the Zn2+-binding residues are shown in the stick model. The zinc ion (grey) and its coordinating water molecule (red) are shown as spheres. The signature ‘HD’ motif is annotated in blue. c, The schematic illustration of the NADPH recognition by MESH1. Polar interactions are denoted with dashed lines, and vdW contacts are shown with curved lines. The locations of the metal ions and NADPH-interacting water molecules are denoted as circles. d, Molecular recognition of the 2’-phospho-adenosine diphosphate moiety. e, Molecular recognition of the nicotinamide riboside moiety.
The catalytic site of hMESH1 is formed at the center of the helical architecture, surrounded by the short β-hairpin (β1 and β2), α2, the α3-α4 loop, α4, α7, α8, the α8-α9 loop, and α9 (Fig. 2a). Anomalous scattering revealed the presence of a single Zn2+ ion in the active site, which substitutes the catalytic Mn2+ ion reported in the apo hMESH1 structure (Extended Data Fig. 2c). The Zn2+ ion is hexa-coordinated in a distorted octahedral geometry by H35 of α2, H61 and D62—the signature HD motif of the α2-α3 loop that defines this family of enzymes, D122 of α8, the catalytic water molecule, and the 2’-phosphate group of NADPH (Fig. 2b).
In addition to coordinating the active site metal ion, the 2’-phosphate group of NADPH forms additional polar interactions with Y32 of α2, K66 of α4, and N126 of α8 that are located one layer above the equatorial plane of the zinc ligands (Fig. 2c, d). K66, the mutated residue substituting D66 in the WT enzyme, not only significantly diminishes the catalytic activity, but also forms a direct salt bridge with the 2’-phosphate group of NADPH, a likely contributor to the successful capture of NADPH in the co-crystal structure. Another catalytically important residue, E65 of α4, the neighboring residue of D66, is located over 4 Å away from the catalytic water molecule, and its indirect interactions with the catalytic water molecule and the 2’-phosphate of NADPH are bridged by a second water molecule in the active site (Fig. 2c, d).
The NADPH adenosine ribose group and its adjacent 5’-pyrophosphate group are extensively recognized (Fig. 2c, d). The 3’-hydroxyl group and the 4’-oxygen atom form hydrogen bonds with Y146 of α9 and K25 of β1, respectively. The 5’-diphosphate group adopts a tight turn, aided by salt bridges with K97 of α7, K25 of β1 and a sodium ion. While sodium is an unusual cation to coordinate the NADPH diphosphate, our purification procedure and crystallization condition lack divalent cations other than Zn2+ but contain over 600 mM sodium chloride. Given that this density lacks anomalous Zn2+ signals (Extended Data Fig. 2b), it is interpreted as a sodium ion, though Mg2+ or Ca2+ might be more suitable ions in vivo. The adenine moiety of NADPH is largely coordinated by π-stacking with R24 of β1 and a direct hydrogen bond between its N7 atom and the amide group of K25 of the β1 loop (Fig. 2c, d). As both of these interactions are also found in a guanine base, hMESH1 lacks the ability to differentiate the adenine nucleotide from the guanine nucleotide as was found in ppGpp.
The ribose ring of the nicotinamide riboside is indirectly recognized by a water mediated hydrogen bond of its ring oxygen atom with R142 of α9, whereas the nicotinamide moiety is supported by a pi-stacking network with W138 and R142 that emanate from the α8-α9 loop and from α9 (Fig. 2c, e). The reduced electron density of the nicotinamide ring in NADP+ would weaken such interaction and likely contribute to the reduced substrate affinity in comparison to NADPH. Finally, the terminal amide group is additionally buttressed by two hydrogen bonds with H141 and E145 of α9. These structural observations reinforce the notion that hMESH1 is a bona fide NADPH phosphatase.
MESH1 regulates cellular NADPH levels and ferroptosis
After establishing hMESH1 as a significant contributor to the cellular NADPH phosphatase activity and elucidating its molecular recognition of NADPH, we investigated whether the NADPH phosphatase activity of MESH1 plays a role in ferroptosis, a regulated form of cell death driven by the lethal accumulation of lipid hydroperoxides14. Various genetic determinants of ferroptosis have been identified15–18. Importantly, ferroptosis can be triggered by erastin, an inhibitor of the cystine importer xCT5, or by cystine deprivation, and is alleviated by high concentrations of NADPH19. Accumulation of NADPH promotes the glutathione-reductase-catalyzed regeneration of reduced glutathione (GSH), which serves as the reductive cofactor for glutathione peroxidase 4 (GPX4) to detoxify lipid hydroperoxidates, thus protecting cells from ferroptotic cell death (Fig. 3a). We found that MESH1 was significantly upregulated in RCC4 cells at both mRNA and protein levels by erastin treatment or cystine deprivation (Fig. 3b, Extended Data Fig. 3a, b), implicating a functional role of MESH1 in these ferroptosis-inducing conditions. Overexpression of wild-type hMESH1 (MESH1-WT), but not the catalytically deficient mutant (MESH1-E65A), significantly lowered the intracellular NADP(H) level (Extended Data Fig. 3c) and sensitized cells to ferroptosis upon erastin treatment (Extended Data Fig. 3d). Taken together, these observations implicate a direct role of MESH1 in the execution of ferroptosis through degradation of NADPH.
Figure 3. MESH1 regulates cellular NADP(H) levels and ferroptosis.

a, A schematic model describing the roles of NADPH, MESH1, NADK and NADK2 in the cytosolic and mitochondrial NADPH/glutathione metabolisms and the targets of reported ferroptosis-inducing agents. b, Changes of MESH1 RNA levels in treated RCC4 cells. Left panel, RCC4 cells treated with DMSO or erastin (1μM); right panel, RCC4 cells cultured under regular (200 μM cystine) or cystine-deprived (0 μM cystine) media. RNA levels were quantified by rt-qPCR relative to the house keeping gene β-actin. c, Percentage changes of NADP(H) after one day treatment with 20 μM erastin (left) or cystine deprivation (right) when compared with control treatments (left: DMSO, right: full media) in RCC4 cells transfected with non-targeting (NT) siRNA or 2 distinct MESH1-targeting siRNAs. (left: n=6 biologically independent samples for siNT, n=3 biologically independent samples for siMESH1-CDS and siMESH1–3’UTR; right: n=3 biologically independent samples for each group). The MESH1 knock-down efficiency was validated by Western blot. This representative western blot was repeated for 3 biologically independent times with similar results. d, The lipid peroxidation of RCC4 cells with or without one-day treatment of erastin (1μM) accessed by C11-BODIPY and flow cytometry in cells transfected with non-targeting (NT) siRNA or 2 distinct MESH1-targeting siRNAs. The percentage of cells showing increased fluorescence (indicated by the bar) for each treatment are labeled. e, Time course of cell death in RCC4 cells transfected with non-targeting (NT) siRNA or 2 distinct MESH1-targeting siRNAs under erastin (0.625 μM) treatment for up to one week. f-i, The viability of RCC4 cells transfected with siNT (black) or two independent siMESH1 (blue) and treated with different concentrations of indicated ferroptosis-inducing conditions or agents for one day: f, cystine deprivation; g, sulfasalazine; h, ML-162; and i, RSL3. Each dot represents one sample; (b, e, f-i): n=3 biologically independent samples in each group. If unspecified, siMESH1 indicates siMESH1-CDS. RCC4 cells were transfected with siRNA for 2 days and then incubated with erastin for one day (c, d) or seven days (e). Black dots represent siNT samples, and blue dots represent siMESH1 samples. Error bars indicate s.d. Statistical analysis: (b,) two-tail Student’s t-test. (c) One-way ANOVA with Tukey HSD post-hoc test. (f, g) Two-way ANOVA with Tukey HSD post-hoc test. *P<0.05, **P<0.01, ***P<0.005, N.S., not significant.
In order to further assess the MESH1 function in ferroptosis, we investigated whether depletion of MESH1 and its associated NADPH phosphatase activity could mitigate lipid peroxidation and ferroptosis through the accumulation of NADPH and alteration of the glutathione redox potential. Erastin treatment dramatically reduced the level of NADP(H) (Fig. 3c) and increased degree of lipid peroxidation (Fig. 3d) in control (siNT) cells. Importantly, MESH1 silencing sustained a significantly higher level of NADP(H) under ferroptosis-inducing conditions (Fig. 3c; Extended Data Fig. 3e), and markedly reduced the level of lipid peroxidation (Fig. 3d) under erastin. In addition, MESH1 silencing robustly protected cells from erastin-induced death over a broad range of erastin concentrations (Extended Data Fig. 3f) when monitored for over a seven-day period using CellTox-Green assay that measures cell death by DNA staining (Fig. 3e). The ferroptosis protection of MESH1 silencing was further validated by multiple additional types of viability and death assays (Extended Data Fig. 4a–c). Such a ferroptosis-rescuing effect appeared to be general, as MESH1 depletion similarly promoted resistance to erastin-triggered ferroptosis in multiple cell lines, including HEK-293T, H1975, MDA-MB-231, PC3, HT1080, A673, PANC-1, and 786-O (Extended Data Fig. 5a–h).
After confirming the general role of MESH1 in ferroptosis regulation, we investigated at which signaling step MESH1 functions. We found that MESH1-depletion similarly conferred resistance to ferroptosis induced by cystine deprivation and sulfasalazine, another xCT inhibitor (Extended Data Fig. 3f, g), which trigger ferroptosis by depleting intracellular GSH. In comparison, inhibition of GPX4 downstream to NADPH and GSH also triggers ferroptosis (Fig. 3a), but MESH1 depletion could not rescue ferroptosis induced by different GPX4 inhibitors, such as ML-162 or RSL3 (Fig. 3h, i). These observations indicate that MESH1-depletion functions upstream of GPX4 and rescues ferroptosis by NADPH-driven repletion of reduced glutathione (GSH) (Fig. 3a). Consistent with this analysis, although no statistically significant effect on the levels of intracellular cysteine or oxidized glutathione (GSSG) were observed in MESH1-depletion cells, (Extended Data Fig 6a, b), we observed a significant increase of the GSH level and the GSH/GSSG ratio (Extended Data Fig. 6c, d).
NADPH phosphatase activity of MESH1 contributes to ferroptosis
Next, we investigated the specific roles of the enzymatic activities of MESH1 in the ferroptosis-related phenotypes. We found that the resistance to erastin-induced ferroptosis is directly correlated with the loss of the catalytic activity of MESH1, as the ferroptotic survival phenotype in MESH1-depletion cells was abolished when WT MESH1, but not the catalytically deficient E65A mutant of MESH1 was expressed (Fig. 4a).
Figure 4. The ferroptosis resistance phenotypes are caused by the loss of the cytosolic NADPH phosphatase activity of MESH1.

a, Percentage of cell viability of RCC4 cells after erastin (5 μM) treatment for one day. Lentivirus with the empty vector, MESH1-WT, or MESH1-E65A, were stably transduced into RCC4 prior to siRNA transfection. The experiments were repeated for 3 biologically independent times with similar results. The knockdown and overexpression efficiencies were validated by Western blot. b, Knockdown of the cytosolic enzyme NADK, but not mitochondrial enzyme NADK2, eliminated the ferroptosis protection in MESH1 silenced cells. c, Co-silencing of NADK, but not NADK2, reduced the NADP(H) levels accomplished with MESH1 silencing. d, Normalized levels of MESH1, NADK and NADK2 in cells treated with indicated siRNAs. The mRNA abundance was quantified by rt-qPCR relative to the house keep gene β-actin, and presented in fold change (2∆∆CT). This representative rt-qPCR were repeated for 3 independent times with similar results. If unspecified, siMESH1 indicates siMESH1-CDS. RCC4 cells were transfected with siRNA for 2 days and then incubated with erastin for one day (a, b). Black dots represent siNT samples, and blue dots represent siMESH1 samples. Error bars indicate s.d. (for (a,b,c,d) n=3 biologically independent samples per condition). Statistical analysis: (a, b, c) two-way ANOVA with Tukey HSD post-hoc test, *P<0.05, **P<0.01, ***P<0.005, N.S., not significant.
Besides NADPH, the bacterial ppGpp is also a previously identified in vitro substrate of MESH14, which has been suggested as a signaling molecule despite the lack of evidence of its presence in mammalian cells. In order to verify that the enhanced survival under ferroptosis-inducing erastin treatment is dependent on a higher sustained level of NADPH, but not due to accumulation of any other in vitro substrate of hMESH1, such as ppGpp, we tested whether the survival advantage of MESH1 depletion is reversed by simultaneous depletion of NAD(H) kinases that convert NAD(H) to NADP(H). Human cells have two NAD kinases, NADK and NADK2, that are predominantly located in the cytosol and mitochondria20,21, respectively (Fig. 3a). As the cytosolic and mitochondrial pools of NADP(H) and NAD(H) are compartmentalized in mammalian cells due to the impermeability of these molecules across the mitochondrial membranes22, we reasoned that removal of the NAD kinase either from the cytosol (NADK) or mitochondria (NADK2) would reduce the distinct pools of NADP(H) and only the cytosolic NADK depletion would compromise the ferroptosis survival phenotypes of MESH1-silenced cells. Indeed, when the gene encoding the cytosolic enzyme NADK was silenced, the survival benefit of silencing MESH1 was largely eliminated (Fig. 4b, Extended Data Fig. 7). In contrast, silencing the gene encoding the mitochondrial enzyme NADK2 did not affect the MESH1-depletion-mediated ferroptosis survival (Fig. 4b, Extended Data Fig. 7). Consistent with this notion, we found the cellular NADP(H) was significantly diminished when NADK was silenced, whereas silencing of NADK2 had little effect on cellular NADP(H) (Fig. 4c, d), suggesting a limited role of NADK2 in this process. Importantly, the mRNA expression level of MESH1, as measured by the normalized reads in the RNA-Seq, was comparable (within 0.5–4 folds) to that of other genes in the NADPH-glutathione pathway (Fig. 3a), including NADK, NADK2, NNT (NAD(P) Transhydrogenase, Mitochondrial), G6PD (Glucose-6-Phosphate Dehydrogenase), PGD (Phosphogluconate Dehydrogenase), GSR (Glutathione reductase), and NOX1 (NADPH oxidase 1) (Extended Data Fig. 8), supporting a functional role of MESH1 in mediating the essential cytosolic metabolite NADPH.
Taken together, our results establish MESH1 as the first cytosolic NADPH phosphatase that is induced by ferroptosis-inducing conditions and is involved in the execution of ferroptosis by degrading NADPH. Conversely, depletion of MESH1 and its NADPH phosphatase activity under ferroptosis-inducing conditions promotes stress survival by preserving NADPH, elevating GSH, and mitigating lipid peroxidation.
Discussion
MESH1, the metazoan homolog of the bacterial ppGpp hydrolase SpoT, has been implicated in the cellular response to metabolic starvation in Drosophila, though the functional role and pertinent mammalian cell substrate of MESH1 has not been elucidated4. The discovery of MESH1 as a cytosolic NADPH phosphatase that contributes to the execution of ferroptosis through degradation of the central metabolite NADPH directly addresses this mystery and implicates a physiological role of MESH1 in disposing cells damaged by metabolic and redox disorders.
Ferroptosis is a distinct form of iron-dependent cell death5 that is triggered by oxidative stresses and characterized by the accumulation of lipid peroxidation products23. Even with the recent discovery of many genetic determinants 15–18,24,25 of ferroptosis by regulating lipid metabolism, iron availability, ROS and anti-oxidant capacity, much still remains unknown about the molecular mechanisms regulating the ferroptosis. Our discovery of MESH1 as a NADPH phosphatase reveals an important role of the MESH1-mediated NADPH depletion and impairment of the glutathione regeneration in the execution of ferroptosis. Ferroptosis also has emerging roles in other pathophysiological processes and human diseases, such as neurotoxicity26, acute renal failure27, hepatic28 and cardiac29 injuries and ischemia-reperfusion injury30. Therefore, modulating ferroptosis may have therapeutic potentials, and the newly discovered MESH1 NADPH phosphatase activity and our structural elucidation of the hMESH1-NADPH may be harnessed for developing potential therapeutics for the treatment of these devastating diseases involving dysregulated ferroptosis.
METHODS
Purification of recombinant hMESH1
The gene encoding hMESH1 was codon optimized for E. coli expression, synthesized, and cloned into a modified pET28a vector as a C-terminal fusion to the His6-tagged SUMO protein. Cultures of transformed E. coli strain BL21(DE3)* were grown to an optical density at 600 nm (OD600) between 0.4 and 0.5 and induced with 1 mM Isopropyl β-D-1-thiogalactopyranoside (IPTG) at 37 °C for 2 hours. Following cell lysis, the target protein was purified using Ni2+-NTA affinity chromatography following standard protocols (Qiagen). The SUMO tag was cleaved using the SENP1 protease, and both the tag and protease were removed by a second round of Ni2+-NTA chromatography. The target protein was further purified using size-exclusion chromatography (Superdex 75, GE life sciences) in a buffer containing 50 mM Tris pH 8.0, 200 mM NaCl, and 0.1% 2-mercaptoethanol. Mutants of hMESH1 were generated using the QuikChange site-directed mutagenesis kit (Agilent) and prepared using the same procedure.
Mass spectrometry
RPLC-ESI/MS/MS for NADH and NADPH was performed using a Shimadzu LC system (comprising a solvent degasser, two LC-10A pumps and a SCL-10A system controller) coupled to a high-resolution TripleTOF5600 mass spectrometer (Sciex). LC was operated at a flow rate of 200 μL/min with a linear gradient as follows: 100% of mobile phase A was held isocratically for 2 min and then linearly increased to 100% mobile phase B over 5 min and held at 100% B for 2 min. Mobile phase A was a mixture of water/acetonitrile (98/2, v/v) containing 0.1% acetic acid. Mobile phase B was a mixture of water/acetonitrile (10/90, v/v) containing 0.1% acetic acid. A Zorbax SB-C8 reversed-phase column (5 μm, 2.1 × 50 mm) was obtained from Agilent. The LC eluent was introduced into the ESI source of the mass spectrometer. Instrument settings for negative ion ESI/MS and MS/MS analysis of lipid species were as follows: Ion spray voltage (IS) = −4500 V; Curtain gas (CUR) = 20 psi; Ion source gas 1 (GS1) = 20 psi; De-clustering potential (DP) = −55 V; Focusing potential (FP) = −150 V. Data acquisition and analysis were performed using the Analyst TF1.5 software (Sciex).
The sample preparation process for quantification of cysteine, GSH, and GSSG was carried out using an automated MicroLab STAR system (Hamilton). After removal of the protein fraction, the extract was divided into two fractions: one for analysis by LC (GSH, GSSG) and one for analysis by GC (cysteine). The LC/MS portion of the platform is based on a Waters ACQUITY UPLC and a Thermo-Finnigan LTQ mass spectrometer, which consists of an electrospray ionization (ESI) source and linear ion-trap (LIT) mass analyzer. The sample extract was analyzed using acidic positive ion optimized conditions. Extracts reconstituted in acidic conditions were gradient eluted using water and methanol both containing 0.1% formic acid, while the basic extracts, which also used water/methanol, contained 6.5 mM ammonium bicarbonate. The MS analysis alternated between MS and data-dependent MS2 scans using dynamic exclusion. The samples destined for GC/MS analysis were re-dried under vacuum desiccation for a minimum of 24 hrs prior to being derivatized under nitrogen using bistrimethyl-silyl-triflouroacetamide (BSTFA). The GC column was 5% phenyl and the temperature ramp from 40 °C to 300 °C in a 16 min period. Samples were analyzed on a Thermo-Finnigan Trace DSQ fast-scanning single-quadrupole mass spectrometer using electron impact ionization. The information output from the raw data files was automatically extracted. For ions with counts greater than 2 million, an accurate mass measurement could be performed. Accurate mass measurements could be made on the parent ion as well as fragments. The typical mass error was less than 5 ppm. Identification of known chemical entities was based on comparison to metabolomic library entries of purified standards. The combination of chromatographic properties and mass spectra gave an indication of a match to the specific compound or an isobaric entity.
Enzymology
Enzymatic assays for hMESH1 were performed in a buffer containing 50 mM Tris pH 8, 200 mM NaCl, and 1 mM MnCl2 or ZnCl2. Michaelis-Menten kinetics assays for NADPH and NADP+ were carried out using 50 nM or 500 nM enzyme, respectively and serial dilutions of substrate concentration starting at 1 mM. Reactions were stopped by the addition of formic acid (3 M final concentration) at 2 min, 4 min, 6 min, 8 min, and 10 min time points. Specific activities of purified hMESH1 mutants were determined using 93 μM Zn replaced, 33 μM E65K, 100 μM D66K or 50 nM WT enzyme with 1 mM NADPH, with the reaction stopped at 30 minutes for each mutant and 10 minutes for the WT. Specific activities of the knockdown cell lysates were performed using diluted cell lysate (1/40,000 in Tris-NaCl with 1 mM MnCl2) and reactions stopped at 15 min, 30 min, 45 min, 60 min, 75 min and 90 min. The amount of released phosphate was assessed using the malachite green reagent7 by mixing equal parts reaction mixture and malachite green reagent and measuring the absorbance at 630 nm. Values for KM and Vmax were calculated from the Michaelis-Menten equation.
X-ray crystallography
Crystals of hMESH1 bound to NADPH were formed using the hanging drop vapor diffusion method. Immediately prior to crystallization, hMESH1 was treated with 10 mM EDTA for 30 min and exchanged into a buffer containing no metal before addition of 1 mM ZnCl2. Diffracting quality crystals were obtained by mixing equal volumes of the protein solution (9 mg/mL hMESH1, 100 mM NADPH, 50 mM Tris pH 8.0, 200 mM NaCl and 0.1% 2-mercaptoethanol) with the mother liquor solution (200 mM ammonium acetate, 100 mM sodium citrate, and 25% PEG 4000) by streak-seeding with apo hMesh1 crystals. To improve NADPH occupancy, crystals were additionally soaked in the mother liquor solution containing 750 mM NADPH for 1 hour prior to cryoprotection in a solution containing 525 mM NADPH, 10 mM ZnCl2, 20% ethylene glycol, and 70% precipitant solution and flash frozen in liquid nitrogen.
X-ray data were collected at Southeast Regional Collaborative Access Team (SER-CAT) 22-BM beamline at the Advanced Photon Source, Argonne National Laboratory and processed using the XDS package31. The structure was determined by molecular replacement with the program Phaser32 and by using the previously reported structure of apo hMESH1 (3NR1) as the search model. Iterative model building and refinement was carried out using COOT33 and PHENIX34.
MESH1-silencing using RNAi
Non-targeting siRNA (siNT) was purchased from Qiagen (AllStars Negative Control siRNA, SI03650318). Other siRNA includes: siMESH1-CDS (target sequence GGGAAUCACUGACAUUGUG, D-031786–01, Dharmacon), siMESH1–3’UTR (target sequence CTGAAGGTCTCCTGCTAACTA, SI04167002, Qiagen), siATF4 (target sequence GAUCAUUCCUUUAGUUUAG, CAUGAUCCCUCAGUGCAUA, GUUUAGAGCUGGGCAGUGA, CUAGGUACCGCCAGAAGAA, M-005125–02, Dharmacon), siNADK (target sequence UGAAUGAGGUGGUGAUUGA, CGCCAGCGAUGAAAGCUUU, GAAGACGGCGUGCACAAU, CCAAUCAGAUAGACUUCAU, M-006318–01, Dharmacon), and siNADK2 (target sequence GCAAUUGCUUCGAUGAUGA, GAGAAUUGGUAGAGAAAGU, UGUGAAAGCUGGACGGAUA, UUUGAUUACUGGCGAGAAU, M-006319–01, Dharmacon). If not specified, siMESH1 indicates siMESH1-CDS. The efficacies of these siRNA were accessed by rt-qPCR, Western blots or both. For enzymatic activity analysis, 8 × 10⁵ RCC4 cells were seeded in a 100 mm plate, and transfected after one day of growth with 600 pmole of siRNA and 40 μL Lipofectamine RNAiMAX (ThermoFisher Scientific, #13778150) for 72 hours before the collection of cell lysates. For NADP(H) measurement, 8 × 10⁴ cells were seeded per well of 6-well plates with 40 pmole of siRNA and transfected using 3μL of Lipofectamine RNAiMAX for 48 hours before drug treatment for one day. For viability assays, 2,800 RCC4 cells were seeded per well on 96-well plates with 5 pmole of siRNA and 0.4 μL Lipofectamine RNAiMAX for at least 48 hours before drug treatment for one day. To collect RNA or protein, 105 RCC4 cells were seeded in a well of a 6-well plate with 40 pmole of siRNA and 3μL of Lipofectamine RNAiMAX for 72 hours before collection.
MESH1 overexpression
Stable RCC4 cell lines with MESH1-WT (RefSeq: NM_001286451.1) or MESH1-E65A expression were generated using lentiviral vector pLX30235 (a gift from David Root, Addgene plasmid #25896) without expression of the V5 tag. Briefly, virus was generated by transfecting HEK-293T cells with a 0.1:1:1 ratio of pMD2.G: psPAX2: pLX302 with TransIT-LT1 Transfection Reagent (Mirus, MIR2305). pMD2.G and psPAX2 were gifts from Didier Trono (Addgene plasmid #12259 and # 12260, respectively). Virus was collected 48 hours after transfection. Stable cell lines were generated by adding 200 μL virus to a 60 mm dish of RCC4 cells with 8 μg/mL polybrene. 1 μg/mL puromycin was used for selection. Complete death in blank infection dishes was used to determine the success of infection and the length of puromycin selection. The efficiency of overexpression was determined by Western blotting.
Transient overexpression of MESH1 in HEK-293T cells for the NADP(H) content assay or enzymology assay was achieved by using the pCMV6-neo vector (OriGene, SC334209). Briefly, 2 × 10⁵ HEK-293T cells were seeded in one well of a 6-well plate for 24 hours, and then 1 μg of the plasmid (pCMV6-neo empty vector or with MESH1-WT or MESH1-E65A) was transfected with TransIT-LT1 Transfection Reagent (Mirus) for additional 48 hours before collection.
Cell culture
The RCC4 cell line was provided by Denise Chan (University of California, San Francisco, San Francisco, CA) and was authenticated by DDC (DNA Diagnostics Center) Medical using the short tandem repeat method in November 2015. HEK-293T, H1975, MDA-MB-231, 786-O, PC3, HT1080, A673, and PANC1 were obtained from the Duke Cell Culture Facility whose origins were ATCC. All cell lines were tested negative for mycoplasma before use. All cells were cultured in DMEM with 4.5 g/L glucose and 4 mM Glutamine (11995-DMEM, ThermoFisher Scientific) and 10% heat-inactivated fetal bovine serum (Hyclone # SH30070.03HI) in a humidified incubator, at 37 °C with 5% CO2.
Ferroptosis induction
Ferroptosis was induced by drug treatment with erastin (Cayman #17754), sulfasalazine (Sigma S0883), ML-162 (Cayman #20455), or RSL3 (Cayman #19288) at the concentrations indicated in the figure for one day, or by cystine deprivation. Cystine deprived media were prepared as described36–38 using the DMEM, high glucose, no glutamine, no methionine, no cystine media (ThermoFisher Scientific, 21013024) with 10% dialyzed Fetal Bovine Serum (Sigma, F0392), L-Methionine (Sigma, M5308, final concentration 30 mg/L), L-glutamine (ThermoFisher, #25030–081, final concentration 4mM), and with added L-Cystine (Sigma, C6727) at 200 μM for regular full media or at the concentrations indicated in the figures.
NADP(H) measurement
The Amplite™ colorimetric NADPH assay kit (#15272, ATT Bioquest) was used to measure NADP(H) (both NADP+ and NADPH) in this study. Briefly, cells were seeded into a 6-well plate with siRNA or plasmid as described in the “MESH1-silencing using RNAi” section. NADP(H) was collected using 100 μL of the provided lysis buffer. The NADP(H) content was measured and normalized by protein content of the lysate, quantified by the BCA assay. In cells treated with erastin or cystine deprivation, the NADP(H) change is normalized with NADP(H) measured in DMSO-treated cells or cells in regular full media.
NADPH sensor experiments
For the NADPH biosensor assay, HEK-293T cells (6000 cells/well in 96-well plate) were counted and reverse transfected with control or indicated MESH1 siRNA using Lipofectamine RNAiMAX (Invitrogen). After 24 h, the cells were transfected with iNAP1 biosensor39 using TransIT-LT1 (Mirus Bio). After overnight incubation, the media was replaced with 20 µM of Erastin. After 16 h, dual-excitation ratios were acquired with excitation filters 420 nm, and 485 nm, and emission filter 528 nm for both. Background subtraction were performed by subtracting the intensity of the sample without transfecting iNAP1.
Viability and death measurement
Multiple viability and cell death assays were used to probe cell viability and death. The cell viability was measured by the CellTiter-Glo assay (Promega #G7570), which quantifies intracellular ATP by luminescence as an indicator of viability, or by Crystal Violet staining of the attached live cells, which is quantified by dissolving in 10% acetic acid and measured by the absorbance at 570 nm. Cell death under erastin with multiple time points was evaluated by the CellTox-Green Cytotoxicity assay (Promega, #G8741), which stains DNA in dead cells. The cell death was further confirmed with the CytoTox-Fluor assay (Promega #G9260), which quantified protease release from broken cells in the cell culture media. The fluorescence intensity, absorbance, and luminescence intensity were measured by using a plate reader (FLUOstar Optima, BMG lab tech).
Lipid Peroxidation measurement
The C11-BODIPY dye (D3861, ThermoFisher Scientific) was used to determine lipid ROS levels according to the manufacturer’s instruction. Cells were reverse transfected with siRNAs as indicated in six-well plates for two days, and then treated with 1 µM erastin overnight. The next day, the cells were incubated with 10 µM C11-BODIPY-containing medium for 1 hour. Later, the cells were harvested by 0.25% trypsin-EDTA treatment and washed three times with ice-cold PBS followed by re-suspension in PBS containing 1% BSA. The amount of ROS within cells was determined by flow cytometry analysis (FACSCanto™ II, BD Biosciences).
Protein lysate collection and Western blots
Cell lysates were collected in a buffer containing 50 mM Tris pH 8.0 and 200 mM NaCl (for enzymology), in the NADP(H) lysis buffer (for NADP(H) measurement), or in the Radioimmunoprecipitation assay (RIPA) buffer (Sigma, R0278) with protease inhibitors (Roche, 11836170001). For Western blots, 15–50 μg of lysates were loaded on SDS-PAGE gels, semi-dry transferred to the PDVF membrane, blocked with 5% milk in TBST with 0.1% Tween-20, then incubated with primary antibodies overnight at 4°C. Anti-GAPDH antibody (Santa Cruz, sc-25778, lot number J1416), anti-MESH1 antibody (Abcam, ab118325, lot number GR290347–1 and GR75995–5), anti-β-tubulin antibody (Cell Signaling Technology, #2128 S, lob number 7), anti-citrate synthetase antibody (GeneTex, GTX110624, lot number 41724), anti-histone-H3 antibody D1H2 (Cell Signaling Technology, #4499, lot number 1) anti-mouse-IgG HRP (Cell Signaling Technology, #7076S, lot number 32; and Bio-Techne, HAF007, lot number FIM2815031), and anti-rabbit-IgG HRP (Cell Signaling Technology, #7074S, lot number 26)) were used in this study. All the primary antibodies were diluted 1:1000 in 5% BSA and secondary antibodies (anti-mouse-IgG HRP and anti-rabbit-IgG HRP) were diluted 1:3000 in 5% BSA before use. The images were developed by SuperSignal West Pico PLUS Chemiluminescent substrate (ThermoFisher, #34577) or Amersham ECL Prime Western Blotting Detection Reagent (GE Healthcare Life Sciences, RPN2232) and exposed in the ChemiDoc imaging system (Biorad).
Quantitative real-time PCR
RNA was extracted using the RNeasy kit (Qiagen, 74104) following manufacturer’s instructions. 500 ng of total RNA with or without reverse transcriptase were prepared using a SensiFast cDNA synthesis kit (Bioline, BIO-65054) for real-time PCR comparison with the Power SYBRGreen Mix (ThermoFisher Scientific, 4367659). Primers were designed across exons whenever possible using PrimerBot! developed by Jeff Jasper at Duke University. Primer sequences used in this study are listed here: MESH1-rt-F: GAGGCGGGAATCACTGACAT; MESH1-rt-R:TTGTGCCCCAAAGTGTAGCT; NADK-rt-F: CACAATGGGCTGGGTGAGAA; NADK-rt-R: TTGGACAGGTAGGAGGAGGG; NADK2-rt-F: GCTCTACAGTCCGGAAGAACC; NADK2-rt-R: GCATCCCAACAACGAGAACG; beta-actin-rt-F: GGGGTGTTGAAGGTCTCAAA; beta-actin-rt-R: GGCATCCTCACCCTGAAGTA. The product of PCR was validated for specificity by DNA electrophoresis.
Reporting summary
Further details on research resources and design are linked in the Nature Reporting Summary here.
Data availability statement
The data that support the findings of this study are available from the corresponding authors upon request. The coordinate of the hMesh1 D66K-NADPH complex has been deposited in the PDB databank under accession code 5VXA. The RNA-Seq data have been deposited into NCBI GEO with accession number: GSE114282.
Extended Data
Extended Data Figure 1, MESH1 contributes to the NADPH phosphatase activity in cells.

NADPH phosphatase activity of HEK-293T was estimated by incubating NADPH with cell lysates with different MESH1 status; phosphate release over time was measured by the malachite green assay and normalized by the total lysate protein (μmol/min/mg total lysate protein). a, Significantly decreased cellular NADPH phosphatase activity by silencing MESH1 in HEK-293T cells. b, Increased cellular NADPH phosphatase activity with overexpression of WT MESH1, but not with overexpression of enzymatically deficient MESH1 (MESH1-E65A) in HEK-293T cells. Black dots represent siNT or empty vector samples, blue dots represent siMESH1 samples, red dots represent MESH1-WT samples, and grey dots represent MESH1-E65A samples. Error bars represent s.d. (n=3 biologically independent samples per condition). Statistical analysis: one way ANOVA with Tukey HSD post-hoc, **P<0.01, N.S., not significant.
Extended Data Figure 2. MESH1 asymmetric unit, omit map, and Zn2+ anomalous phasing.

a, Crystallographic asymmetric unit is shown with two protomers of hMESH1 in the ribbon diagram and NADPH molecules in the stick model. b, 2mFo-DFc omit maps for the ADP (left and middle) and nicotinamide riboside moieties (right) of the NADPH molecules contoured to 0.8σ in purple mesh. c, The active site of each protomer is shown along with density from Zn2+ anomalous scattering contoured to 6σ in black mesh.
Extended Data Figure 3. Up-regulation of MESH1 protein and its regulation of NADP(H) and cell survival during ferroptosis.

a-b, The levels of MESH1 protein were determined by Western blots of MESH1 and β-tubulin protein in RCC4 cells treated with (a) DMSO vs. erastin (3 µM; 12h) or (b) 200 or 0 µM for 20h. All the representative western blots were repeated for 3 biologically independent times with similar results. c, Overexpression of WT MESH1, but not the MESH1 E65A mutant, significantly reduced the intracellular NADP(H) content in RCC4 cells. d, Overexpression of MESH1-WT, but not MESH1-E65A, sensitized the cell death to erastin treatment in RCC4 cells. Black dots represent empty vector samples, red dots represent MESH1-WT samples, and grey dots represent MESH1-E65A samples. e, MESH1 silencing restored the intracellular NAPDH level decreased by erastin treatment. HEK-293T cells transfected with the NADPH fluorescent biosensor, iNAP1, and siNT or two independent siMESH1 RNAs were treated with 20 µM of erastin. The ratio of fluorescence excited at 420 nm and 485 nm indicated the cellular NADPH level. The fluorescence ratios of individual treatments were normalized to that of the control condition. (n=6 biologically independent samples). f, The viability of RCC4 cells transfected with siNT (black) or two independent siMESH1 (blue) and treated with indicated concentrations erastin for one day. Each dot represents one sample; there are three biologically independent samples (n=3) in each group unless otherwise specified. Error bars indicate s.d. Statistical analysis: one-way ANOVA with Tukey HSD post-hoc test, *P<0.05, **P<0.01.
Extended Data Figure 4. MESH1 depletion conferred resistance to ferroptosis in multiple assays.

a-c, Erastin-induced cell death is rescued by MESH1 silencing in RCC4 cells using multiple cell death and viability assays: a, Cytotox-Flour for measuring protease release in the media due to cell death; b, Crystal violet staining for attached viable cells; and c, CellTiter-Glo for intracellular ATP and viability. Error bars indicate s.d. (n=3 biologically independent samples per condition). Statistical analysis: one-way ANOVA with Tukey HSD post-hoc test, *P<0.05, **P<0.01.
Extended Data Figure 5. MESH1 depletion increased resistance to ferroptosis in multiple cell lines.

a-h. Erastin-induced ferroptotic cell death of indicated cell lines was rescued by MESH1 silencing as accessed by CellTiter-Glo: a, HEK-293T cells exposed to erastin 2.5 μM for one day; b, lung adenocarcinoma cell line H1975 with erastin 10 μM for two days; c, breast cancer cell line MDA-MB-231 with erastin 2.5 μM for one day; d, prostate cancer cell line PC3 with erastin 10 μM for one day; e, fibrosarcoma cell line HT1080 with erastin 2.5 μM for one day; f, Ewing’s sarcoma cell line A673 with erastin 2.5 μM for one day; g, pancreatic carcinoma cell line PANC1 with erastin 2.5 μM for one day, and h, clear cell renal carcinoma cell line 786-O with erastin 5 μM for one day. Black dots represent siNT samples, blue dots represent siMESH1 samples. Error bars indicate s.d. (n=3 biologically independent samples per condition). Statistical analysis: one-way ANOVA with Tukey HSD post-hoc test, *P<0.05, **P<0.01.
Extended Data Figure 6. MESH1-depletion increased the ratio of reduced glutathione over oxidized glutathione.

a-d, The level of indicated metabolites in RCC4 transfected with non-targeting (NT) siRNA or MESH1-targeting siRNA were quantified by mass spectrometry and normalized by DNA content, a, cysteine; b, oxidized glutathione (GSSG); c, reduced glutathione (GSH) (effect size 1.746, p=0.0491); and d, normalized intensity ratio of GSH/GSSG. n=5 biologically independent samples per condition. Each box plot was defined by a lower line (at the 25th percentile), a central line (at the centre), and a higher line (at the 75th percentile). The whisker boundaries marked the minima and the maxima of the data. Statistical analysis: two-tail student’s t-test, *P<0.05.
Extended Data Figure 7. MESH1 silenced cells were re-sensitized to erastin-induced cell death upon NADK silencing.
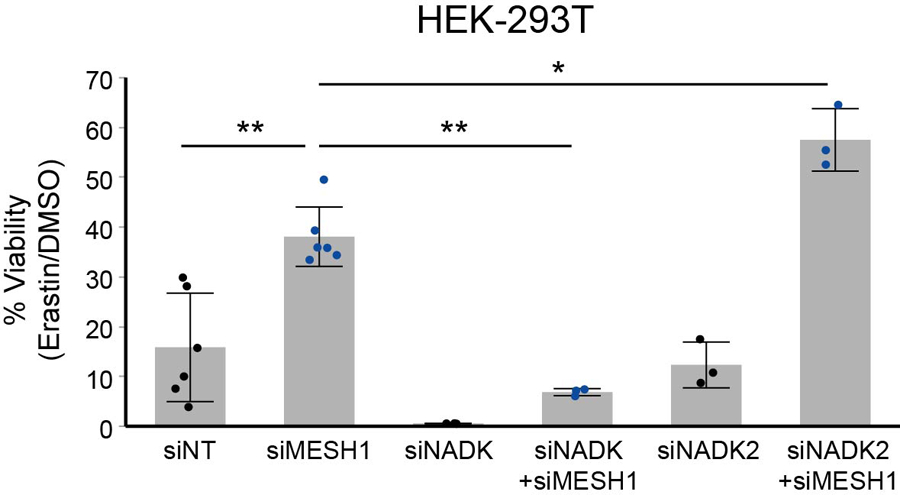
Percentage of cell viability of HEK-293T cells after treatment with erastin 10 μM for one day, showing simultaneously silencing MESH1 with NADK, but not NADK2, restored sensitivity to erastin-induced ferroptosis. Black dots represent siNT samples, blue dots represent siMESH1 samples. Error bars indicate s.d. (for siNT and siMESH1 n=6 biologically independent samples per condition; for other genetic conditions n=3 biologically independent samples). Statistical analysis: ANOVA with Tukey HSD post-hoc test *P<0.05, **P<0.01.
Extended Data Figure 8. Relative expression levels of genes involved in the NADPH and glutathione metabolisms.
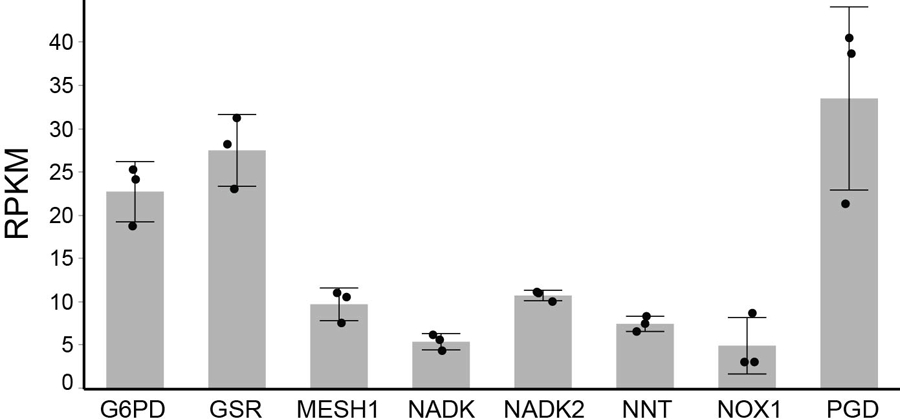
Three plates of RCC4 cells were sequenced and the relative expression levels of the indicated genes were calculated by RPKM (Reads per kilo base per million mapped reads). Error bars indicate s.d. (n=3 biologically independent samples per condition).
Supplementary Material
Acknowledgements
This work was supported in part by DOD grants (W81XWH-17–1-0143, W81XWH-15–1-0486, W81XWH-19-1-0842 to JTC), Emerson Collective (to JTC), NIH grants GM124062 (to JTC and PZ) and GM115355 (to PZ), the Duke Bridge Fund, Duke Cancer Institute (DCI) Discovery fund and DCI pilot fund. X-ray diffraction data were collected at the Southeast Regional Collaborative Access Team (SER-CAT) 22-BM beamline at the Advanced Photon Source, Argonne National Laboratory, supported by the US Department of Energy, Office of Science and the Office of Basic Energy Sciences under Contract number W-31-109-Eng-38. We appreciate the great suggestions and help from the X. Shen lab.
Footnotes
Competing Interests Statements:
The authors declare no competing interests.
References
- 1.Srivatsan A & Wang JD Control of bacterial transcription, translation and replication by (p)ppGpp. Current opinion in microbiology 11, 100–105, 10.1016/j.mib.2008.02.001 (2008). [DOI] [PubMed] [Google Scholar]
- 2.Potrykus K & Cashel M (p)ppGpp: still magical? Annu Rev Microbiol 62, 35–51, 10.1146/annurev.micro.62.081307.162903 (2008). [DOI] [PubMed] [Google Scholar]
- 3.Kriel A et al. Direct regulation of GTP homeostasis by (p)ppGpp: a critical component of viability and stress resistance. Mol Cell 48, 231–241, 10.1016/j.molcel.2012.08.009 (2012). [DOI] [PMC free article] [PubMed] [Google Scholar]
- 4.Sun D et al. A metazoan ortholog of SpoT hydrolyzes ppGpp and functions in starvation responses. Nat Struct Mol Biol 17, 1188–1194, 10.1038/nsmb.1906 (2010). [DOI] [PubMed] [Google Scholar]
- 5.Dixon SJ et al. Ferroptosis: an iron-dependent form of nonapoptotic cell death. Cell 149, 1060–1072, 10.1016/j.cell.2012.03.042 (2012). [DOI] [PMC free article] [PubMed] [Google Scholar]
- 6.Hogg T, Mechold U, Malke H, Cashel M & Hilgenfeld R Conformational antagonism between opposing active sites in a bifunctional RelA/SpoT homolog modulates (p)ppGpp metabolism during the stringent response [corrected]. Cell 117, 57–68 (2004). [DOI] [PubMed] [Google Scholar]
- 7.Baykov AA, Evtushenko OA & Avaeva SM A malachite green procedure for orthophosphate determination and its use in alkaline phosphatase-based enzyme immunoassay. Analytical biochemistry 171, 266–270 (1988). [DOI] [PubMed] [Google Scholar]
- 8.Petheo GL & Demaurex N Voltage- and NADPH-dependence of electron currents generated by the phagocytic NADPH oxidase. The Biochemical journal 388, 485–491, 10.1042/BJ20041889 (2005). [DOI] [PMC free article] [PubMed] [Google Scholar]
- 9.Clayton DA & Shadel GS Isolation of mitochondria from cells and tissues. Cold Spring Harb Protoc 2014, pdb top074542, 10.1101/pdb.top074542 (2014). [DOI] [PubMed] [Google Scholar]
- 10.Navas P, Minnifield N, Sun I & Morre DJ NADP phosphatase as a marker in free-flow electrophoretic separations for cisternae of the Golgi apparatus midregion. Biochim Biophys Acta 881, 1–9 (1986). [DOI] [PubMed] [Google Scholar]
- 11.Pollak N, Dolle C & Ziegler M The power to reduce: pyridine nucleotides--small molecules with a multitude of functions. The Biochemical journal 402, 205–218, 10.1042/BJ20061638 (2007). [DOI] [PMC free article] [PubMed] [Google Scholar]
- 12.Estrella MA et al. The metabolites NADP(+) and NADPH are the targets of the circadian protein Nocturnin (Curled). Nat Commun 10, 2367, 10.1038/s41467-019-10125-z (2019). [DOI] [PMC free article] [PubMed] [Google Scholar]
- 13.Ding C-KC et al. Mammalian stringent-like response mediated by the cytosolic NADPH phosphatase MESH1. bioRxiv, 10.1101/325266 (2018). [DOI]
- 14.Yang WS & Stockwell BR Ferroptosis: Death by Lipid Peroxidation. Trends Cell Biol 26, 165–176, 10.1016/j.tcb.2015.10.014 (2016). [DOI] [PMC free article] [PubMed] [Google Scholar]
- 15.Stockwell BR et al. Ferroptosis: A Regulated Cell Death Nexus Linking Metabolism, Redox Biology, and Disease. Cell 171, 273–285, 10.1016/j.cell.2017.09.021 (2017). [DOI] [PMC free article] [PubMed] [Google Scholar]
- 16.Chen PH et al. Kinome screen of ferroptosis reveals a novel role of ATM in regulating iron metabolism. Cell Death Differ, 10.1038/s41418-019-0393-7 (2019). [DOI] [PMC free article] [PubMed]
- 17.Yang WH, Ding CKC, Sun T, Hsu DS & Chi JT The Hippo Pathway Effector TAZ Regulates Ferroptosis in Renal Cell Carcinoma Cell Reports 28, 2501–2508.e2504 (2019). [DOI] [PMC free article] [PubMed] [Google Scholar]
- 18.Yang WH et al. A TAZ-ANGPTL4-NOX2 axis regulates ferroptotic cell death and chemoresistance in epithelial ovarian cancer. Molecular Cancer Research, molcanres.0691.2019, 10.1158/1541-7786.Mcr-19-0691 (2019). [DOI] [PMC free article] [PubMed]
- 19.Shimada K, Hayano M, Pagano NC & Stockwell BR Cell-Line Selectivity Improves the Predictive Power of Pharmacogenomic Analyses and Helps Identify NADPH as Biomarker for Ferroptosis Sensitivity. Cell Chem Biol 23, 225–235, 10.1016/j.chembiol.2015.11.016 (2016). [DOI] [PMC free article] [PubMed] [Google Scholar]
- 20.Ohashi K, Kawai S & Murata K Identification and characterization of a human mitochondrial NAD kinase. Nat Commun 3, 1248, 10.1038/ncomms2262 (2012). [DOI] [PMC free article] [PubMed] [Google Scholar]
- 21.Pollak N, Niere M & Ziegler M NAD kinase levels control the NADPH concentration in human cells. J Biol Chem 282, 33562–33571, 10.1074/jbc.M704442200 (2007). [DOI] [PubMed] [Google Scholar]
- 22.Lewis CA et al. Tracing compartmentalized NADPH metabolism in the cytosol and mitochondria of mammalian cells. Mol Cell 55, 253–263, 10.1016/j.molcel.2014.05.008 (2014). [DOI] [PMC free article] [PubMed] [Google Scholar]
- 23.Yang WS & Stockwell BR Ferroptosis: Death by Lipid Peroxidation. Trends in Cell Biology 26, 165–176, 10.1016/j.tcb.2015.10.014 (2016). [DOI] [PMC free article] [PubMed] [Google Scholar]
- 24.Doll S et al. ACSL4 dictates ferroptosis sensitivity by shaping cellular lipid composition. Nat Chem Biol 13, 91–98, 10.1038/nchembio.2239 (2017). [DOI] [PMC free article] [PubMed] [Google Scholar]
- 25.Tarangelo A et al. p53 Suppresses Metabolic Stress-Induced Ferroptosis in Cancer Cells. Cell Rep 22, 569–575, 10.1016/j.celrep.2017.12.077 (2018). [DOI] [PMC free article] [PubMed] [Google Scholar]
- 26.Skouta R et al. Ferrostatins inhibit oxidative lipid damage and cell death in diverse disease models. Journal of the American Chemical Society 136, 4551–4556 (2014). [DOI] [PMC free article] [PubMed] [Google Scholar]
- 27.Angeli JPF et al. Inactivation of the ferroptosis regulator Gpx4 triggers acute renal failure in mice. Nature cell biology 16, 1180 (2014). [DOI] [PMC free article] [PubMed] [Google Scholar]
- 28.Du K et al. Inhibiting xCT/SLC7A11 induces ferroptosis of myofibroblastic hepatic stellate cells and protects against liver fibrosis. bioRxiv, 2019.2012.2023.886259, 10.1101/2019.12.23.886259 (2019). [DOI]
- 29.Gao M, Monian P, Quadri N, Ramasamy R & Jiang X Glutaminolysis and transferrin regulate ferroptosis. Molecular cell 59, 298–308 (2015). [DOI] [PMC free article] [PubMed] [Google Scholar]
- 30.Linkermann A et al. Synchronized renal tubular cell death involves ferroptosis. Proc Natl Acad Sci U S A 111, 16836–16841, 10.1073/pnas.1415518111 (2014). [DOI] [PMC free article] [PubMed] [Google Scholar]
Method References
- 31.Kabsch W Xds. Acta crystallographica 66, 125–132, 10.1107/S0907444909047337 (2010). [DOI] [PMC free article] [PubMed] [Google Scholar]
- 32.McCoy AJ et al. Phaser crystallographic software. Journal of applied crystallography 40, 658–674 (2007). [DOI] [PMC free article] [PubMed] [Google Scholar]
- 33.Emsley P & Cowtan K Coot: model-building tools for molecular graphics. Acta crystallographica 60, 2126–2132 (2004). [DOI] [PubMed] [Google Scholar]
- 34.Adams PD et al. PHENIX: a comprehensive Python-based system for macromolecular structure solution. Acta crystallographica 66, 213–221, 10.1107/S0907444909052925 (2010). [DOI] [PMC free article] [PubMed] [Google Scholar]
- 35.Yang X et al. A public genome-scale lentiviral expression library of human ORFs. Nat Methods 8, 659–661, 10.1038/nmeth.1638 (2011). [DOI] [PMC free article] [PubMed] [Google Scholar]
- 36.Tang X et al. Comprehensive profiling of amino acid response uncovers unique methionine-deprived response dependent on intact creatine biosynthesis. PLoS Genet 11, e1005158, 10.1371/journal.pgen.1005158 (2015). [DOI] [PMC free article] [PubMed] [Google Scholar]
- 37.Tang X et al. Cystine Deprivation Triggers Programmed Necrosis in VHL-Deficient Renal Cell Carcinomas. Cancer Res 76, 1892–1903, 10.1158/0008-5472.CAN-15-2328 (2016). [DOI] [PMC free article] [PubMed] [Google Scholar]
- 38.Tang X et al. Cystine addiction of triple-negative breast cancer associated with EMT augmented death signaling. Oncogene 36, 4379, 10.1038/onc.2017.192 (2017). [DOI] [PubMed] [Google Scholar]
- 39.Tao R et al. Genetically encoded fluorescent sensors reveal dynamic regulation of NADPH metabolism. Nat Methods 14, 720–728, 10.1038/nmeth.4306 (2017). [DOI] [PMC free article] [PubMed] [Google Scholar]
Associated Data
This section collects any data citations, data availability statements, or supplementary materials included in this article.
Supplementary Materials
Data Availability Statement
The data that support the findings of this study are available from the corresponding authors upon request. The coordinate of the hMesh1 D66K-NADPH complex has been deposited in the PDB databank under accession code 5VXA. The RNA-Seq data have been deposited into NCBI GEO with accession number: GSE114282.