

Abstract
Study objective:
To develop a discrete event simulation of emergency department (ED) patient flow for the purpose of forecasting near-future operating conditions and to validate the forecasts with several measures of ED crowding.
Methods:
We developed a discrete event simulation of patient flow with evidence from the literature. Development was purely theoretical, whereas validation involved patient data from an academic ED. The model inputs and outputs, respectively, are 6-variable descriptions of every present and future patient in the ED. We validated the model by using a sliding-window design, ensuring separation of fitting and validation data in time series. We sampled consecutive 10-minute observations during 2006 (n = 52,560). The outcome measures—all forecast 2, 4, 6, and 8 hours into the future from each observation—were the waiting count, waiting time, occupancy level, length of stay, boarding count, boarding time, and ambulance diversion. Forecasting performance was assessed with Pearson’s correlation, residual summary statistics, and area under the receiver operating characteristic curve.
Results:
The correlations between crowding forecasts and actual outcomes started high and decreased gradually up to 8 hours into the future (lowest Pearson’s r for waiting count = 0.56; waiting time = 0.49; occupancy level = 0.78; length of stay = 0.86; boarding count = 0.79; boarding time = 0.80). The residual means were unbiased for all outcomes except the boarding time. The discriminatory power for ambulance diversion remained consistently high up to 8 hours into the future (lowest area under the receiver operating characteristic curve = 0.86).
Conclusion:
By modeling patient flow, rather than operational summary variables, our simulation forecasts several measures of near-future ED crowding, with various degrees of good performance.
INTRODUCTION
Background
The Institute of Medicine recently noted that emergency department (ED) crowding represents an obstacle to the safe and timely delivery of health care.1,2 Previous research has linked ED crowding with adverse patient outcomes,3–7 impaired access to care,8–15 and decreased profitability.16–18
A substantial body of literature has focused on techniques for measuring the phenomenon of ED crowding, with the intent of allowing care providers, administrators, and policymakers to better manage the problem.19–23 At least 2 major problems are associated with measuring ED crowding. First, the lack of a standard crowding definition makes it difficult for unified progress to be made because different interpretations exist for what the term “crowding” should imply. A recent editorial emphasized the need for measuring ED patient flow, rather than measuring crowding itself.24
Second, proposed measures of ED crowding have tended to focus on the present crowding state, and reports of forecasting the future crowding state have been relatively recent.25–30 Predictions of the near-future status of the ED would arguably have substantial value because they could trigger early interventions designed to lessen the burden of crowding situations before they arise.31–35 A focus on forecasting the future, in addition to monitoring the present, may represent the difference between being reactive and being proactive in managing ED crowding.
Importance
Both of the above research gaps may be addressed by using a novel application of computer simulation in the ED. We attempt to demonstrate that, with a sufficiently detailed simulation of ED patient flow, near-future forecasts of almost any crowding measurement of interest may be obtained from a single model. The feasibility of developing an ED simulation model has already been well established.36–44 Previous studies have focused on using simulation to evaluate the effect of hypothetical changes in ED operations. However, to the best of our knowledge, no previous studies have explored the ability of an ED simulation to serve as a generalized, real-time forecasting model.
Goals of This Investigation
The first goal of this study was to develop a computer simulation for the specific purpose of real-time forecasting of ED operating conditions. The second goal was to validate the ability of the simulation to forecast several measures of ED crowding.
MATERIALS AND METHODS
Theoretical Model of the Problem
Our study was based on the following premise: With a simulation model that expresses ED crowding in terms of individual patients and their characteristics, perhaps we could forecast any outcome measure of interest. The conceptual process of obtaining forecasts from an ED simulation is outlined in Figure 1. The model would consist of a set of theoretical distributions governing patient flow, with parameters calculated from historical patient data. The model would be initialized with a detailed list of patients in the ED at the observation time of interest, such that the state of the “virtual ED” would mirror the state of the actual ED. The model would then simulate patient flow for several “virtual hours” into the future. On halting, the simulation would provide a detailed list of ED patients projected to be present several hours in the future. Because the output would contain patient-level data, rather than summary variables, theoretically any outcome measure of interest could be calculated to obtain a crowding forecast.
Figure 1.
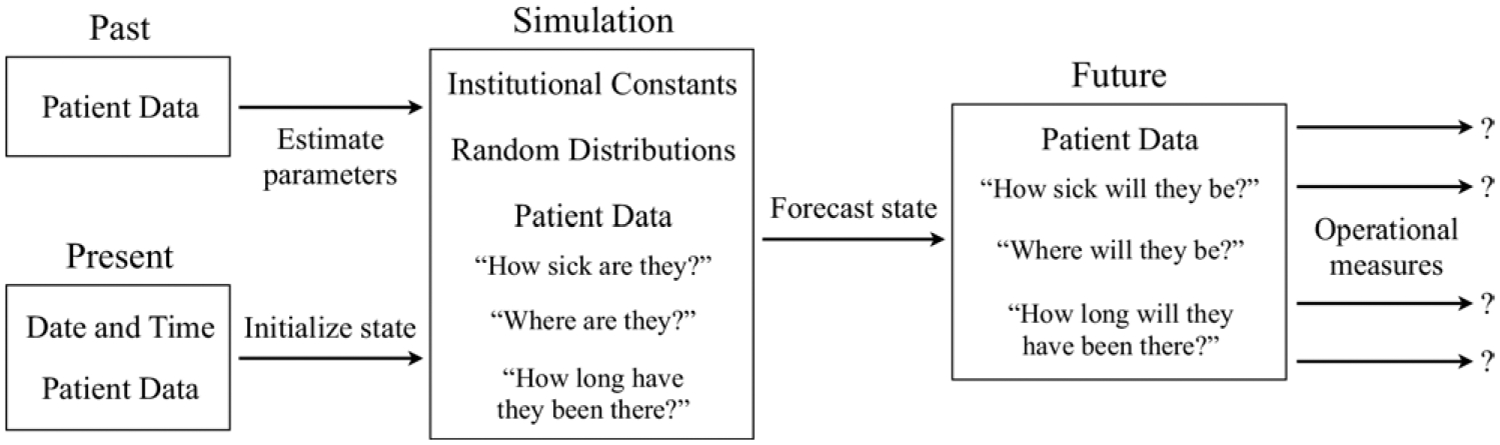
Conceptual process of using a simulation model to forecast ED operations. The model would take past and present patient-level data as input and would give future patient-level data as output. Any outcome measure of interest could theoretically be calculated using this information to obtain a forecast.
The development of the “ForecastED” model was theoretical, guided by evidence from the literature. An input throughput-output framework of ED operations was used as the prototype.45 Three constraints were placed on the design: The model should (1) reflect care processes that substantially contribute to ED crowding, to facilitate forecasting power; (2) minimize input data requirements, to facilitate generalizability between institutions; and 3) execute quickly, to facilitate real-time forecasting. An interdisciplinary team, consisting of experts in patient care, operations research, medical informatics, and biostatistics, developed the model. The development proceeded iteratively until all team members agreed that the constraints were satisfied.
We assumed that patient arrival (Figure 2, point A) rates vary according to the time of day and day of week.46 We represented patient arrivals with a nonstationary Poisson process,43 in which an exponential distribution governed the time between arrivals.47 The simulation uses a previously reported algorithm to implement the random nonstationary Poisson process during the 168 hours in a week.48
Figure 2.
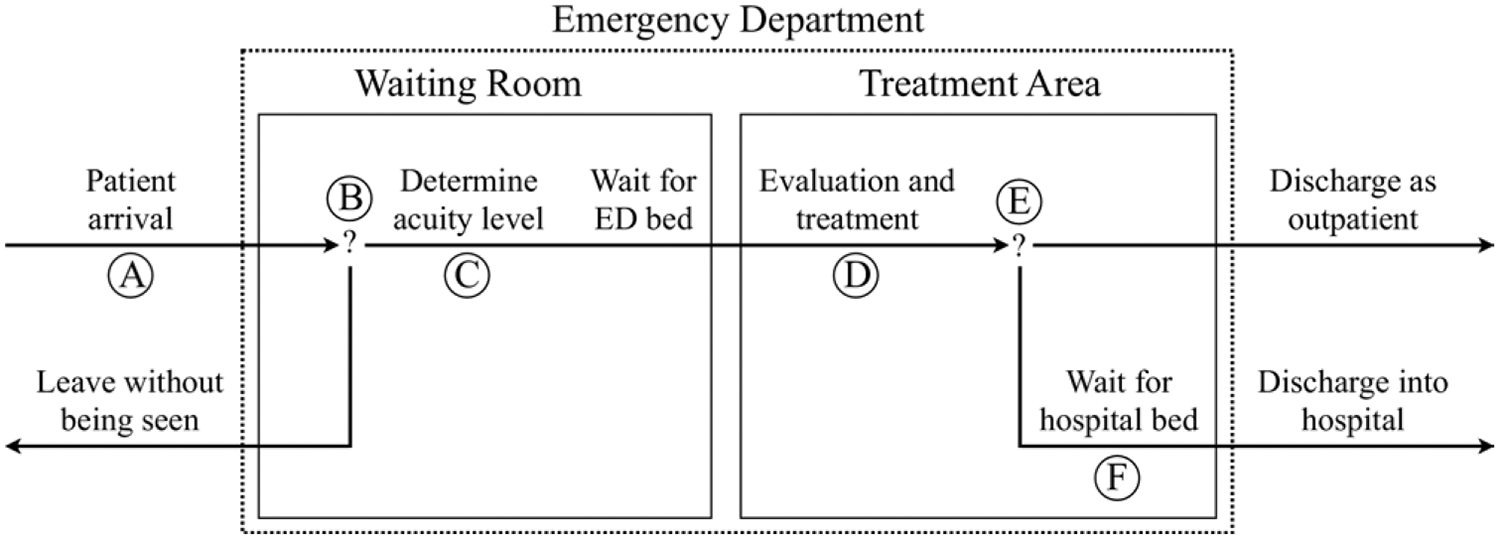
Diagram of patient flow through the ForecastED simulation. Six random processes, marked by circled letters, drive all aspects of patient flow. A, Patient arrivals as a nonstationary Poisson process, dependent on the time of the day and day of the week; B, decisions to leave without being seen as a Bernoulli trial, dependent on the waiting room count; C, patient acuity levels as a multinomial distribution; D, duration of evaluation and treatment as a log-normal distribution, dependent on the acuity level; E, hospital admission decisions as a Bernoulli trial, dependent on the acuity level; and F, hospital bed openings as a nonstationary Poisson process, dependent on the time of the day and day of the week.
Some patients leave the ED without being seen (Figure 2, point B),14,15 and we assumed this decision would be influenced by the waiting room count.49 We justified this on the grounds that, from a patient’s perspective, the most visible indicator of ED crowding is the number of patients in the waiting room. We represented this process with a logistic regression model, with the waiting room count as the independent variable and whether the patient left without being seen as the dependent variable. The simulation transforms the log odds to a probability of leaving without being seen for each patient50 and then uses a single random Bernoulli trial, based on the waiting room count at the time of arrival, to determine whether the patient would leave.
Patients are commonly triaged with an ordinal ranking scheme (Figure 2, point C).51–53 We represented the chance of belonging to each acuity level by using a multinomial distribution.47 The simulation places the most urgent patients into beds immediately, without regard to bed availability. This provides a mechanism by which, under extreme operating conditions, the licensed capacity may be exceeded out of necessity. The simulation retains all other patients in the waiting room, prioritizing them for beds by the most urgent acuity level and resolving ties according to waiting time. The simulation allows the number of acuity levels and licensed beds to vary between institutions.
We assumed that sicker patients generally require more extensive ED care (Figure 2, point D). The log-normal, gamma, and Weibull distributions all take similar shapes and commonly govern service time patterns.47 The simulation uses a separate log-normal distribution within each acuity level to represent the duration of evaluation and treatment after bed placement for each patient.
We assumed that sicker patients would be more frequently admitted to the hospital (Figure 2, point E). On completion of the evaluation and treatment for each patient, the simulation uses a random Bernoulli trial to determine whether the patient should be admitted. The simulation uses a separate admission probability for each acuity level. The simulation immediately discharges outpatients, whereas it retains admitted patients in the ED pending hospital bed availability.
Boarding of admitted patients in the ED has been suggested to be a major contributor to ED crowding (Figure 2, point F).54,55 We assumed that some hospital processes, such as operating room schedules, affect inpatient bed availability according to daily and weekly patterns. The simulation represents the process of hospital bed openings using a nonstationary Poisson process, analogous to the one used to represent patient arrivals.47,48 The simulation prioritizes admitted patients for hospital beds according to boarding time.
We implemented the ForecastED simulation by using the standard C programming language. The simulation generates all random numbers from 1 stream of the Mersenne Twister algorithm, which has been statistically validated for the purpose of simulation.56 The final products of the development phase were the assumptions and implementation that govern ForecastED; specific numeric parameters were not estimated until the validation phase. This flexibility was intended to allow the most recent patient data at any setting to be used to update the parameters governing the simulated processes, reflecting our assumption that the numbers will vary between institutions or between seasons at a given institution.
Study Design
We validated the ForecastED simulation model with historical data from consecutive patient encounters during a 400-day period (December 1, 2005, to January 5, 2007) at a single institution. The study did not involve any direct patient contact, and the local institutional review board approved it by expedited review.
We obtained forecasts from the model at consecutive 10-minute observations during 2006 (n = 52,560) by using the conceptual method described above and outlined in Figure 1. At every observation, the parameters of each random distribution required by the simulation were refit by maximum likelihood estimation with the preceding 4 weeks of historical patient data. This sliding-window validation technique, illustrated in Figure 3, ensured that the data used for fitting were separate from the data used for validation at all times. This also ensured that the parameters remained up to date throughout the year to reflect seasonal variations.
Figure 3.
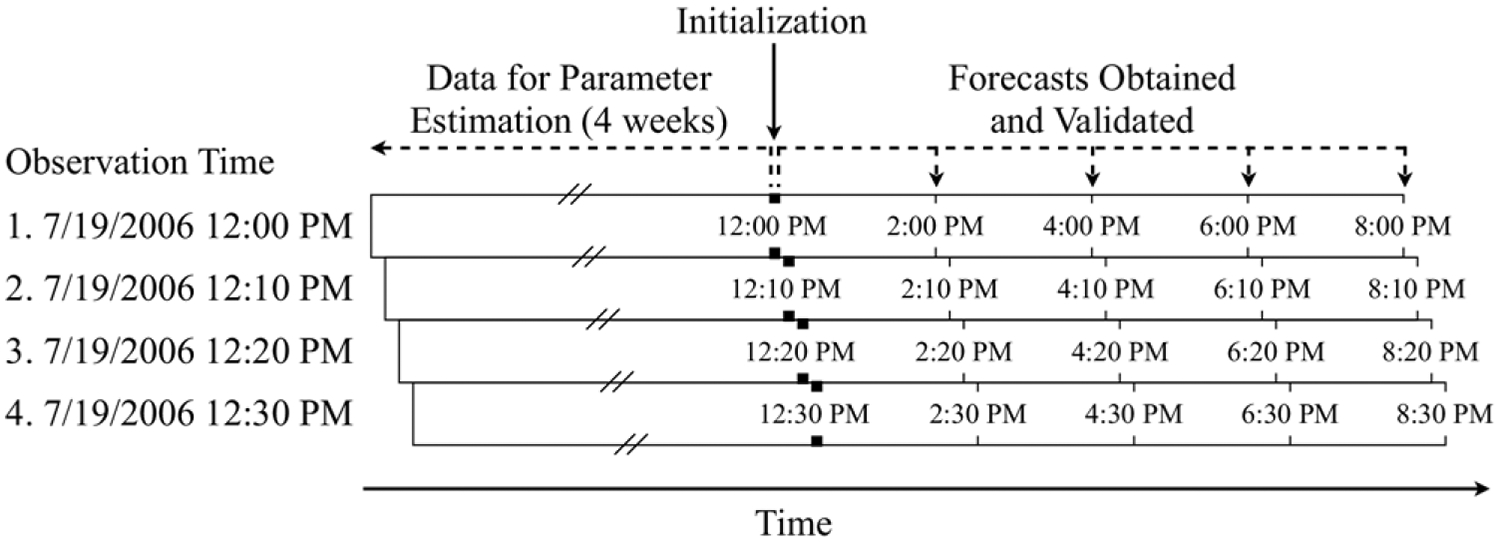
Example application of the sliding-window validation technique. At consecutive 10-minute observations, the distribution parameters were reestimated with 4 weeks of historical patient data. The simulation forecast the operating conditions at various points in the future. This technique ensured the data used for fitting and validation never overlapped.
For example, when validating the model at noon on July 19, 2006, we would (1) estimate all parameters with 4 weeks of past patient data (from noon on June 21, 2006, to noon on July 19, 2006); (2) initialize the simulation with data from all patients present in the ED (at noon on July 19, 2006); and (3) terminate the simulation in the future (at 2PM, 4PM, 6PM, and 8PM on July 19, 2006) to obtain the relevant forecasts. We would repeat the entire process 10 minutes later, 20 minutes later, and so forth throughout the year. Thus, in a sliding-window validation, there is no single division between the data used for parameter estimation and validation; rather, the division is relative according to the current observation time.
Setting
The validation took place in the adult ED of a tertiary care, urban, academic medical center with a Level I trauma service. The adult ED provides care for more than 50,000 patients annually. It contains 41 licensed, monitored beds, including 4 trauma beds. Four additional fast-track beds are available for low-acuity patients from 11AM to 11PM, and 8 dedicated rooms are available for psychiatric patients. Patients are triaged according to the Emergency Severity Index, an ordinal score ranging from 1, for the most urgent patients, to 5, for the least urgent patients.51 Hospital policy allows for the ED to initiate ambulance diversion if any of the following criteria are true and are not expected to improve within 1 hour: “(1) all critical care beds in the ED are occupied, patients are occupying hallway spaces, and at least 10 patients are waiting; (2) an acuity level exists that places additional patients at risk; or (3) all monitored beds within the ED are full.” In practice, ambulance diversion is generally initiated when all licensed beds are occupied and 10 or more patients are in the waiting room.
Selection of Participants
We used data from all patients who received care in the adult ED during the study period, with the following exceptions: Patients with only psychiatric complaints were excluded because they are treated in a separate unit, and crossover between general purpose and psychiatric beds is rare. Patients who were dead on arrival to the ED, as well as patients who were directly admitted to a critical care unit without being treated in the ED, were excluded because they were not considered substantial contributors to ED crowding.
Data Collection and Processing
The following describes the minimal set of patient-level variables required for the simulation: (1) time of initial registration at the ED, (2) time placed into an ED treatment bed, (3) time of hospital bed request if applicable, (4) time of discharge from the ED facility, (5) triage category assigned to the patient, and (6) whether the patient left without being seen. We obtained these patient data from the ED information systems, which collect the data during normal ED operations by using a real-time patient tracking application. Ambulance diversion log files were obtained from the hospital’s aeromedical service.
Outcome Measures
Using the mean of 1,000 simulation replications, we forecast the following measures of ED crowding 2, 4, 6, and 8 hours into the future from every observation: (1) waiting count, defined as the number of patients in the waiting room; (2) waiting time, defined as the average time since presentation among patients in the waiting room; (3) occupancy level, defined as the total number of patients in ED beds divided by the number of licensed treatment beds (this value may exceed 100% when patients are treated in nonlicensed areas such as hallway beds or chairs); (4) length of stay, defined as the average time since presentation among all patients in ED beds; (5) boarding count, defined as the number of patients awaiting hospital admission; (6) boarding time, defined at the average time since hospital bed request among patients awaiting hospital admission; and (7) probability of ambulance diversion, defined as a close approximation of the local diversion policy using the probability of having 10 or more patients in the waiting room and an occupancy level of at least 100%. The reference standard for validating each forecast outcome measure was the actual outcome measure at the respective point in the future.
Primary Data Analysis
We checked the assumptions underlying the simulation’s random processes by comparing the observed and theoretical distributions for all patients receiving care during 2006.
We used the Pearson’s r coefficient of correlation to measure the reliability of the simulation forecasts for each continuous outcome measure in comparison with the reference standard. The Pearson’s r measures the strength of linear association and, when squared, summarizes the fraction of explained variation in the outcome. The Pearson’s r was calculated with 95% confidence intervals (CI) using 250 iterations of the ordinary bootstrap method.57
Substantial autocorrelation likely exists in the time series of each continuous outcome measure. Thus, the present state of the ED may be considered a naive forecast of the future state of the ED. To provide a control measure for judging the reliability of the simulation forecasts, we measured the autocorrelation coefficient for each reference standard time series at lags of 2, 4, 6, and 8 hours. The autocorrelation coefficient is equivalent to the Pearson’s r between a series and a time-delayed version of itself. When the Pearson’s r correlation roughly equals the autocorrelation, the simulation provides little additional value; conversely, when the Pearson’s r correlation exceeds the autocorrelation, the simulation provides additional predictive information. The autocorrelation coefficients were calculated with 95% CI by using 250 iterations of the ordinary bootstrap method.57
Correlation coefficients alone do not imply good calibration of the simulation forecasts.58 To detect any presence of bias, we calculated the mean and standard deviation of the residual difference between each continuous outcome measure and the reference standard. A residual mean that differs from zero, in proportion to the standard deviation, indicates the presence of a systematic bias in the forecasts.
We calculated the discriminatory power of the simulation forecasts for ambulance diversion with the area under the receiver operating characteristic curve. This curve summarizes overall discriminatory power for the outcome, in which a value of 1.0 represents perfect discrimination and a value of 0.5 represents no discrimination.59 The area under the receiver operating characteristic curve was calculated with 95% CI, using 250 iterations of the ordinary bootstrap method.57
We measured the total time required to execute the simulation during the experiment because computational time would be a consideration for the real-time application of the ForecastED system. All statistical analyses were conducted using R (version 2.3.1; available online at http://www.r-project.org).
RESULTS
A total of 57,995 patients visited the adult ED during the study period, of which 4,776 patients were excluded (8.2%). The medians and interquartile ranges for each continuous outcome measure during the 2006 calendar year were the following: waiting count = 2 patients (1 to 6), waiting time = 13 minutes (0 to 50), occupancy level = 83% (63 to 95), length of stay = 6.4 hours (4.4 to 9.1), boarding count = 10 patients (5 to 16), and boarding time = 6.8 hours (3.1 to 10.5). A total of 188 ambulance diversion episodes occurred during the 2006 calendar year, representing 23% of the total time.
The distributions of observed and theoretical random distributions governing the ForecastED model are shown in Figure 4. The theoretical distributions closely matched the observed distributions. The average rate of patient arrivals ranged from a minimum of 1.6 per hour on Thursdays from 4AM to 5AM to a maximum of 10.3 per hour on Mondays from 11AM to noon. The probability of each patient leaving without being seen increased smoothly from 0.6% with no patients in the waiting room to 4.8% with 15 patients in the waiting room. The fraction of patients assigned to each triage category for acuity levels 1 through 5, respectively, was 0.7%, 37.8%, 44.2%, 15.8%, and 1.4%. The median duration of treatment for acuity levels 1 through 5, respectively, was 4.0 hours, 4.6 hours, 3.1 hours, 1.7 hours, and 1.2 hours. The probability of hospital admission for acuity levels 1 through 5, respectively, was 73.1%, 45.3%, 17.1%, 2.7%, and 1.0%. The average rate of hospital bed openings ranged from a minimum of 0.1 per hour on Thursdays from 7AM to 8AM, to a maximum of 3.3 per hour on Fridays from 9PM to 10PM.
Figure 4.
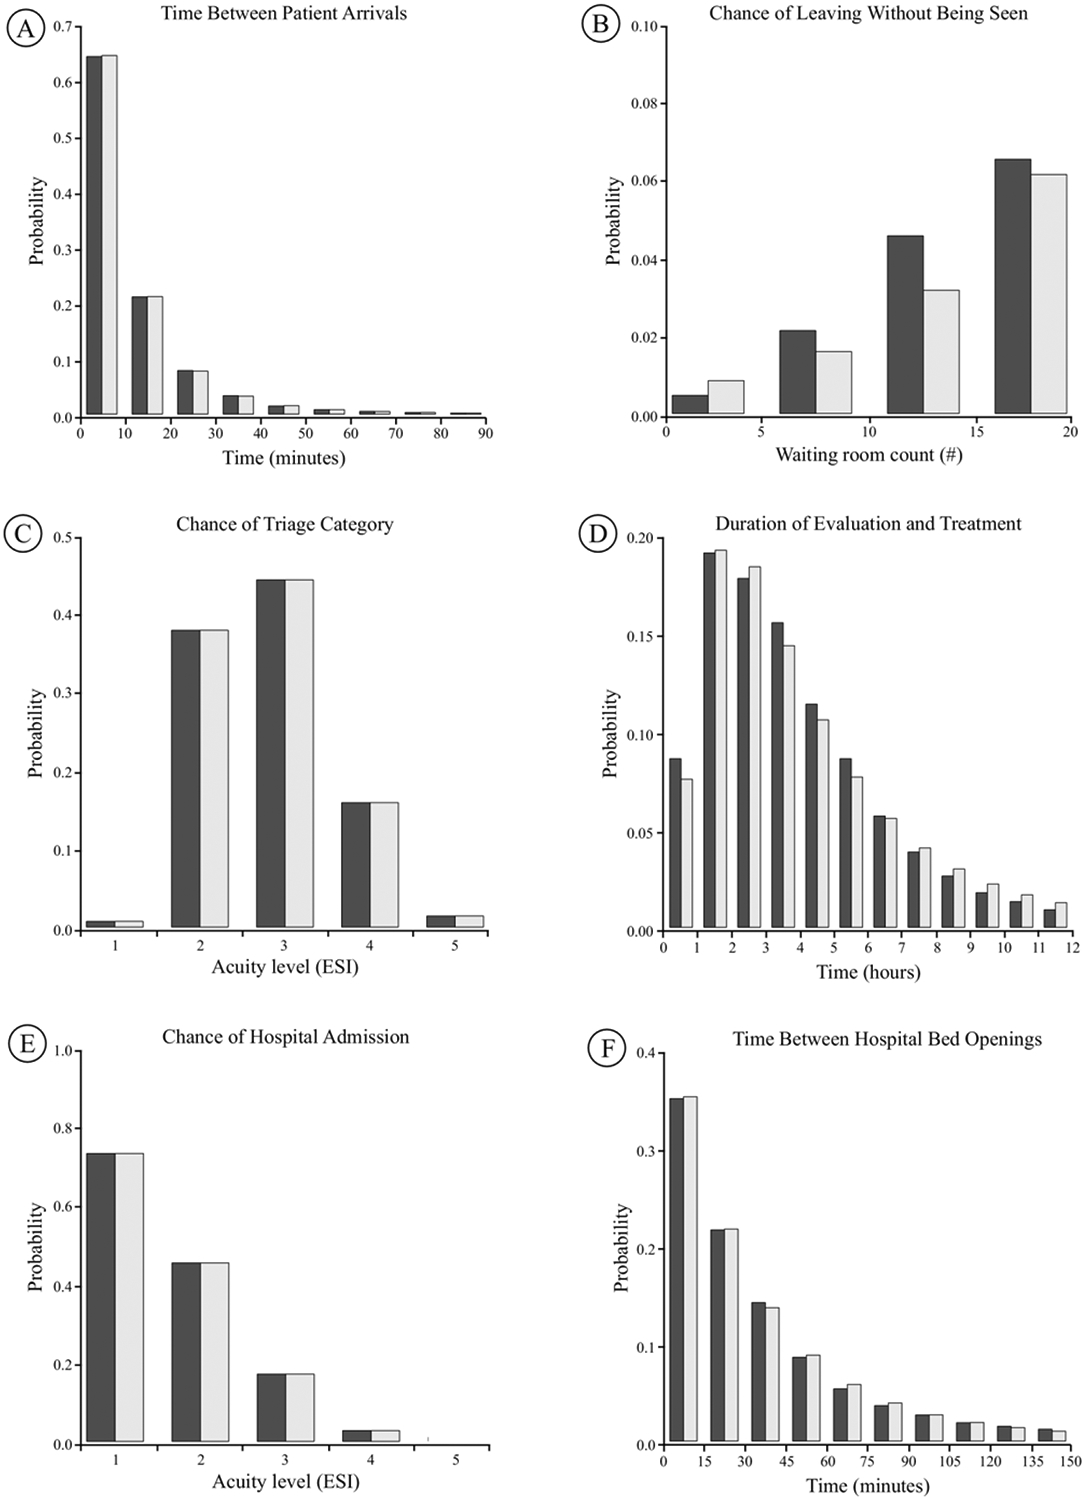
Observed (dark shading) and theoretical (light shading) distributions of the random processes in ForecastED. A, Time between patient arrivals, B, probability of leaving without being seen as a function of the waiting room count, C, probability of being assigned to each triage category, D, duration of ED evaluation and treatment, E, probability of hospital admission as a function of the acuity level, and F, time between hospital bed openings. All acuity levels are described according to the Emergency Severity Index (ESI).
The reliability of the simulation forecast for each continuous outcome measure is presented in Table 1. The simulation forecasts showed equal or greater reliability for predicting future operating conditions than the autocorrelation inherent in each reference standard across all forecasting lengths. The reliability decreased as the length of the forecasting window increased. For example, the simulation forecasts of the waiting room count had correlation coefficients of 0.79, 0.70, 0.62, and 0.56, respectively, with the actual waiting room count at 2, 4, 6, and 8 hours in the future. Moreover, the difference in reliability between the simulation forecasts and the inherent autocorrelation increased as the forecasting window increased. For example, the simulation forecasts of occupancy level had correlation coefficients of 0.91, 0.85, 0.81, and 0.78, respectively, with the actual occupancy level at 2, 4, 6, and 8 hours in the future. By contrast, the autocorrelation of the occupancy level was 0.84, 0.61, 0.35, and 0.15 at lags of 2, 4, 6, and 8 hours.
Table 1.
Reliability of the simulation versus autocorrelation in forecasting operational data.*
| 2 h Ahead | 4 h Ahead | 6 h Ahead | 8 h Ahead | |
|---|---|---|---|---|
| Waiting count | ||||
| Simulation | 0.79 (0.79–0.80) | 0.70 (0.69–0.70) | 0.62 (0.61–0.62) | 0.56 (0.55–0.57) |
| Autocorrelation | 0.76 (0.75–0.76) | 0.52 (0.51–0.52) | 0.26 (0.25–0.27) | 0.04 (0.03–0.05) |
| Waiting time | ||||
| Simulation | 0.74 (0.73–0.75) | 0.66 (0.65–0.67) | 0.57 (0.56–0.58) | 0.49 (0.48–0.50) |
| Autocorrelation | 0.64 (0.63–0.65) | 0.44 (0.43–0.45) | 0.28 (0.27–0.29) | 0.15 (0.14–0.16) |
| Occupancy level | ||||
| Simulation | 0.91 (0.91–0.91) | 0.85 (0.85–0.85) | 0.81 (0.81–0.81) | 0.78 (0.77–0.78) |
| Autocorrelation | 0.84 (0.83–0.84) | 0.61 (0.60–0.61) | 0.35 (0.35–0.36) | 0.15 (0.13–0.15) |
| Length of stay | ||||
| Simulation | 0.96 (0.95–0.96) | 0.92 (0.92–0.92) | 0.89 (0.89–0.89) | 0.86 (0.86–0.86) |
| Autocorrelation | 0.94 (0.94–0.94) | 0.85 (0.85–0.86) | 0.76 (0.76–0.77) | 0.68 (0.67–0.68) |
| Boarding count | ||||
| Simulation | 0.94 (0.94–0.94) | 0.89 (0.89–0.89) | 0.84 (0.83–0.84) | 0.79 (0.79–0.80) |
| Autocorrelation | 0.94 (0.93–0.94) | 0.88 (0.88–0.88) | 0.82 (0.82–0.83) | 0.77 (0.76–0.77) |
| Boarding time | ||||
| Simulation | 0.88 (0.88–0.88) | 0.84 (0.84–0.85) | 0.82 (0.81–0.82) | 0.80 (0.80–0.80) |
| Autocorrelation | 0.87 (0.87–0.88) | 0.78 (0.77–0.78) | 0.68 (0.67–0.68) | 0.59 (0.58–0.59) |
The Pearson’s r coefficient of correlation is presented with lower and upper bounds of the 95% CIs in parentheses.
The calibration of the simulation forecast for each continuous outcome measure is presented in Table 2. The model showed good calibration, as defined by the residual mean having small magnitude in proportion to the standard deviation, for all outcome measures except the boarding time. The model consistently underestimated the average hours of boarding time at 2, 4, 6, and 8 hours in the future, respectively, by −6.1±2.5, −6.8±2.9, −7.1±3.2, and −7.3±3.4, indicating a systematic bias for this outcome measure.
Table 2.
Calibration of the simulation in forecasting operational data.*
| 2 h Ahead | 4 h Ahead | 6 h Ahead | 8 h Ahead | |
|---|---|---|---|---|
| Waiting count, # of patients | −0.6±3.6 | −0.1±4.7 | 0.3±5.3 | 0.5±5.7 |
| Waiting time, h | −0.1±0.5 | 0.0±0.7 | 0.2±0.9 | 0.3±1.0 |
| Occupancy level, % of beds | 0.9±9.0 | 1.0±11.3 | 1.3±12.6 | 1.6±13.5 |
| Length of stay, h | −0.8±1.0 | −0.9±1.3 | −1.0±1.5 | −0.9±1.7 |
| Boarding count, # of patients | −0.4±2.4 | −0.7±3.1 | −0.9±3.7 | −1.1±4.2 |
| Boarding time, h | −6.1±2.5 | −6.8±2.9 | −7.1±3.2 | −7.3±3.4 |
The forecasting residuals are summarized with the mean ± standard deviation.
The receiver operating characteristic curves for discriminating ambulance diversion in the future are presented in Figure 5. The area under the receiver operating characteristic curve at 2, 4, 6, and 8 hours in the future, respectively, was 0.88 (95% CI 0.88 to 0.88), 0.88 (95% CI 0.88 to 0.89), 0.88 (95% CI 0.88 to 0.88), and 0.86 (95% CI 0.86 to 0.87), indicating high discriminatory power.
Figure 5.
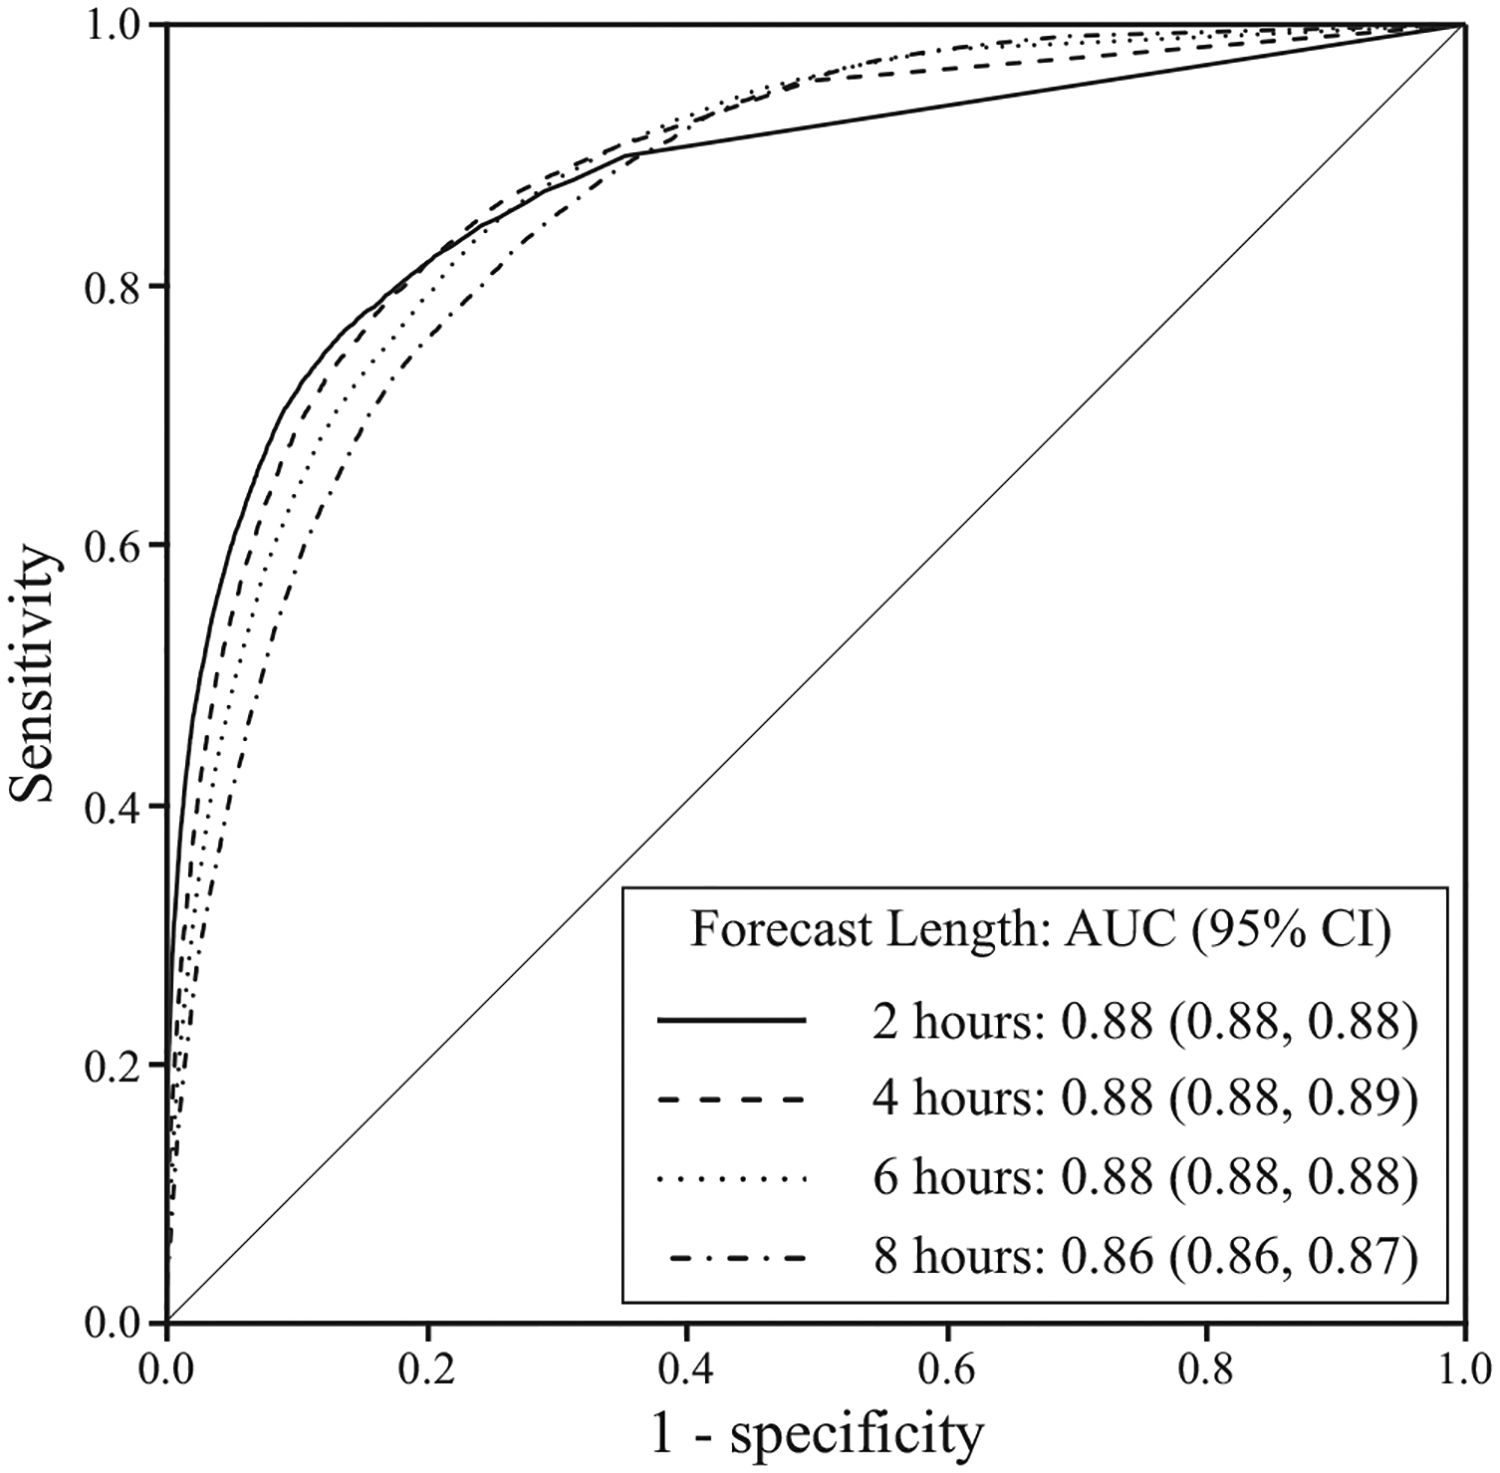
Receiver operating characteristic curves of the simulation forecast of ambulance diversion at various points in the future. The area under the receiver operating characteristic curve with 95% CI is shown in parentheses.
Each group of 1,000 simulation replications took 0.55 seconds to execute with a 1.83 GHz Intel Core Duo processor. In other words, the simulation ran approximately 130 million times faster than real time.
LIMITATIONS
One potential limitation of this study is the narrow purpose for which the ForecastED simulation was intended. We developed and validated it for the sole purpose of forecasting near-future operational measures in the ED. We intentionally kept the purpose narrow because an effort to create an all-purpose simulation of ED patient flow might have compromised one or more of our design goals. Its use for other common applications of simulation, such as evaluating long-term effects of proposed organizational changes, may not be warranted.
A number of objections may be made about aspects of ED patient flow that the ForecastED simulation did not model. We assumed the times required for triaging patients and for cleaning treatment areas to be negligible. We did not include a mechanism for patient death in the ED. We excluded institution-specific care processes, including fast-track beds and designated psychiatric areas. Different aspects of ED evaluation and treatment, such as radiologic examinations and pending consultations, were grouped into a single process representing their total duration. We counter these objections by noting that “all models are wrong, but some are useful.”60 The validation results demonstrate that, despite its relatively simple design, our model provides accurate forecasts.
We conducted a single-center validation, so the findings do not allow for comment on how well the ForecastED simulation would generalize to other institutions. However, the simulation design includes only processes that would likely apply to diverse EDs, including large academic centers and small community based centers. We emphasized the use of patient-level data that are increasingly becoming available by using ED information systems. Also, the probability distributions that govern the simulation may be continuously reestimated with site-specific historical patient data, adjusting for differences in volume or demographics between institutions. To recalibrate at another institution, one would need (1) a file containing at least 4 weeks of data, with 6 patient-level variables described in the “Data Collection and Processing” section, and (2) a computer script that automatically calculates the simulation parameters by using maximum likelihood estimation.
Our study design allowed the model accuracy to be measured, but the question of how timely interventions based on the forecasts would affect patient care remains unanswered. Knowledge of the future alone cannot solve the crowding problem; action based on this knowledge is required. This is intended application of the simulation, and further research will be necessary to determine whether the ForecastED simulation can alleviate the negative effects of crowding.
DISCUSSION
We have designed and implemented ForecastED, a discrete event simulation that uses patient flow to predict near-future ED operational measures. The findings indicate that the distributions used to represent the model’s random processes closely fit the observed data. The simulation forecasts correlated well with the actual operational measures at 2, 4, 6, and 8 hours in the future. This correlation equaled or exceeded the inherent autocorrelation of the data across all outcome measures and forecast lengths. The simulation forecasts showed good calibration for all the outcome measures except the boarding time, which was systematically biased. The findings also demonstrate that the simulation may be used to forecast the probability of ambulance diversion status, and these forecasts showed high discriminatory power up to 8 hours into the future.
The forecasts of boarding time were systematically biased, perhaps with the following explanation: When hospital bed openings occur, the simulation allocates each bed to the patient who has been boarding the longest. In an actual ED, the hospital bed allocation may occur differently, considering specific hospital services to which patients might be admitted. Individual boarding times are likely to be skewed to the right, so the simulation repeatedly removes outliers that strongly influence the average. This may be considered a limitation of the model, although the bias may be reduced in 2 ways without requiring changes to the simulation design: (1) calibrate the boarding time by adding a constant to each forecast, or (2) use the median to summarize individual boarding times instead of the mean, compensating for the skewed distribution.
Although many outcome measures beyond those used for validation are possible, the selected measures of ED crowding represent 2 input, 2 throughput, and 2 output measures corresponding to a conceptual model of crowding.45 The simulation may also be applied to forecast the probability of crowding as a binary state. It is agnostic to what specific definition of crowding is applied; the only restriction is that crowding must be defined in terms of objective, patient data. This differs from a standard regression model, in which the model would depend on a specific definition of crowding. The flexible capability of the ForecastED system may represent an inherent strength of the simulation approach.
Because the ForecastED simulation describes the state of the ED in terms of the patients present, any crowding measure that can be expressed by patient-level data may theoretically be forecast with the model. We calculated that the level of detail reflected in the ForecastED simulation should be sufficient to forecast near-future values of many of the measures described by a consensus of experts,61 as well as the Emergency Department Work Index, the National Emergency Department Overcrowding Scale, the Work Score, the Emergency Department Crowding Scale, and the Real-Time Analysis of Demand Indicators.19–23 This flexibility implies that ForecastED can distinguish between specific sources of near-future crowding. For example, a high waiting count forecast would warn of crowding caused by a rapid surge in patient arrivals. Conversely, a high boarding count forecast would warn of crowding caused by hospital issues. This capability may allow providers to tailor their responses to different types of ED crowding.
The simplicity of the ForecastED simulation provides several practical advantages: First, the simulation contains no ad hoc parameters. All the distributions that govern the simulation processes may be estimated directly from patient data at any given institution. Second, only 6 per-patient variables are required for the simulation. Many EDs may already have the necessary data for the real-time deployment of our system. Third, we implemented the simulation with the platform independent C programming language, which may benefit execution speed and portability between institutions. The ForecastED system is not intended as an offline tool for change management; rather, it is intended as a real-time forecasting tool to reflect the dynamic state of ED operations.
In summary, we have developed and validated the ForecastED simulation, which may be used to forecast the values of various ED crowding measurements at points in the near future. An old management adage notes that “you cannot manage what you cannot measure,” and the approach manifest by the ForecastED simulation may represent a step toward empowering EDs to proactively manage the problem of crowding.
Editor’s Capsule Summary.
What is already known on this topic
Emergency department (ED) census and workload can be highly variable. Accurate prediction of short-term future workload might improve efficiency if staffing could be tailored to the impending load.
What question this study addressed
Can readily available historical information be modeled to predict near-term ED operating conditions?
What this study adds to our knowledge
At this single site, the correlation between forecasted and actual operating conditions (waiting count, waiting time, occupancy level, length of stay, boarding count, boarding time, and ambulance diversion) was reasonably good. Accuracy decreased as the prediction time increased from 2 to 8 hours into the future.
How this might change clinical practice
This study will not change clinical practice until it is demonstrated that this type of modeling can be used to improve the efficiency of care.
Funding and support:
By Annals policy, all authors are required to disclose any and all commercial, financial, and other relationships in any way related to the subject of this article, that may create any potential conflict of interest. See the Manuscript Submission Agreement in this issue for examples of specific conflicts covered by this statement. Dr. Hoot was supported by the National Library of Medicine grant LM07450-02 and National Institute of General Medical Studies grant T32 GM07347. The research was also supported by the National Library of Medicine grant R21 LM009002-01. This project is an academic endeavor. It was supported by federal funding, as noted above, and there was no corporate funding. There are no current plans to commercialize this research that would cause any conflicts of interest.
Footnotes
Reprints not available from the authors.
REFERENCES
- 1.Committee on the Future of Emergency Care in the United States Health System. Hospital-based Emergency Care: At the Breaking Point. Washington, DC: National Academies Press; 2006. [Google Scholar]
- 2.Kellermann AL. Crisis in the emergency department. N Engl J Med. 2006;355:1300–1303. [DOI] [PubMed] [Google Scholar]
- 3.Miro O, Antonio MT, Jimenez S, et al. Decreased health care quality associated with emergency department overcrowding. Eur J Emerg Med. 1999;6:105–107. [DOI] [PubMed] [Google Scholar]
- 4.Begley CE, Chang Y, Wood RC, et al. Emergency department diversion and trauma mortality: evidence from Houston, Texas. J Trauma. 2004;57):1260–1265. [DOI] [PubMed] [Google Scholar]
- 5.Hwang U, Richardson LD, Sonuyi TO, et al. The effect of emergency department crowding on the management of pain in older adults with hip fracture. J Am Geriatr Soc. 2006;54:270–275. [DOI] [PubMed] [Google Scholar]
- 6.Sprivulis PC, Da Silva JA, Jacobs IG, et al. The association between hospital overcrowding and mortality among patients admitted via Western Australian emergency departments. Med J Aust. 2006;184:208–212. [DOI] [PubMed] [Google Scholar]
- 7.Richardson DB. Increase in patient mortality at 10 days associated with emergency department overcrowding. Med J Aust. 2006;184:213–216. [DOI] [PubMed] [Google Scholar]
- 8.Baker DW, Stevens CD, Brook RH. Patients who leave a public hospital emergency department without being seen by a physician. Causes and consequences. JAMA. 1991;266:1085–1090. [PubMed] [Google Scholar]
- 9.Schull MJ, Morrison LJ, Vermeulen M, et al. Emergency department overcrowding and ambulance transport delays for patients with chest pain. CMAJ. 2003;168:277–283. [PMC free article] [PubMed] [Google Scholar]
- 10.Liu S, Hobgood C, Brice JH. Impact of critical bed status on emergency department patient flow and overcrowding. Acad Emerg Med. 2003;10:382–385. [DOI] [PubMed] [Google Scholar]
- 11.Schull MJ, Morrison LJ, Vermeulen M, et al. Emergency department gridlock and out-of-hospital delays for cardiac patients. Acad Emerg Med. 2003;10:709–716. [DOI] [PubMed] [Google Scholar]
- 12.Eckstein M, Chan LS. The effect of emergency department crowding on paramedic ambulance availability. Ann Emerg Med. 2004;43:100–105. [DOI] [PubMed] [Google Scholar]
- 13.Schull MJ, Vermeulen M, Slaughter G, et al. Emergency department crowding and thrombolysis delays in acute myocardial infarction. Ann Emerg Med. 2004;44:577–585. [DOI] [PubMed] [Google Scholar]
- 14.Polevoi SK, Quinn JV, Kramer NR. Factors associated with patients who leave without being seen. Acad Emerg Med. 2005; 12:232–236. [DOI] [PubMed] [Google Scholar]
- 15.Rowe BH, Channan P, Bullard M, et al. Characteristics of patients who leave emergency departments without being seen. Acad Emerg Med. 2006;13:848–852. [DOI] [PubMed] [Google Scholar]
- 16.Krochmal P, Riley TA. Increased health care costs associated with ED overcrowding. Am J Emerg Med. 1994;12:265–266. [DOI] [PubMed] [Google Scholar]
- 17.Bayley MD, Schwartz JS, Shofer FS, et al. The financial burden of emergency department congestion and hospital crowding for chest pain patients awaiting admission. Ann Emerg Med. 2005; 45:110–117. [DOI] [PubMed] [Google Scholar]
- 18.Falvo T, Grove L, Stachura R, et al. The financial impact of ambulance diversions and patient elopements. Acad Emerg Med. 2007;14:58–62. [DOI] [PubMed] [Google Scholar]
- 19.Bernstein SL, Verghese V, Leung W, et al. Development and validation of a new index to measure emergency department crowding. Acad Emerg Med. 2003;10:938–942. [DOI] [PubMed] [Google Scholar]
- 20.Reeder TJ, Burleson DL, Garrison HG. The overcrowded emergency department: a comparison of staff perceptions. Acad Emerg Med. 2003;10:1059–1064. [DOI] [PubMed] [Google Scholar]
- 21.Weiss SJ, Derlet R, Arndahl J, et al. Estimating the degree of emergency department overcrowding in academic medical centers: results from the National ED Overcrowding Study (NEDOCS). Acad Emerg Med. 2004;11:38–50. [DOI] [PubMed] [Google Scholar]
- 22.Asplin BR, Rhodes KV, Flottemesch TJ, et al. Is this emergency department crowded? A multicenter derivation and evaluation of an emergency department crowding scale (EDCS) abstract. Acad Emerg Med 2004;11:484–485. [Google Scholar]
- 23.Epstein SK, Tian L. Development of an emergency department work score to predict ambulance diversion. Acad Emerg Med. 2006;13:421–426. [DOI] [PubMed] [Google Scholar]
- 24.Asplin BR. Measuring crowding: time for a paradigm shift. Acad Emerg Med. 2006;13:459–461. [DOI] [PubMed] [Google Scholar]
- 25.Jones SA, Joy MP, Pearson J. Forecasting demand of emergency care. Health Care Manag Sci. 2002;5:297–305. [DOI] [PubMed] [Google Scholar]
- 26.Hoot NR, Aronsky D. An early warning system for overcrowding in the emergency department. Proc AMIA Annu Fall Symp. 2006: 339–343. [PMC free article] [PubMed] [Google Scholar]
- 27.Asplin BR, Flottemesch TJ, Gordon BD. Developing models for patient flow and daily surge capacity research. Acad Emerg Med. 2006;13:1109–1113. [DOI] [PubMed] [Google Scholar]
- 28.Champion R, Kinsman LD, Lee GA, et al. Forecasting emergency department presentations. Aust Health Rev. 2007;31:83–90. [DOI] [PubMed] [Google Scholar]
- 29.Hoot NR, Zhou C, Jones I, et al. Measuring and forecasting emergency department crowding in real time. Ann Emerg Med. 2007;49:747–755. [DOI] [PMC free article] [PubMed] [Google Scholar]
- 30.Flottemesch TJ, Gordon BD, Jones SS. Advanced statistics: developing a formal model of emergency department census and defining operational efficiency. Acad Emerg Med. 2007;14:799–809. [DOI] [PubMed] [Google Scholar]
- 31.Kelen GD, Scheulen JJ, Hill PM. Effect of an emergency department managed acute care unit on ED overcrowding and emergency medical services diversion. Acad Emerg Med. 2001;8: 1095–1100. [DOI] [PubMed] [Google Scholar]
- 32.Washington DL, Stevens CD, Shekelle PG, et al. Next-day care for emergency department users with nonacute conditions. A randomized, controlled trial. Ann Intern Med. 2002;137:707–714. [DOI] [PubMed] [Google Scholar]
- 33.Bucheli B, Martina B. Reduced length of stay in medical emergency department patients: a prospective controlled study on emergency physician staffing. Eur J Emerg Med. 2004;11:29–34. [DOI] [PubMed] [Google Scholar]
- 34.Forster AJ. An agenda for reducing emergency department crowding. Ann Emerg Med. 2005;45:479–481. [DOI] [PubMed] [Google Scholar]
- 35.Sprivulis P, Gerrard B. Internet-accessible emergency department workload information reduces ambulance diversion. Prehosp Emerg Care. 2005;9:285–291. [DOI] [PubMed] [Google Scholar]
- 36.Saunders CE, Makens PK, LeBlanc LJ. Modeling emergency department operations using advanced computer simulation systems. Ann Emerg Med. 1989;18:134–140. [DOI] [PubMed] [Google Scholar]
- 37.White CR, Best JB, Sage CK. Simulation of emergency medical service scheduling. Hosp Top. 1992;70:34–37. [DOI] [PubMed] [Google Scholar]
- 38.Kilmer RA, Smith AE, Shuman LJ. An emergency department simulation and a neural network metamodel. J Soc Health Syst. 1997;5:63–79. [PubMed] [Google Scholar]
- 39.McGuire F. Using simulation to reduce length of stay in emergency departments. J Soc Health Syst. 1997;5:81–90. [PubMed] [Google Scholar]
- 40.Huddy J, McKay J, Culp K. Computer simulation: making better operational and architectural ED design decisions. J Emerg Nurs. 1999;25:307–310. [DOI] [PubMed] [Google Scholar]
- 41.Edmonds MI, O’Connor HM. The use of computer simulation as a strategic decision-making tool: a case study of an emergency department application. Healthc Manage Forum. 1999;12:32–38. [DOI] [PubMed] [Google Scholar]
- 42.Coats TJ, Michalis S. Mathematical modelling of patient flow through an accident and emergency department. Emerg Med J. 2001;18:190–192. [DOI] [PMC free article] [PubMed] [Google Scholar]
- 43.Connelly LG, Bair AE. Discrete event simulation of emergency department activity: a platform for system-level operations research. Acad Emerg Med. 2004;11:1177–1185. [DOI] [PubMed] [Google Scholar]
- 44.Hung GR, Whitehouse SR, O’Neill C, et al. Computer modeling of patient flow in a pediatric emergency department using discrete event simulation. Pediatr Emerg Care. 2007;23:5–10. [DOI] [PubMed] [Google Scholar]
- 45.Asplin BR, Magid DJ, Rhodes KV, et al. A conceptual model of emergency department crowding. Ann Emerg Med. 2003;42:173–180. [DOI] [PubMed] [Google Scholar]
- 46.Downing A, Wilson R. Temporal and demographic variations in attendance at accident and emergency departments. Emerg Med J. 2002;19:531–535. [DOI] [PMC free article] [PubMed] [Google Scholar]
- 47.Law AM, Kelton WD. Simulation Modeling and Analysis. New York, NY: McGraw-Hill; 1982. [Google Scholar]
- 48.Harrod S, Kelton WD. Numerical methods for realizing nonstationary Poisson processes with piecewise-constant instantaneous-rate functions. Simulation. 2006;82:147–157. [Google Scholar]
- 49.Kyriacou DN, Ricketts V, Dyne PL, et al. A 5-year time study analysis of emergency department patient care efficiency. Ann Emerg Med. 1999;34:326–335. [DOI] [PubMed] [Google Scholar]
- 50.Hosmer DW, Lemeshow S. Applied Logistic Regression. New York, NY: John Wiley & Sons; 1989. [Google Scholar]
- 51.Wuerz RC, Milne LW, Eitel DR, et al. Reliability and validity of a new five-level triage instrument. Acad Emerg Med. 2000;7:236–242. [DOI] [PubMed] [Google Scholar]
- 52.Beveridge R, Ducharme J, Janes L, et al. Reliability of the Canadian emergency department triage and acuity scale: interrater agreement. Ann Emerg Med. 1999;34:155–159. [DOI] [PubMed] [Google Scholar]
- 53.Australasian College for Emergency Medicine. Policy Document—The Australasian Triage Scale. Melbourne, Australia: ACEM; 2000. [Google Scholar]
- 54.Fatovich DM, Nagree Y, Sprivulis P. Access block causes emergency department overcrowding and ambulance diversion in Perth, Western Australia. Emerg Med J. 2005;22:351–354. [DOI] [PMC free article] [PubMed] [Google Scholar]
- 55.Schull MJ, Lazier K, Vermeulen M, et al. Emergency department contributors to ambulance diversion: a quantitative analysis. Ann Emerg Med. 2003;41:467–476. [DOI] [PubMed] [Google Scholar]
- 56.Matsumoto M, Nishimura T. Mersenne twister: A 623-dimensionally equidistributed uniform pseudorandom number generator. ACM Trans Mod Comp Sim. 1998;8:3–30. [Google Scholar]
- 57.Efron B, Tibshirani R. Bootstrap methods for standard errors, confidence intervals, and other measures of statistical accuracy. Stat Sci. 1986;1:54–77. [Google Scholar]
- 58.Bland JM, Altman DG. Statistical methods for assessing agreement between two methods of clinical measurement. Lancet. 1986;1:307–310. [PubMed] [Google Scholar]
- 59.Hanley JA, McNeil BJ. The meaning and use of the area under a receiver operating characteristic (ROC) curve. Radiology. 1982; 143:29–36. [DOI] [PubMed] [Google Scholar]
- 60.Box GEP. Science and statistics. J Am Stat Assoc. 1976;71:791–799. [Google Scholar]
- 61.Solberg LI, Asplin BR, Weinick RM, et al. Emergency department crowding: consensus development of potential measures. Ann Emerg Med. 2003;42:824–834. [DOI] [PubMed] [Google Scholar]