Summary Paragraph
A mosaic of cross-phylum chemical interactions occurs between all metazoans and their microbiomes. A number of molecular families known to be produced by the microbiome have a profound impact on the balance between health and disease1-9. Considering the diversity of the human microbiome, numbering over 40,000 operational taxonomic units10, the impact of the microbiome on the chemistry of an entire animal remains underexplored. In this study, mass spectrometry informatics and data visualization approaches11-13 were used to provide an assessment of the impacts of the microbiome on the chemistry of an entire mammal by comparing metabolomics data from germ-free (GF) and specific pathogen free (SPF) mice. We found that the microbiota affected the chemistry of all organs. This included amino acid conjugations of host bile acids that have evaded characterization despite the extensive research on bile acid chemistry14. These bile acid conjugates were also found in humans, where they were enriched in states of disease. These compounds agonized the farnesoid X receptor (FXR) in vitro and a gavage of mice resulted in reduced expression of bile acid synthesis genes in vivo. Further studies are required to confirm that these compounds have a physiological role in the host and whether they contribute to gut diseases associated with microbiome dysbiosis.
Main
Metabolomics of GF and SPF mice.
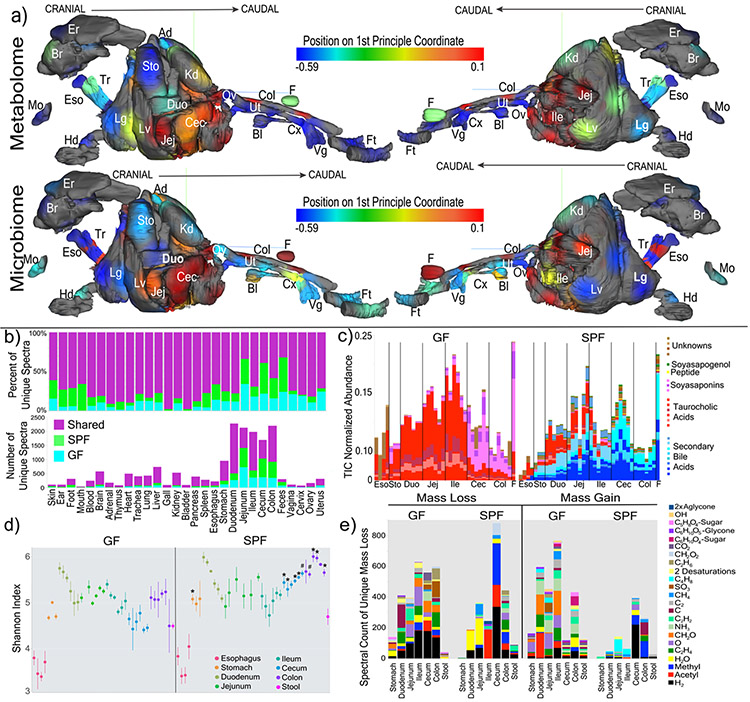
In total, 768 samples from 96 sample sites of 29 different organs were analyzed from four GF and four colonized mice by LC-MS/MS mass spectrometry and 16S rRNA gene sequencing (Table S1). Mapping the 1st principal coordinate position of each sample from SPF mice onto a 3D mouse model13 enabled visualization of the similarity of the microbiome and metabolome through all organs and organ systems (Fig. 1a and b, 3D-model available in supplementary data). Different sections through the GI tract had unique microbiome and metabolome profiles. There was a distinct difference between the similarity of the two data types in murine fecal samples. The metabolome differed between fecal samples and the distal gastrointestinal (GI) tract, whereas the microbiome was more similar between feces and colon/cecum samples.
Figure 1. Global impacts of the microbiome on the chemistry of an entire mammal.
a) 3-D model of murine organs mapped with the mean 1st principle coordinate as a heatmap according to the color scale (from Extended data Fig. 1) from the GF and SPF mice (n=4). (Er=ear, Br=brain, Ad=adrenal gland, Es=esophagus, Tr=trachea, Sto=stomach, Kd=kidney, Mo=mouth, Duo=duodenum, Ov=ovary, Col=colon, F=feces, Hd=hand, Lg=lung, Lv=liver, Jej=jejunum, Cec=cecum, Bl-bladder, Ut=uterus, Cx=cervix, Vg=vagina, Ft=feet). b) Mean percent and total number of unique spectra in each organ sampled from the two mouse groups. c) Relative abundance (to total ion current (TIC)) of the 30 most differential metabolites between GF and SPF murine guts. The metabolites are colored as secondary bile acids (blue), primary bile acids (red), soyasaponins (pink), peptides (yellow) and unknowns (brown). Annotations are based on spectral matching or molecular network propagation (level two or three3). It must be noted that stereochemistry of the annotated molecules cannot be discerned using these methods. d) Mean and 95% confidence interval of the Shannon-Weiner diversity of the metabolomic data in each GI tract sample for GF and SPF mice. Statistical significance between metabolome diversity in the same sample location between GF and SPF mice was tested with the Mann-Whitney U-test (n=4, two-sided, *=p=0.028, #=p=0.057). e) Results of meta-mass shift chemical profiling17 showing the spectral counts of known mass differences between unique nodes in either GF or SPF mice. Each mass difference corresponds to the node-to-node gain or loss of a particular chemical group.
To characterize the chemical impact of the microbiome, the mass spectrometry data was subjected to molecular networking12. The algorithm identified 7,913 spectra of which 14.7+/−2.2% were observed in colonized mice and 10.0+/−0.7% were exclusive to GF (Fig. 1b, Extended Data Fig. 1). Although the overall profiles showed the strongest differences between GF and SPF were in the GI tract, molecular networking identified unique chemical signatures from the microbiome in all organs, ranging from 2% in the bladder to 44% in stool (Fig. 1b). The metabolome of the cecum, the main site of microbial fermentation of food, was most profoundly affected by the microbiota. Spectral library searching enabled annotation of 8.9% of nodes in the molecular network11,15 (level two or three according to16). Many of the changes attributed to the microbiome were location specific, resulting from the metabolism of plant natural products from food and bile acids (Fig. 1c, Extended data Fig. 2, 3, 4, supplemental Data,). The Shannon diversity of the GF and SPF mouse metabolome was mirrored in the upper GI tract, both being low in the esophagus and higher in the stomach and duodenum. Upon transition to the cecum, however, the diversity of the two groups of mice began to separate (Fig. 1d). The molecular diversity in the cecum and colon of colonized mice was higher than that of GF mice, but not in the stool samples (Fig. 1d). In the duodenum, the location where the gallbladder adds bile to the intestine, there was a contrast in microbiome and metabolome diversity, where a high metabolome diversity corresponded to a low microbial diversity.
Molecular networking enabled meta-mass shift chemical profiling17 of the GF and SPF GI tracts, which is an analysis of chemical transformations based on parent mass shifts between related spectra without the requirement of knowing the molecular structures. In colonized animals, there was a signature for water loss in the duodenum and jejunum and the loss of H2, acetyl and methyl groups in latter parts of the GI tract (Fig. 1e). Of all the H2 shifts, 23.1% were associated with bile acids, indicating that colonization resulted in oxidation of bile acids, a known microbial transformation18. Deacetylations were also prevalent in colonized animals, though the metabolites upon which this was occurring remain unidentified. GF mice had mass gains corresponding to saccharides in all regions of the GI tract (Fig. 1e), which were primarily associated with plant natural products (e.g. soyasaponins and flavonoids). The absence of these sugars in SPF mice implicates the microbiome in their metabolism (Extended data Fig. 2, 3). A unique mass gain of C4H8 was detected in the jejunum and ileum of SPF mice (Fig. 1e) and 18.2% of spectra with this mass gain were derived from an unknown molecule related to the conjugated bile acid glycocholic acid (GCA) (Fig. 2a). Overall, both GF and SPF mice had frequent and diverse mass losses between related molecules, but there were fewer molecules in colonized mice that gained a molecular group (Fig. 1e). This indicates that the microbiome contributed more to the catabolic breakdown of molecules and less to anabolism. However, we found the addition of C4H8 to GCA to be a particularly interesting anabolic reaction that was dependent on the gut microbiome, and we sought to investigate this further.
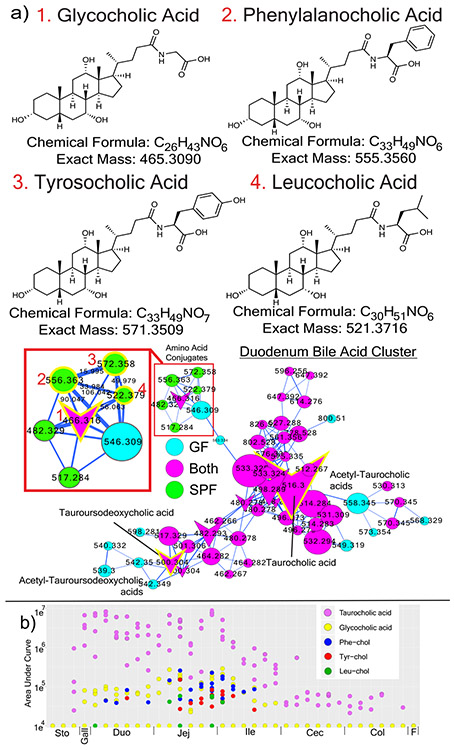
Figure 2. Novel microbial bile acid conjugates.
a) Structures and molecular networks of novel microbiome conjugated bile acids with the host-conjugated GCA shown for comparison. The molecular network is colored by mapping to either GF or SPF mice according to the color legend with an inset highlighting the parent masses and mass differences between the newly discovered molecules and GCA. Each node represents a clustered MS/MS spectrum and connections between the nodes indicate relationships through the cosine score with their width scaled by the cosine size (cutoff minimum 0.7). Circular nodes are unknowns and arrowheads are spectra with matches in the GNPS libraries. b) Dot plot of the area under curve abundance of the novel and host synthesized bile acid conjugates in each SPF mouse (n=4) through the murine GI tract and its subsections.
Discovery of new conjugated bile acids.
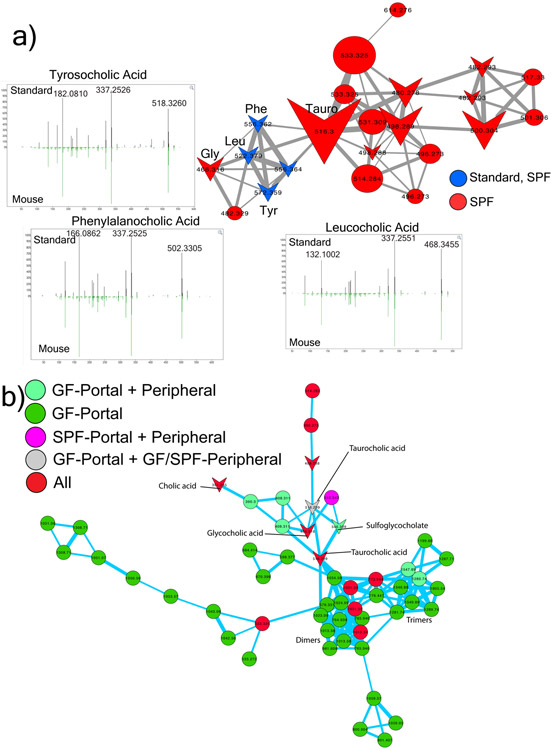
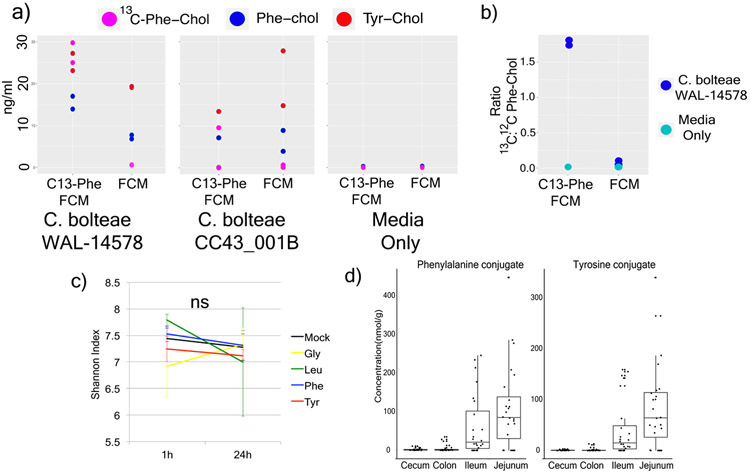
Glycine and taurine conjugated bile acids were detected in both GF and SPF mice. The glycine and taurine amino acids were removed as they passed through the GI tract in SPF mice only, which is a known microbial transformation19 (Fig. 1b, Extended data Fig. 4). The conjugated bile acid molecular network had several modified forms of these compounds that were only present in colonized animals, including the C4H8 addition described above that was related to the MS/MS of GCA (Fig. 2a). Analysis of the MS/MS spectra of three of these SPF nodes (m/z 556.363, 572.358 and 522.379) showed maintenance of the core cholic acid, but with a fragmentation pattern characteristic of the presence of the amino acids phenylalanine, tyrosine and leucine through an amide bond at the conjugation site in place of glycine or taurine (Extended data Fig. 5, Table S2). This represents a set of unique amino acid amide conjugations to cholic acid that are mediated by the microbiome creating the novel bile acids phenylalanocholic acid (Phe-chol), tyrosocholic acid (Tyr-chol) and leucocholic acid (Leu-chol). These structures were validated with synthesized standards by retention time and MS/MS matching on several instrument platforms including targeted MS (level one matches16, Extended data Fig. 5,6, Table S2, S5). These molecules were detected in the duodenum, jejunum and ileum of SPF mice only, with 10-fold lower levels found in the cecum and colon after targeted mass spectrometry analysis using isotopically labeled internal standards (Table S4). The liver-synthesized glycine and taurine conjugates were found in these same gut locations, but also observed in the gall bladder and liver (Fig. 2b, Extended Data Fig. 6). Phe-chol was the most abundant microbial conjugate on average across the GI tract, present at 147.0 nmol/g tissue (SD+/−99.9) in the jejunum, 83.6 nmol/g tissue (SD+/−81.3) in the ileum, 4.7 nmol/g tissue (SD+/−3.4) in the cecum and 11.6 nmol/g tissue (SD+/−12.2) in the colon; with its highest concentration at 447.2 nmol/g tissue in a single jejunum sample (LOD in table S4, S6, S7).
The decreased abundance of these unique bile conjugates in the lower GI tract prompted us to investigate if there was reabsorption in the ileum or further metabolism by the microbiota. Portal and peripheral blood was collected from additional SPF (n=4) and GF (n=6) mice and screened for the presence of conjugated bile acids. Taurocholic acid (TCA) and GCA were both present in portal and peripheral blood of colonized and sterile mice, but the new amino acid amide conjugates were not detected (Extended data Fig. 6). Furthermore, incubation of these molecules with an actively growing human fecal batch culture showed that the Tyr-, Phe- and Leu- bile acids were not deconjugated by the microbiota, even when deconjugation readily occurred on the host synthesized GCA control, a well-known bile acid amidate hydrolase activity mediated by human microbiota20 (Extended Data Fig. 6). However, an oxidation of the cholate core occurred on all three novel conjugates, indicating that they could be modified by microbial enzymes, even when no concurrent oxidation of GCA was observed (Extended Data Fig. 6).
In the extensive bile acid literature, comprising greater than 42,000 publication records in PubMed21-27, descriptions of unusual conjugations of bile acids are rare. Through 170 years of bile acid chemistry research, the accepted standard has been that mammalian bile acids are amide conjugated by a host liver enzyme (Bile acid-CoA:amino acid N-acyltransferase, BAAT) with either glycine or taurine. Here we report amide conjugations with phenylalanine, tyrosine and leucine associated with the microbiome in mice, and as shown below, these compounds are common in humans.
Translation to humans using Mass Spectrometry Search Tool (MASST)
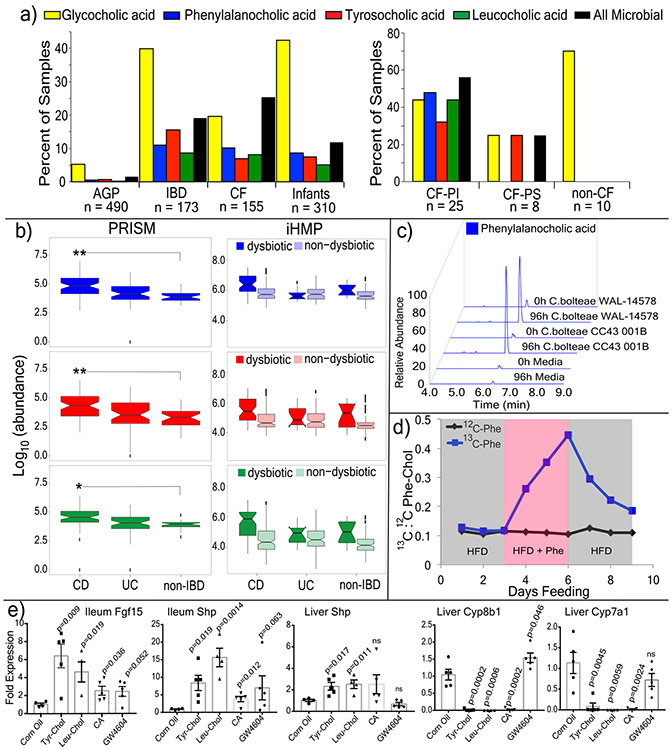
A MASST search of 1,004 public data sets available in the Global Natural Products Social Molecular Networking (GNPS) database revealed spectral matches corresponding to Phe-chol, Tyr-chol and Leu-chol in 28 studies comprising samples from the GI tract of both mice (3.2 to 59.4% of all samples) and humans (1.6 to 25.3% of all samples, Extended Data Fig. 7)11. In data from fecal samples collected for the American Gut Project28, at least one of these unique bile acids was found in 1.6% of human fecal samples, with Tyr-chol being most prevalent (n=490, Fig. 3a). They were found in higher frequency from patients with inflammatory bowel disease (IBD), cystic fibrosis (CF) and in infants (Fig. 3a).
Figure 3. Presence, synthesis and function of microbial bile acid conjugates.
a) Percent of samples positive for the novel bile acids from GNPS public datasets (AGP=American gut project28, CF=cystic fibrosis) and pediatric CF patients compared to non-CF controls (PS=Pancreatic Sufficient, PI=Pancreatic Insufficient, color coding of bile acids refers to panels a-c). b) Abundance of novel conjugates in the PRISM and HMP2 datasets31. Statistical significance for PRISM data was tested using the Wald’s test (CD n=68; UC n=53; non-IBD n=34) and for the iHMP dataset with a linear mixed-effects model (two-sided). The iHMP comparisons are separated by IBD type and dysbiotic or non-dysbiotic states (UC n=12 dysbiotic and n=110 non-dysbiotic metabolomes; for CD n=48 dysbiotic and n=169 non-dysbiotic; non-IBD dysbiotic n=15, non-IBD non-dysbiotic n=107). Significance is shown using Benjamini-Hochberg corrected p-values (Leu q=0.031, Tyr q=0.0074, Phe q=0.0043, *q<0.05, **q<0.05). Boxes represent the IQR, notch is the 95% confidence interval of the mean, center is the median, and whiskers are 1.5 x the IQR. c) Extracted ion chromatograms of Phe-chol from cultured isolates of C. bolteae compared to media control at 0h and 96h (top, repeated twice). d) The ratio of 13C:12C Phe-chol in mouse fecal samples fed a high fat diet with 13C-labelled phenylalanine (blue line) or unlabeled phenylalanine (black line) through time. Grey area indicates 3-day period where HFD was fed, red indicates when HFD was supplemented with Phe. e) RT-qPCR data showing mean and standard error of the gene expression ratio (ddCt) of Fgf15, Shp, Cyp7b1 and Cyp7a1 to the 36B4 (RPLPO) reference control in the ileum and/or liver of mice gavaged with different bile acids compared to a mock control (corn oil) after 72 hrs. Statistical significance was tested against the mock control with a two-tailed T-test (n=4-5/group, whiskers in the plot are the standard error). CA=cholic acid
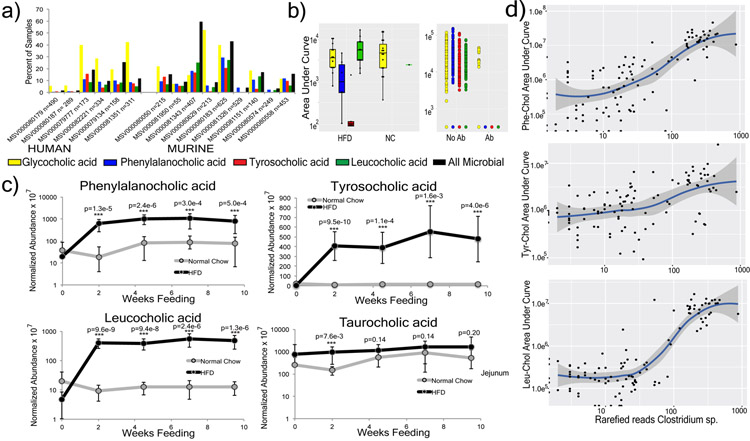
Re-analysis of GNPS deposited data from a previously published study of the murine microbiome and liver cancer enabled a comparison of the abundance of these molecules in mice fed a high-fat-diet (HFD) and treated with antibiotics29 (Extended data Fig. 7). The Phe, Tyr, and Leu amino acid conjugates were undetectable upon antibiotic exposure, whereas GCA remained, supporting the role of the microbiome in the novel conjugation. In the same study, Phe-chol and Leu-chol were more abundant in mice fed a HFD, with no change observed in the host-conjugated GCA29 (Extended data Fig. 7). We further validated this association in data from a separate study where atherosclerosis-prone mice fed HFD also had elevated levels of the microbial conjugates without a corresponding change in the host-produced TCA (Extended data Fig. 7). CF is known to result in insufficient production of pancreatic lipase, microbial dysbiosis and the buildup of fat in the gut30. In public data from a pediatric CF patient cohort, we found these compounds were more prevalent in CF patients than healthy controls, particularly those with pancreatic insufficiency (Fig. 3a). Finally, detection of the novel conjugates in IBD patients led to mining metabolome data from the second stage of the human microbiome project (HMP231) that focused on differences between IBD patients and controls, including those with the IBD subtypes Crohn’s disease (CD) and ulcerative colitis (UC)31 (Fig. 3b, Table S8). All three metabolites were significantly higher in the dysbiotic state of CD patients but not UC patients (Figure 3b, statistics in supplemental data). Thus, MASST-based mining of GNPS public data showed that these compounds are not only found in healthy humans, but enriched in individuals with fatty guts and IBD, implicating a potential role in, or symptom of, gut dysbiosis and human disease.
Microbes produce the novel bile acids.
There was a strong positive correlation between a Clostridium sp. and all three bile acids when mice were fed HFD (Pearson’s r for Phe-cholate r = 0.73, Tyr-cholate, r = 0.50 and Leu-cholate, r = 0.74, Extended data Fig. 7, Table S3). Clostridia are known to oxidize, epimerize, and deconjugate bile acids32,33. We therefore cultured 20 human gut microbes (with emphasis on Clostridia) in fecal culture media34 that contained amino acids and cholic acid precursors to screen for production of the novel conjugates. C. bolteae strain WAL-14578 and strain CC43001B synthesized both Phe-chol and Tyr-chol (Extended data Fig. 8). Addition of labeled 13C-phenylalanine to the media verified that C. bolteae strain WAL-1457 could synthesize Phe-chol from the amino acid and cholate precursors (Extended data Fig. 8). Similarly, we fed mice HFD with 13C-phenylalanine and were able to detect labelled Phe-chol in their feces; demonstrating microbial synthesis in vivo and that the amino acid precursors could come from diet (Fig. 3d). C. bolteae is a bile resistant gut bacterium that is more common in autistic children35, associated with abdominal infections36, and together with Blautia producta, prevented colonization from vancomycin resistant Enterococcus in mice37. The production of these bile acids by C. bolteae further verifies their association with the microbiota of the murine gut and implicates them as potentially important for inter-microbial interactions in the gut microbiome. However, addition of the novel conjugates to batch cultures of human fecal samples did not affect community structure (Extended data Fig. 8), leading to our investigation of how these compounds may affect gut physiology through host receptor signaling.
Novel Bile Acids and FXR.
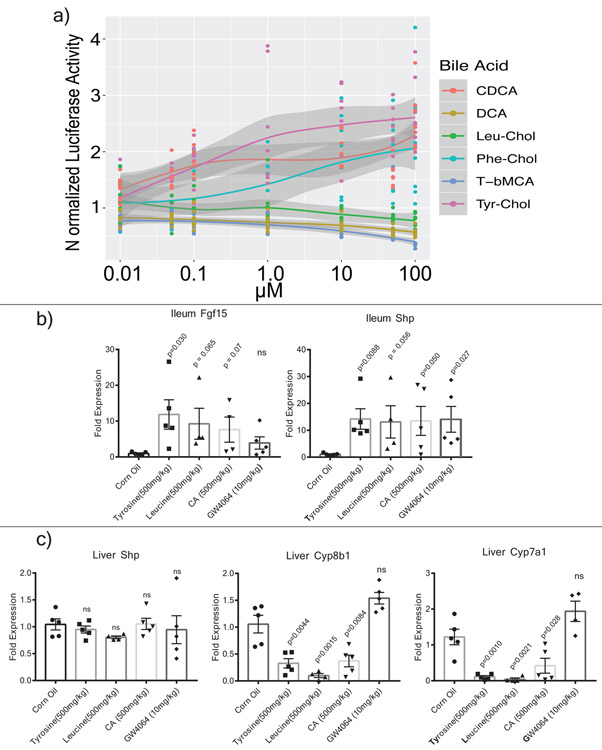
The farnesoid X receptor (FXR) is a key receptor for bile acids expressed in the intestine, liver and other tissues. The most potent naturally occurring agonistic ligand of FXR is chenodeoxycholic acid (CDCA), while Tauro-beta-muricholic acid (T-βMCA) is an FXR antagonist38. To assess the ability of the novel bile acids from this study to affect human FXR signaling, a luciferase reporter assay was established in HEK-293 embryonic kidney cells39. Phe-chol and Tyr-chol were strong human FXR agonists (Extended data Fig. 9, Table S9). The phenylalanine conjugate (R2=0.92, EC50=4.5 μM) was twice as strong of an agonist as CDCA (R2=0.88, EC50= 9.7 μM), while the tyrosine conjugate was the most potent (R2 =0.93, EC50=0.14μM). Furthermore, gavage of mice with these compounds increased expression of the FXR effector genes Fgf15 and Shp in the intestine (12.2 and 13.3-fold with Tyr-Chol at 24 hrs, p=0.029 and 0.009; 6.2 and 9.3-fold at 72 hrs, p=0.009 and 0.019, Fig. 3e, Extended data Fig. 9). Although Shp expression did not change detectably in the liver at 24 hrs after gavage, levels were increased 2.3-fold after 72 hrs (p=0.017, Fig. 3e, Extended data Fig. 9). Changes in expression of the bile acid synthesis genes Cyp7a1 and Cyp8b1 also showed a time dependent effect. Cyp7a1 was 9% of control levels at 24 hrs (p=0.001) and Cyp8b1 was at 69% (p=0.004, Extended data Fig. 9). At 72 hrs (4 gavages), Cyp7a1 expression was 8% of control (p=0.004) while Cyp8b1 the transcript was further reduced to 2% (p=0.0002, Fig. 3e). The strong time-dependent reduction of liver Cyp7a1 and Cyp8b1 transcripts indicates that similar to the primary bile acid cholic acid, gavage of mice with these compounds reduced the expression of downstream FXR target genes responsible for bile acid synthesis in the liver. It cannot be excluded, however, that this effect was due to FXR agonism through release of cholate from amide conjugate hydrolysis.
Bile acid metabolism by the microbiome has been described since the 1960s40. The four known mechanisms of microbial metabolism are dehydroxylation, dehydration and epimerization of the cholesterol backbone, and deconjugation of the amino acids glycine or taurine1,41,42. Here, we identified a fifth mechanism of bile acid transformation by the microbiome mediated by a completely different mechanism: amide conjugation of the cholate backbone with the amino acids phenylalanine, tyrosine and leucine. Though there are homologues of the human bile acid conjugation gene BAAT in clostridial genomes, the microbial enzyme in question remains unknown. Regardless of the mechanism of their synthesis, these novel conjugates stimulate the human FXR receptor in a cell-based system and the expression of FXR-target genes responsible for bile acid production in the liver were reduced when administered to mice. Additional studies are needed to understand the health implications of bile acid re-conjugation by the human microbiome and their potential effects on FXR-related diseases.
Conclusion.
This study shows that the chemistry of all organ systems are affected by the presence of a microbiome. The strongest signatures come from the gut, particularly via the breakdown of plant natural products from food and the manipulation of bile acids. The microbiome is primarily a catabolic entity, breaking down compounds through enzymatic removal of chemical groups. However, an anabolic reaction was found that represented a fifth mechanism of bile acid metabolism by the microbiome through unique amino acid conjugations of cholic acid. As the connections between humans and our microbial symbionts becomes increasingly appreciated, a combination of globally untargeted approaches and the development of tools that interlink these data sets, such as the GNPS and MASST analysis infrastructure, will enable more efficient characterization of microbial molecules and efficient translation between model animals and human studies, leading to a better understanding of the deep connection between our microbiota, our metabolites, and our health.
Extended Data
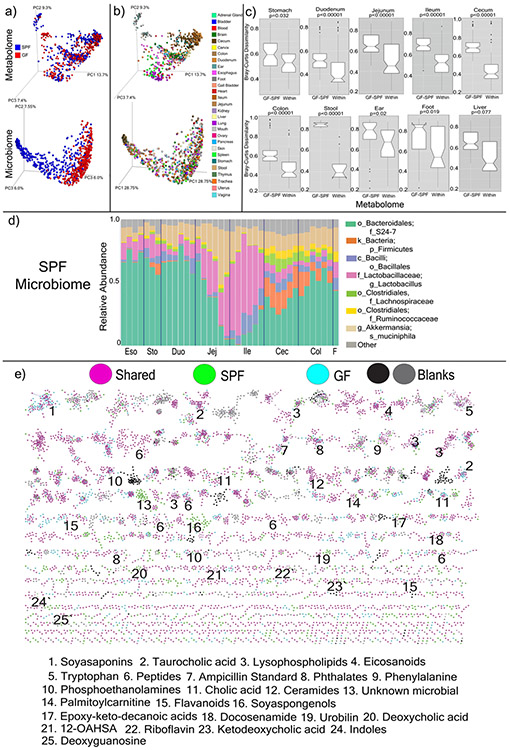
Extended Data Fig. 1. Microbiome and Metabolome Diversity in GF and SPF mice.
a) Principal coordinates analysis (PCoA) of microbiome and mass spectrometry data highlighted by sample source as GF or SPF (n=4). The microbial signatures from the GF mice are an important control that represent background reads found in buffers, tips and tubes and other experimental materials. b) Same data highlighted by organ source (n=4). c) Bray-Curtis dissimilarities of the metabolome data collected from murine organs. The dissimilarities are calculated within individual mice of the same group (GF or SPF, “Within”) or across the GF and SPF groups (“GF-SPF”) (n=4). Only samples collected from exact same location (sub-section) are compared. Significance tested with the Mann-Whitney U-test (two sided, Boxes represent the IQR, the notch is the 95% confidence interval of the mean, the center is the median, and whiskers are 1.5x the IQR). d) Microbiome profile of the murine GI tract in SPF mice. Data was generated by sequencing 16S rRNA gene amplicons from each organ and organ section and analyzed through the Qiita Deblur pipeline as described in the methods. Taxa of relevance are color coded according to the legend. e) Molecular network of LC-MS/MS data with nodes colored by source as GF, SPF, shared, or detected in blanks. Molecular families with metabolites annotated by spectral matching in GNPS are listed by a number corresponding to the molecular family. These are level 2 or 3 annotations according to the metabolomics standards consortium16. 12-OAHSA = 12-(9Z-Octadecenoyloxy)-octadecanoic acid
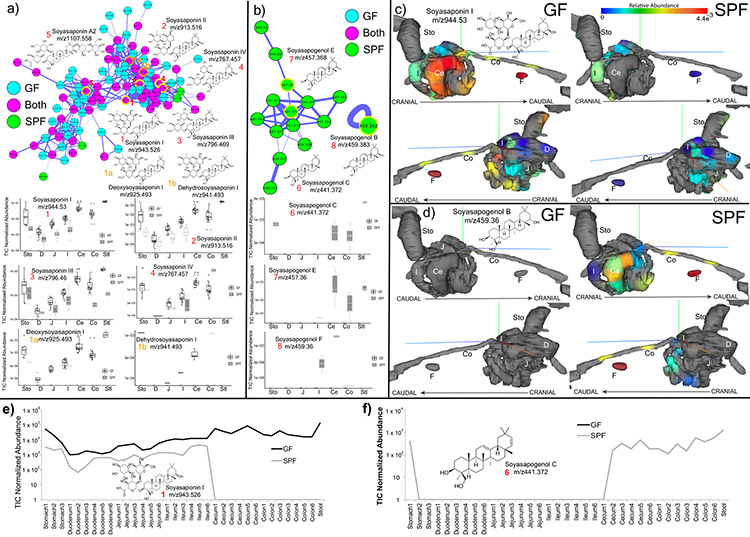
Extended Data Fig. 2. Microbial metabolism of soyasaponins in GF and SPF metabolomics data (n=4).
a) Molecular network cluster of soyasaponins colored by source of each node as GF, SPF or shared. Structures of corresponding molecules are shown in nodes highlighted in yellow according to the numbering scheme. Mean total ion current normalized (TIC) abundance of each soyasaponin metabolite from the murine GI tract in the GF and SPF mice (Sto=Stomach, D=Duodenum, J=Jejunum, I=Ileum, Ce=Cecum, Co=Colon, Stl=Stool) (Boxes represent the IQR, the center is the median, and whiskers are 1.5x the IQR, n=4). b) Molecular family of soyasapogenols, their structures and relative abundances in GF and SPF gut organs (data same format a s in a)). c) ‘ili 3-D model visualization of the normalized abundance of soyasaponin I in the murine GI tract. Abundance of the metabolite is indicated according to the viridis spectrum (high red/hot colors, low blue/cool colors) n=4. d) ‘ili 3D cartography of the normalized abundance of soyasapogenol B onto an MRI organ model of the mice. e) Mean normalized abundance of soyasaponin I through all GI sample locations in the GF and SPF mice. f) Mean normalized abundance of soyasapogenol through all GI sample locations. The annotations are level 2 or 33.
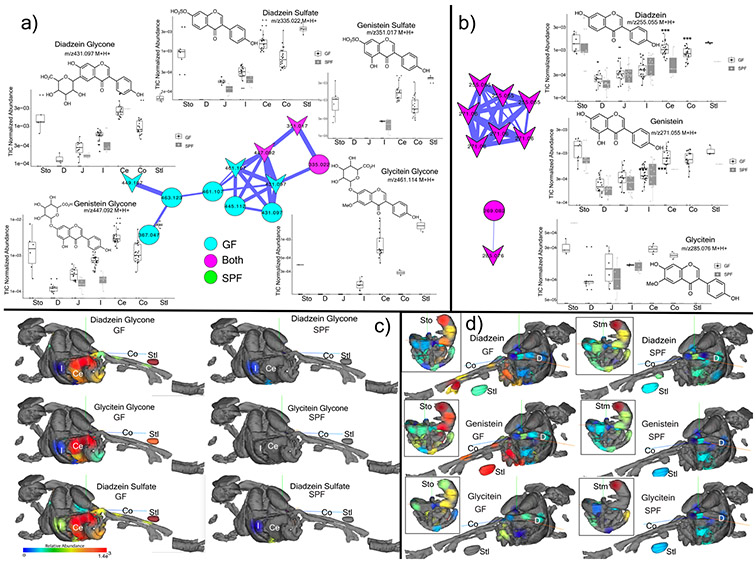
Extended Data Fig. 3. Microbial metabolism of plant isoflavones in GF and SPF metabolomics data.
a) Structures, molecular network and total ion chromatogram (TIC) normalized abundance of glycone isoflavanoids in the murine GI tract. Nodes are colored according to their source in GF or SPF mice (n=4) and known library hits are shaped as arrowheads (Sto=Stomach, D=Duodenum, J=Jejunum, I=Ileum, Ce=Cecum, Co=Colon, Stl=Stool, Boxes represent the IQR, the center is the median, and whiskers are 1.5 x the IQR, n=4). b) Same information for the aglycones. c) 3D-molecular cartography mapping the abundance of the daidzein and glycitein glycone and sulfated forms through entire 3D-mouse model. The normalized abundance of a particular molecule is indicated as a heat map with red being most abundant and blue being lowest abundance. d) 3D-molecular cartography mapping the abundance of the daidzein and glycitein aglycone forms through entire 3D-mouse model. The GI tract model only is inset for reference. The annotations are level 2 or 33.
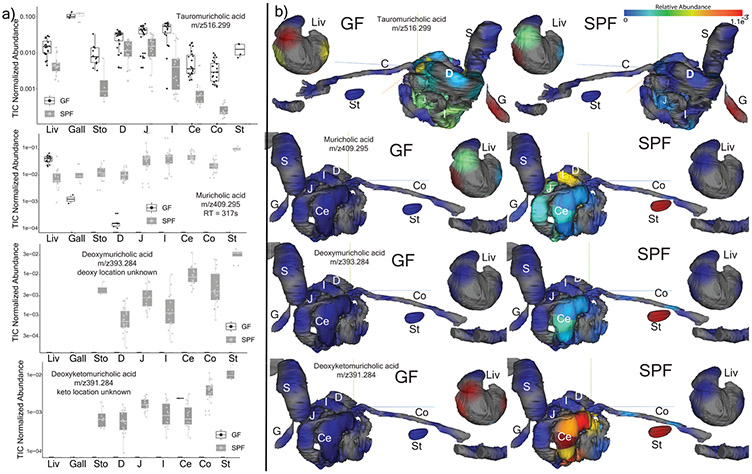
Extended Data Fig. 4. Microbial metabolism of known bile acids in GF and SPF metabolomics data (n=4).
a) Total ion chromatogram (TIC) normalized abundance of taurocholic acid and secondary bile acids in GF and SPF mice GI tract samples (Liv=Liver, G=Gall, Sto=Stomach, D=Duodenum, J=Jejunum, I=Ileum, Ce=Cecum, Co=Colon, Stl=Stool Boxes represent the IQR, the center is the median, and whiskers are 1.5 x the IQR). b) 3D-molecular cartography mapping the abundance of the same bile acids through the mouse GI tract model including liver separated for better visualization. The normalized abundance of a particular molecule is indicated as a heat map with red being most abundant and blue being lowest abundance. The annotations are level 2 or 33.
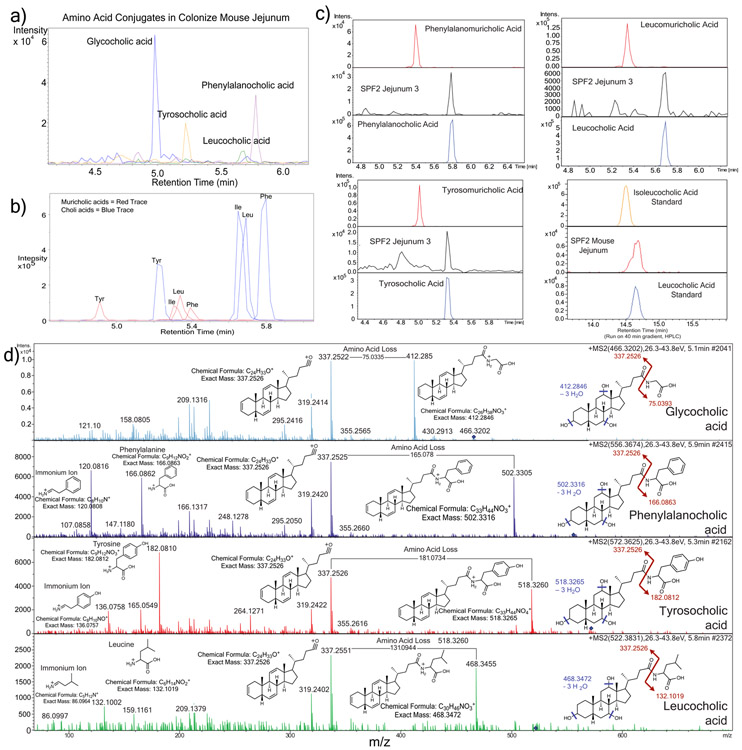
Extended Data Fig. 5. Mass spectrometry analysis of novel conjugated bile acids.
a) Extracted ion chromatogram MS1 traces of Tyr-chol (m/z 572.37 +/− 0.05 Da), Phe-chol (m/z 556.37 +/− 0.05 Da) and Leu-chol (m/z 522.37 +/− 0.05 Da, experiments performed four times). b) Extracted ion chromatograms for the synthetic muricholic and cholic acid versions of the Phe- (m/z556.37 +/−0.05), Tyr- (572.37 +/−0.05) and Leu- (522.37 +/−0.05) conjugates showing the different retention times from the muricholic and cholic acid forms. c) Retention time alignments of novel synthetic muricholic and cholic acid conjugates with the novel conjugates found those found in a colonized murine jejunum sample. The isoleucocholic and leucocholic acid analysis was run on a long gradient HPLC column to separate isomeric ile/leu conjugates and compare to that detected in vivo. d) Annotation of MS/MS fragmentation patterns for the 3 novel conjugated bile acids discovered in this manuscript and GCA. Structures of the immonium ions from amino acid fragmentation, whole amino acid fragments and major sterol fragment are shown. Loss of the amino acid mass on the bile acid steroid backbone is also highlighted.
Extended Data Figure 6. Distribution and metabolism of novel conjugated bile acids.
a) Molecular network of SPF duodenum MS/MS data and synthesized amino acid conjugated bile acids. LC-MS/MS data from synthetic standards was networked with murine samples and spectral matching through molecular networking is indicated by node coloring. Mirror plots showing the alignment between the murine and standards are shown. Nodes shaped as arrowheads had hits in the GNPS libraries and node size is scaled to the spectral count. Tauro=Taurocholic acid. These experiments were repeated twice. b) 3D-molecular cartography of the mean abundance of the newly discovered conjugates mapped onto a 3D-rendered model of the murine GI tract as a heatmap according to the color scale. Organs are labeled as described in Fig. 1. c) Molecular network of GF and SPF portal and peripheral blood conjugated bile acids. Nodes are colored by source as either GF and SPF or portal/peripheral blood. Arrowhead nodes represent known compounds in the GNPS spectral database, circular nodes represent unknowns. The annotations are through spectral matches against reference libraries (level 2 or 33). d) Mean area under curve abundance and standard deviations of bile acids of interest during incubation with an actively growing batch human fecal culture for 24 h (n=3). e) Molecular network of novel conjugated bile acids after incubation in a human fecal batch culture experiment. Each node represents a unique MS/MS spectrum and arrowhead shaped nodes indicate known spectra in the GNPS database. The nodes are colored by their retention time according to the legend and the mass shift between nodes are mapped onto the edge representing the cosine connection between related spectra. The H2 mass shift representing oxidation of the novel conjugates is shown. f) Mean ion intensity and standard deviations of the dehydrogenated forms of Phe-chol, Tyr-chol and Leu-chol through the 24h batch fecal culture incubation (n=3).
Extended Data Fig. 7. MASST search results and associations of novel conjugated bile acids with high fat diet.
a) Proportion of samples where Phe-chol, Tyr-chol and Leu-chol were found from a single spectrum MASST search of publicly available data on GNPS. Massive data set ID’s are shown for each dataset and they are divided as either murine or human GI samples. b) Boxplots (boxes represent the interquartile range (IQR), the line is the median, and whiskers are 1.5 x the IQR) of the novel conjugates in a previously published murine study where animals were fed high fat diet (HFD, n=14) or normal chow (NC, n=19) (Gly p=0.72, Phe p=0.038, Tyr p=0.083, Leu p=9.4 x10⁻⁵) and dotplot of mice treated with (n=27) or without antibiotics (Ab, n=415)29. Bottom color legend corresponds to panels a and b. c) Mean normalized abundance of the three novel conjugated bile acids compared to taurocholic acid in mice (apoE knockout on a C57BL/6J background) fed either HFD (n=12) or normal chow for 10 weeks (n=12). Fecal samples were collected and extracted in 50:50 methanol water and analyzed with LC-MS/MS metabolomics as described in the methods. Standard deviations around the means are shown and significance between HFD and normal chow at each time point is tested with the student’s t-test (***=p<0.001, two sided). d) Correlations between rarefied reads of a deblurred read assigned to a Clostridium sp. from atherosclerosis mice fed high fat diet through time (n=12). The line of best fit is plotted using the lm method in the R statistical software gray area around the line of best fit is the 95% confidence interval.
Extended Data Fig. 8. Synthesis of novel conjugated bile acids by Clostridia spp.
a) Dotplot of the measured production of Phe-chol and Tyr-chol using a targeted LC-MS method for two Clostridium bolteae strains grown in fecal culture media (FCM) with or without labelled Phe (n=2). b) The mean ratio and standard error of 13C:12C phenylalanocholic acid from the same C. bolteae strains when grown with fecal culture media (FCM) with 13C-labelled phenylalanine (bottom left, n=2). c) Mean and standard deviation of the Shannon index of human fecal batch culture (n=3) before and after 24-hour growth exposed to conjugated bile acids or a mock control (NS = not significant by Mann-Whitney U-test). d) Box and whisker plots of concentration of Phe-chol and Tyr-chol in original SPF gut samples. (Boxes represent the IQR, the center is the median, and whiskers are 1.5 x the IQR, n=4)
Extended Data Fig. 9. Effect of novel bile acids on FXR.
a) Mean normalized luciferase activity as a readout of human FXR stimulation when exposed to various conjugated and unconjugated bile acids as a function of the compound dose (n= 8 measurements, +/− SE, DCA=deoxycholic acid, CDCA=chenodeoxycholic acid, T-βMCA=tauro-beta-muricholic acid). b) Ileum mean fold expression change compared to 36B4 control of various bile acids after gavage in mice (error bars are standard error). c) Liver fold expression change compared to 36B4 control of various bile acids after gavage in mice. Significance was tested with the two-tailed t-test compared to the mock corn oil control (error bars are the standard error).
Supplementary Material
Acknowledgements:
The authors would like to acknowledge funding from the National Institutes of Health 5U01AI124316-03, 1R03CA211211-01, 1R01HL116235 U54DE023798, R24DK110499, GMS10RR029121 and R01HD084163. Additionally, B.S.B. was supported by UCSD KL2 (1KL2TR001444), J.L. by grant 13EIA14660045 from the American Heart Association. T.D.A National Library of Medicine Training Grant: NIH grant T15LM011271. R.M.E is an investigator of the Howard Hughes Medical Institute and March of Dimes Chair in Molecular and Developmental Biology at the Salk Institute. RME was funded by grants from the NIH (DK057978, HL105278, HL088093, and ES010337), and Samuel Waxman Cancer Research Foundation. T.F. is supported by a Hewitt Medical Foundation Fellowship. We would like to acknowledge Gail Ackermann for her contributions. This work was also supported in part by Seed Grants from the UC San Diego Center for Microbiome Innovation. This work was funded by grants from the NIH (DK057978, HL105278 and HL088093), National Cancer Institute (CA014195), National Health and Medical Research Council of Australia Project grants (grant 1087297 to C.L. and M.D.), the Leona M. and Harry B. Helmsley Charitable Trust (2017PG-MED001), SWCRF Investigator Award and Ipsen/Biomeasure. T.F. is supported by Hewitt Medical Foundation Fellowship, a Salk Alumni Fellowship and Crohn’s & Colitis Foundation (CCFA) Visiting IBD Research Fellowship. R.M.E. and M.D. are supported, in part, by a Stand Up to Cancer-Cancer Research UK-Lustgarten Foundation Pancreatic Cancer Dream Team Research Grant (Grant Number: SU2C-AACR-DT-20-16). Stand Up To Cancer is a program of the Entertainment Industry Foundation. Research grants are administered by the American Association for Cancer Research, the scientific partner of SU2C. R.M.E is an investigator of the Howard Hughes Medical Institute and March of Dimes Chair in Molecular and Developmental Biology at the Salk Institute. Research reported in this publication was also supported by the National Institute of Environmental Health Sciences of the National Institutes of Health under Award Number P42ES010337. The content is solely the responsibility of the authors and does not necessarily represent the official views of the National Institutes of Health.
Footnotes
Data Availability: All metabolomics data that support the findings of this study is available at GNPS (gnps.ucsd.edu) under the MassIVE ID numbers: MSV000079949 (original GF and SPF mouse data), MSV000082480, MSV000082467, MSV000079134, MSV000082406, MSV000083032, MSV000083004, MSV000083446. The sequencing data for the GF and SPF mouse study is available on the Qiita microbiome data analysis platform at qiita.ucsd.edu under study ID 10801 and through the European Bioinformatics Institute accession number ERP109688. Source data is available with the online article for figures 1, 2 and 3.
Ethics Statement: We have complied with all relevant ethical regulations pertaining to this manuscript. Study subjects in this manuscript provided informed consent. Institutional review boards from the following institutions reviewed this study under the listed IRB#s: UC San Diego #160034, #131487, Yale University #1206010476 and the University of Michigan #103575.
Code Availability: MASST can be accessed at masst.ucsd.edu and the development is described in the following preprint https://www.biorxiv.org/content/10.1101/591016v1 the code for MS/MS-based MASST Searching is available here: https://github.com/CCMS-UCSD/GNPS_Workflows/tree/master/search_single_spectrum
References
- 1.Ridlon JM, Kang DJ, Hylemon PB & Bajaj JS Bile acids and the gut microbiome. Curr. Opin. Gastroenterol 30, 332–8 (2014). [DOI] [PMC free article] [PubMed] [Google Scholar]
- 2.Gilbert JA et al. Microbiome-wide association studies link dynamic microbial consortia to disease. Nature 535, (2016). [DOI] [PubMed] [Google Scholar]
- 3.Wikoff WR et al. Metabolomics analysis reveals large effects of gut microflora on mammalian blood metabolites. Proc. Natl. Acad. Sci. U. S. A 106, 3698–703 (2009). [DOI] [PMC free article] [PubMed] [Google Scholar]
- 4.Marcobal A et al. Metabolome progression during early gut microbial colonization of gnotobiotic mice. Sci. Rep 5, 11589 (2015). [DOI] [PMC free article] [PubMed] [Google Scholar]
- 5.Miller TL & Wolin MJ Pathways of acetate, propionate, and butyrate formation by the human fecal microbial flora. Appl. Environ. Microbiol 62, 1589–92 (1996). [DOI] [PMC free article] [PubMed] [Google Scholar]
- 6.Gillner M, Bergman J, Cambillau C, Fernström B & Gustafsson JA Interactions of indoles with specific binding sites for 2,3,7,8-tetrachlorodibenzo-p-dioxin in rat liver. Mol. Pharmacol 28, 357–63 (1985). [PubMed] [Google Scholar]
- 7.Martin F-PJ et al. A top-down systems biology view of microbiome-mammalian metabolic interactions in a mouse model. Mol. Syst. Biol 3, 112 (2007). [DOI] [PMC free article] [PubMed] [Google Scholar]
- 8.Moriya T, Satomi Y, Murata S, Sawada H & Kobayashi H Effect of gut microbiota on host whole metabolome. Metabolomics 13, 101 (2017). [Google Scholar]
- 9.Swann JR et al. Systemic gut microbial modulation of bile acid metabolism in host tissue compartments. Proc. Natl. Acad. Sci. U. S. A 108 Suppl 1, 4523–30 (2011). [DOI] [PMC free article] [PubMed] [Google Scholar]
- 10.Structure, function and diversity of the healthy human microbiome. Nature 486, 207–14 (2012). [DOI] [PMC free article] [PubMed] [Google Scholar]
- 11.Wang M et al. Sharing and community curation of mass spectrometry data with Global Natural Products Social Molecular Networking. Nat. Biotechnol 34, 828–837 (2016). [DOI] [PMC free article] [PubMed] [Google Scholar]
- 12.Watrous J et al. Mass spectral molecular networking of living microbial colonies. Proc. Natl. Acad. Sci. U. S. A 109, 1743–52 (2012). [DOI] [PMC free article] [PubMed] [Google Scholar]
- 13.Protsyuk I et al. 3D molecular cartography using LC–MS facilitated by Optimus and ‘ili software. Nat. Protoc 13, 134–154 (2017). [DOI] [PubMed] [Google Scholar]
- 14.Hofmann AF & Hagey LR Key discoveries in bile acid chemistry and biology and their clinical applications: history of the last eight decades. J. Lipid Res 55, 1553–95 (2014). [DOI] [PMC free article] [PubMed] [Google Scholar]
- 15.Yang JY et al. Molecular networking as a dereplication strategy. J Nat Prod 76, 1686–1699 (2013). [DOI] [PMC free article] [PubMed] [Google Scholar]
- 16.Sumner LW et al. Proposed minimum reporting standards for chemical analysis Chemical Analysis Working Group (CAWG) Metabolomics Standards Initiative (MSI). Metabolomics 3, 211–221 (2007). [DOI] [PMC free article] [PubMed] [Google Scholar]
- 17.Hartmann AC et al. Meta-mass shift chemical profiling of metabolomes from coral reefs. Proc. Natl. Acad. Sci. U. S. A 114, (2017). [DOI] [PMC free article] [PubMed] [Google Scholar]
- 18.Hirano S & Masuda N Characterization of NADP-dependent 7 beta-hydroxysteroid dehydrogenases from Peptostreptococcus productus and Eubacterium aerofaciens. Appl. Environ. Microbiol 43, 1057–63 (1982). [DOI] [PMC free article] [PubMed] [Google Scholar]
- 19.Wahlström A, Sayin SI, Marschall H-U & Bäckhed F Intestinal Crosstalk between Bile Acids and Microbiota and Its Impact on Host Metabolism. Cell Metab. 24, 41–50 (2016). [DOI] [PubMed] [Google Scholar]
- 20.Huijghebaert SM & Hofmann AF Influence of the amino acid moiety on deconjugation of bile acid amidates by cholylglycine hydrolase or human fecal cultures. J. Lipid Res 27, 742–52 (1986). [PubMed] [Google Scholar]
- 21.Myher JJ, Marai L, Kuksis A, Yousef IM & Fisher MM Identification of ornithine and arginine conjugates of cholic acid by mass spectrometry. Can. J. Biochem 53, 583–90 (1975). [DOI] [PubMed] [Google Scholar]
- 22.PERIC-GOLIA L & JONES RS Ornithocholanic acids and cholelithiasis in man. Science 142, 245–6 (1963). [DOI] [PubMed] [Google Scholar]
- 23.Gordon BA, Kuksis A & Beveridge JMR Separation of bile acid conjugates by ion exchange chromatorgraphy. Can. J. Biochem. Physiol 41, 77–89 (1963). [PubMed] [Google Scholar]
- 24.Yousef IM & Fisher MM Bile acid metabolism in mammals. VIII. Biliary secretion of cholylarginine by the isolated perfused rat liver. Can. J. Physiol. Pharmacol 53, 880–7 (1975). [DOI] [PubMed] [Google Scholar]
- 25.Tamari M, Ogawa M & Kametaka M A new bile acid conjugate, ciliatocholic acid, from bovine gall bladder bile. J. Biochem 80, 371–7 (1976). [DOI] [PubMed] [Google Scholar]
- 26.Hagey LR, Schteingart CD, Rossi SS, Ton-Nu HT & Hofmann AF An N-acyl glycyltaurine conjugate of deoxycholic acid in the biliary bile acids of the rabbit. J. Lipid Res 39, 2119–24 (1998). [PubMed] [Google Scholar]
- 27.Nair PP, Solomon R, Bankoski J & Plapinger R Bile acids in tissues: binding of lithocholic acid to protein. Lipids 13, 966–78 (1978). [DOI] [PubMed] [Google Scholar]
- 28.McDonald D et al. American Gut: an Open Platform for Citizen Science Microbiome Research. mSystems 3, e00031–18 (2018). [DOI] [PMC free article] [PubMed] [Google Scholar]
- 29.Shalapour S et al. Inflammation-induced IgA+ cells dismantle anti-liver cancer immunity. Nature 551, 340–345 (2017). [DOI] [PMC free article] [PubMed] [Google Scholar]
- 30.Manor O et al. Metagenomic evidence for taxonomic dysbiosis and functional imbalance in the gastrointestinal tracts of children with cystic fibrosis. Sci. Rep 6, 22493 (2016). [DOI] [PMC free article] [PubMed] [Google Scholar]
- 31.Lloyd-Price J et al. Multi-omics of the gut microbial ecosystem in inflammatory bowel diseases. Nature 569, 655–662 (2019). [DOI] [PMC free article] [PubMed] [Google Scholar]
- 32.Hirano S, Masuda N, Oda H & Mukai H Transformation of bile acids by Clostridium perfringens. Appl. Environ. Microbiol 42, 394–9 (1981). [DOI] [PMC free article] [PubMed] [Google Scholar]
- 33.Winston JA & Theriot CM Impact of microbial derived secondary bile acids on colonization resistance against Clostridium difficile in the gastrointestinal tract. Anaerobe 41, 44–50 (2016). [DOI] [PMC free article] [PubMed] [Google Scholar]
- 34.McDonald JAK et al. Evaluation of microbial community reproducibility, stability and composition in a human distal gut chemostat model. J. Microbiol. Methods 95, 167–174 (2013). [DOI] [PubMed] [Google Scholar]
- 35.Finegold SM et al. Pyrosequencing study of fecal microflora of autistic and control children. Anaerobe 16, 444–453 (2010). [DOI] [PubMed] [Google Scholar]
- 36.Dehoux P et al. Comparative genomics of Clostridium bolteae and Clostridium clostridioforme reveals species-specific genomic properties and numerous putative antibiotic resistance determinants. BMC Genomics 17, 819 (2016). [DOI] [PMC free article] [PubMed] [Google Scholar]
- 37.Caballero S et al. Cooperating Commensals Restore Colonization Resistance to Vancomycin-Resistant Enterococcus faecium. Cell Host Microbe 21, 592–602.e4 (2017). [DOI] [PMC free article] [PubMed] [Google Scholar]
- 38.Sayin SI et al. Gut Microbiota Regulates Bile Acid Metabolism by Reducing the Levels of Tauro-beta-muricholic Acid, a Naturally Occurring FXR Antagonist. Cell Metab. 17, 225–235 (2013). [DOI] [PubMed] [Google Scholar]
- 39.Downes M et al. A Chemical, Genetic, and Structural Analysis of the Nuclear Bile Acid Receptor FXR. Mol. Cell 11, 1079–1092 (2003). [DOI] [PMC free article] [PubMed] [Google Scholar]
- 40.Gustafsson BE, Gustafsson JA & Sjövall J Intestinal and fecal sterols in germfree and conventional rats. Bile acids and steroids 172. Acta Chem. Scand 20, 1827–35 (1966). [DOI] [PubMed] [Google Scholar]
- 41.Midtvedt T Microbial bile acid transformation. Am. J. Clin. Nutr 27, 1341–1347 (1974). [DOI] [PubMed] [Google Scholar]
- 42.Gérard P & Philippe. Metabolism of Cholesterol and Bile Acids by the Gut Microbiota. Pathogens 3, 14–24 (2013). [DOI] [PMC free article] [PubMed] [Google Scholar]
Associated Data
This section collects any data citations, data availability statements, or supplementary materials included in this article.


