

Abstract
Semi-solid fluid electrode-based battery (SSFB) and supercapacitor technologies are seen as very promising candidates for grid energy storage. However, unlike for traditional batteries, their performance can quickly get compromised by the formation of a poorly conducting solid–electrolyte interphase (SEI) on the particle surfaces. In this work we examine SEI film formation in relation to typical electrochemical conditions by combining cyclic voltammetry (CV) with quartz crystal microbalance dissipation monitoring (QCM-D). Sputtered layers of typical SSFB materials like titanium dioxide (TiO2) and carbon, immersed in alkyl carbonate solvents, are cycled to potentials of relevance to both traditional and flow systems. Mass changes due to lithium intercalation and SEI formation are distinguished by measuring the electrochemical current simultaneously with the damped mechanical oscillation. Both the TiO2 and amorphous carbon layers show a significant irreversible mass increase on continued exposure to (even mildly) reducing electrochemical conditions. Studying the small changes within individual charge–discharge cycles, TiO2 shows mass oscillations, indicating a partial reversibility due to lithium intercalation (not found for carbon). Viscoelastic signatures in the megahertz frequency regime confirm the formation and growth of a soft layer, again with oscillations for TiO2 but not for carbon. All these observations are consistent with irreversible SEI formation for both materials and reversible Li intercalation for TiO2. Our results highlight the need for careful choices of the materials chemistry and a sensitive electrochemical screening for fluid electrode systems.
Keywords: batteries, solid−electrolyte interphase, lithium intercalation, quartz crystal microbalance, cyclic voltammetry
1. Introduction
Novel solutions to grid energy storage such as semi-solid flow batteries (SSFBs) and flow supercapacitors (FSCs) have gained strong interest in the recent past.1−6 Most of these systems store energy in electrode slurries of active and conductive particles suspended in an electrolyte. Here the active particles store charge through capacitance or redox reactions, while the conductive particles form extended networks that electronically wire the active particles to current collectors. The liquid-suspended state of the particles not only offers great flexibility in operating the battery but also poses new challenges. The reason lies in the dynamic structure of the fluid: imposed or thermal motions lead to rejuvenation of the particle assembly and hence also of the individual particle contacts. This repeated making and breaking of particle contacts causes the entire surface of each particle to be exposed to electrochemically induced changes. Because these surface modifications are incorporated in the (re)assembled particle aggregates or networks, vital processes in SSFBs or FSCs can get compromised.7−10
It is well-known that during electrochemical cycling surface layers termed solid–electrolyte interphase (SEI) can form on solid electrode components (see e.g. ref (11) for a recent review). These layers are formed by the decomposition of the electrolyte solution and impurities on the anode.11−14 The SEI is typically ionically conductive and electronically insulating. SEI is a critical component of rechargeable lithium ion batteries as it passivates the anode and thus allows operation at potentials that exceed the thermodynamic stability window of the electrolyte. While essential for solid lithium ion batteries, such layer formation has been identified as potentially very detrimental to semi-solid flow systems.9,15 It increases the interparticle resistance (and overall cell resistance) and decreases the mechanical strength of the conductive particle network. A mitigation strategy suggested by some researchers is to avoid SEI formation by using materials that operate within the electrochemical stability window of the electrolytes.1,2,15 An example of this is the operation of lithium titanate (LTO) or TiO2-based SSFB anodes (lithium intercalation potential: ∼1.5 V vs Li/Li+) at voltages above 1.0 V in alkyl carbonate solvents with LiPF6.16 However, recent works have shown that significant detrimental effects due to layer formation can occur even within these conservative operating potential windows.9,10 (In fact, even in the absence of an applied voltage, a very thin SEI layer can get formed through equilibration of the Fermi levels;11,17 because of their nanometric thickness, these layers should not affect electron transport drastically.)
While there have been many studies on the formation and optimization of SEI, the scope of almost all has been traditional solid lithium batteries (e.g., refs (18−24)). A few studies have found indications of SEI layer formation within commonly used operating windows; however, these (relatively weak) effects were mostly not investigated further, probably because their relevance for traditional batteries was low. However, for SSFBs and FSCs, even thin SEI layers are potentially detrimental, as explained above. Examination for the presence and effect of thin SEI layers through the use of very (surface-) sensitive techniques is hence warranted for SSFB and FSC systems.
Electrochemical quartz crystal microbalance with dissipation monitoring (eQCM-D) is an emerging technique25,26 which combines the recent extensions of QCM with electrochemical functionality (i.e., eQCM)18,27,28 and dissipation mode (i.e., QCM-D).29,30 The acoustic shear wave of a quartz resonator is used to probe the mass changes and viscoelastic characteristics of electrochemically deposited layers. The central part of the setup consists of a quartz disc (sensor area 79 mm2) enclosed between two metallic layers, of which one is additionally coated with the material of electrochemical interest. This electrode is immersed in an electrolyte within an electrochemical cell. While the cell potential is controlled, the mass and mechanical properties of the material deposited on the electrode are monitored by piezoelectrically exciting the crystal and measuring the “ring down” of the damped mechanical oscillation. This method is very suitable for in situ probing of the formation and characteristics of SEI layers.23,31−33
In the present work we use eQCM-D to investigate two materials that have been studied in the context of SEI formation and growth in solid Li batteries: TiO234,35 and carbon.18,19,21,36,37 Both these materials are also broadly available in the form of colloidal particles and are considered for use in fluid electrodes.2,3,16 We examine these materials in the form of sputtered layers, immersed in alkyl carbonate solvents with 1 M LiPF6 as in traditional lithium-ion batteries. While exploring typical voltages for these systems, we focus in particular on the mildly reductive regime where SEI formation is often ignored. Four increasingly reductive voltage windows are addressed, and many charge–discharge cycles are performed in each of them.
Another specific focus of the present work lies in the mechanical compliance of the growing SEI layer. Extracting these from the eQCM-D data is not trivial, since they have to be obtained by fitting to a viscoelastic model. Standard models such as Voigt–Kelvin are likely to be oversimplistic31 while for more sophisticated models the number of fit parameters should be kept appropriately small. We take these issues into account and also examine the effect of slightly different model choices on the fitted masses and compliances. Building on the outcome of our analysis, we find semiquantitative trends in the compliances, and quantitative information about the mass evolution. Besides the gradual evolutions over many cycles, we also examine the changes within single charge–discharge cycles. As we will show, the latter allows us to obtain additional insights from correlations between the elastic compliance, the mass, and the amount of injected charge.
2. Materials and Methods
2.1. Materials
Propylene carbonate (PC), ethylene carbonate (EC), and dimethyl carbonate (DMC) were obtained from Sigma-Aldrich (anhydrous, 99%+ purity). LiPF6 (98% purity) and lithium foil (99.9% purity) were purchased from Alfa Aesar. All chemicals were stored in an argon-filled MBraun LABstar glovebox with H2O and O2 concentrations below 0.5 ppm. The electrolytes used in the experiments were 1 M LiPF6 salt solutions in PC (viscosity: 8 mPa·s), unless mentioned otherwise.
2.2. Sensor Preparation
Gold-coated 5 MHz quartz QCM sensors (Renelux Crystal) were used. After cleaning, they were first coated with 200 nm of sputtered copper. Amorphous carbon films were then deposited by dc magnetron sputtering using a graphite (99.999%) target disk in an argon plasma at a pressure of 6.6 μbar. The film thickness was controlled via the deposition time and verified to be ∼77 ± 2 nm by using ellipsometry. Additional characterization with X-ray diffraction and confocal Raman microscopy revealed a disordered structure (see Figures S7 and S8 in the Supporting Information); also the carbon blacks used in SSFBs and LIBs38 are relatively disordered (compared to graphitic carbon39). TiO2 films were prepared by reactive sputtering (dc power 500 W) of a titanium (99.999%) target. After the deposition of a few nanometers of pure Ti to aid adhesion, also oxygen gas (6 sccm) was admitted to the chamber to deposit an amorphous TiO2 layer. Via control over the deposition time a thickness of ∼100 nm was obtained, with a peak-to-peak roughness <10 nm, as measured with AFM. A postannealing step was performed at 500 °C in an atmospheric environment for 8 h to crystallize the amorphous film to anatase; this preparation was done in accordance with ref (40), in which also the characterization results are described.
2.3. eQCM Cell
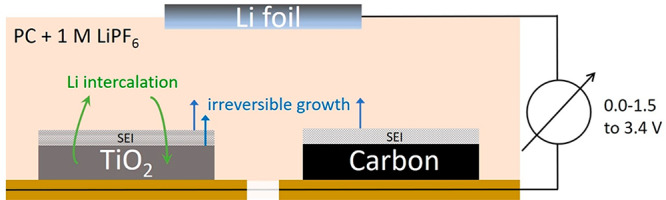
A custom eQCM cell (Figure 1) was designed to enable studying lithium-based electrochemistry in alkyl carbonate solvents. The cell uses a modified bottom holder of the commercial QSense EQCM cell (Biolin Scientific). The top part was fabricated out of PEEK and has channels to allow introduction of the electrolyte into the chamber via PEEK microfluidic connections. Directly above the fluid chamber is a replaceable lithium foil which acts as a counter electrode. The lithium foil and quartz sensor are sealed against the chamber with identical O-rings to keep their working area the same. The eQCM cell was assembled in the glovebox, completely sealed, and then connected to the QCM-D (Biolin Scientific) and electrochemical potentiostat outside. The electrode with the sputtered layer was at the common ground of both instruments.
Figure 1.

Cartoon of the eQCM cell. See text for further details.
2.4. Electrochemistry
The QCM-D cell was connected to a Biologic VSP300 potentiostat for electrochemical control. After a 1 h equilibration period resulting in a stable baseline (i.e., resonance frequency), the QCM-D measurement was initiated, and cyclic voltammetry sweeps were started from the open circuit potential. The CV’s were performed at a constant rate of 10 mV/s over four increasingly reducing voltage windows—all having 3.4 V vs Li/Li+ as the highest potential and with 1.5, 1.0, 0.5, and 0.0 V as the lowest potential.
2.5. QCM-D Analysis
Theory
The QCM-D measures, through a ring-down procedure, a complex resonance frequency f̑ that contains a real frequency f and a half-bandwidth Γ. We note here that the Q-sense QCM-D instrument outputs a dissipation factor which is a frequency-normalized bandwidth (D = 2Γ/f).
| 1 |
The instrument measures these values for multiple odd overtones n. In our experiments, we only consider the overtones from 5 to 13 as these are least affected by the mounting which can vary due to effects like O-ring swelling.41
As the QCM sensor is loaded (with a film, e.g., SEI), its complex resonance frequency shifts. If the shift is small compared to the reference resonance frequency, we can use the small load approximation (eq 2) which states that the shift is proportional to the load impedance (Z̃load) on the crystal surface:41
| 2 |
where f0 is the fundamental frequency of the unloaded crystal and Zq the acoustic shear wave impedance of the AT cut quartz. For a thin film in liquid, using the small load approximation and referencing the shifts to the unloadeda immersed crystal, the complex shift is given by41
| 3 |
where n is the overtone number, m a mass, ρ a mass density, J̃(ω) the complex compliance at the frequency ω = 2πnf, and η a viscosity. The subscript f represents the deposited film while l refers to the liquid.
The complex compliance of the film J̃f is defined as
| 4 |
where J′ and J″ are the frequency-dependent elastic and viscous compliances. The prefactor in eq 3 has the same form as the Sauerbrey equation (referenced to the bare crystal in liquid). Indeed, if the film has a zero viscoelastic compliance (a perfectly rigid film), the equation reduces to the Sauerbrey result. It can also be seen from eqs 3 and 4 that J′ affects the half-bandwidth Γ, while J″ affects the resonance frequency f.
Model Fitting
In principle, the above equations can be solved (using all overtones) to obtain the mass and viscoelastic properties; however, as the mass is not known a priori, this is not trivial. To reduce the number of fit parameters, we impose relations between the viscoelastic compliances at different frequencies. Because viscoelastic relaxation spectra inherently show a very gradual frequency dependence and the QCM-D probes only 1 decade in frequency, we can assume power law forms for both compliances. This approach is hardly restrictive and certainly preferable to overly simplistic models such as Kelvin–Voigt, which ignores the possibility that a material can have multiple relaxations. The power law compliances are given by
| 5a |
| 5b |
where the reference frequency is chosen close to the middle of the operating range (35 MHz). The viscoelastic exponents are determined by the spectral distance between the measurement frequency range and the layer material’s intrinsic relaxation frequencies. Assuming that no drastic changes in the material composition occur during the growth of the SEI layer, the exponents β′ and β″ can be considered as constant throughout the entire experiment. Because the elastic and viscous compliances are interrelated by the Kramers–Kronig relations, β′ must lie between −2 and 0 and β″ between −1 and 1.41,42
Making reasonable estimates for ρf, we are left with 5 unknown parameters (mf, J′ref, β′, J″ref, and β″) and 10 relations for 5 overtones. A method is now required to obtain reasonable initial guesses for these parameters to avoid trapping in local minima during fitting. A first estimate for mf is obtained by fitting the Sauerbrey equation (J̃f = 0) for all overtones. Using this value in the complex part of eq 3, we can directly calculate estimates for J′(ω) from the various half-bandwidth shifts and thus J′ref and β′. While it is tempting to use the same method to approximate J″(ω), this would give erroneous results since mf was already approximated from the frequency shifts. Instead, we first assume a constant (i.e., frequency independent) J″, estimated from the real part of eq 3 for the reference frequency. Using the above initial guesses, we systematically explore all combinations of viscoelastic exponents β′ and β″ while allowing mf, J′ref, and J″ref to vary as fit parameters.
In this scheme, the time-dependent properties of the layer are found by fitting mf, J′ref, and J″ref over the course of the entire experiment (i.e., voltage–time profile) while keeping β′ and β″ fixed. This fitting operation is performed for 100 different (β′, β″) combinations, as obtained by varying each exponent over the entire possible range, in steps of 0.2. The total mean-squared error (TMSE) of the fit is then mapped versus β′ and β″, after which the (β′, β″) combination that produces the minimum TMSE is chosen to obtain the time-dependent mf, J′ref, and J″ref signals. A detailed description of the model fitting along with a discussion of the uncertainty in the fitted parameters can be found in the Supporting Information.
We mention here that we use in fact a slightly modified version of eq 3—a third-order perturbation analysis41 equation that contains (small) corrections to deal with violations of the small load approximation. Frequency and half-bandwidth shifts that were large enough to necessitate this correction were mainly found in the last (i.e., fourth) stage of the experiment. The Supporting Information (section 1.1) contains a brief description of this equation. Also, the effects of SEI multilayers and roughness are briefly discussed in sections 1.5 and 1.6.
3. Results and Discussion
3.1. Measured QCM-D Signals and Model Fits
In Figure 2 the direct output signals from the QCM-D instrument, i.e., the frequency and half-bandwidth shifts, of the various overtones for the four different voltage regimes are shown (solid lines and circles). The current responses of the cyclic voltammograms are shown in Figure S9. The experiments on the different materials are grouped for comparison, as TiO2 is a good intercalation material while amorphous carbon is not.
Figure 2.

Applied cell potential (top), frequency shift (middle), and half-bandwidth shift (bottom) for TiO2 (left) and carbon (right) electrodes when cycled over four voltage windows of 25 cycles each. The various odd overtones (5–13) are shown in different colors. Both experimental data and model fits are shown as solid lines, where the half-bandwidth shifts have been Savitzky–Golay (SG) smoothed to reduce noise. To highlight the slow changes, markers have been added: (○) for experiments and (×) for fits. Note that the frequency shifts are in kHz, while it is Hz for the half-bandwidth shifts.
It is clear that for both materials, over time scales much longer than one CV cycle, the (kilohertz range) negative frequency shift gets progressively larger, with sudden changes in the slope at the points where a more reductive voltage regime is entered. The (hertz range) half-bandwidth shift also increases with time for most regimes—the only exception being the amorphous carbon in the most reductive regime. A noticeable difference between the TiO2 and the carbon is that the former material shows very clear oscillations in Δf and ΔΓ, in phase with the charge–discharge cycles (as we will see below).
Also shown in Figure 2 are model fits to the data. All frequency shift differences are below 50 Hz, and half-bandwidth shift differences are below 8 Hz (see Figures S2 and S3). The root-mean-squared fitting error was below 25 Hz for all overtones, which corresponds to a Sauerbrey mass “fitting error” of around 5 × 10⁻⁷ kg/m2. This error is of the same magnitude as the measurement noise. The goodness of fits and trends were not affected by small variations of the grid fit parameters (β′, β″). See Supporting Information section 1 for a discussion about the accuracy and robustness of the fitting.
3.2. Global Changes in Mass and Viscoelastic Compliance
Assuming that the shifts are due to a uniform viscoelastic layer and using the model described in section 2.5, we obtain the QCM areal mass density (mf) shown in Figure 3. Here mf is plotted along with a theoretical areal lithium mass density (me). The latter signal should be helpful in the detection of processes other than Li intercalation. To find me, we integrate the current and convert the obtained faradaic charge to an areal mass of lithium atoms. We henceforth refer to the areal mass as just the mass.
Figure 3.

me (red), mf (blue), J′(35 MHz) (orange), and J″(35 MHz) (purple) derived from the model in section 2.5 for the experiment in Figure 2. Dashed vertical lines highlight the cycles examined in Figure 4. Viscoelastic compliances have been SG smoothed and share the same scale for both experiments.
For both materials, mf and me are observed to grow irreversibly with time. In the first few cycles of the initial (i.e., least reductive) regime, the two signals are similar but well before the end of that regime, mf gets significantly larger than me, and the difference keeps growing. We emphasize here that a difference between the me and mf signals implies the (co)occurrence of process(es) that differ from Li intercalation. The irreversible mass increases, along with differences between the me and mf, thus indicate the formation of a solid–electrolyte interphase. The parallel occurrence of irreversible lithium intercalation cannot be excluded; the good correspondence between me and mf in the early stage suggests that this process does take place as well.
It is remarkable that for both the TiO2 and the carbon significant irreversible layer growth is found even in the least reducing voltage window of 1.5 V, well within the (for traditional Li batteries) accepted operating window of the electrolyte. Assuming a layer density of 1500 kg/m3, we find that the layers on both surfaces are already several nanometers thick after a few CV cycles. (The consequences of choosing a different layer density are discussed in Supporting Information section 1.4; there we show that mf remains essentially unaffected while J′ref and J″ref change but their trends do not.) By the end of the 25 cycles a thickness of ∼20 nm is reached. While such thin layers are of minimal consequence in solid lithium ion batteries, flow systems can be strongly affected by thin layers (especially if the latter are insulating). Electron conduction paths between current collectors and active particles generally involve a huge number of interparticle contacts. When the particles are very close (as in a gel network), conduction is governed either by fluctuation-induced tunneling or by the limiting intrinsic electronic conductivity of the separating medium.43,44 In the respective cases, there is an inverse exponential or inverse dependence of the conductivity on the insulating gap length. In traditional solid electrode systems, the interparticle contacts themselves are static. Therefore, most contacts are exposed to little electrolyte or protected by the binder. The overall electrode resistance is then only slightly affected by thin SEI. In SSFB systems, however, particle contacts are refreshed due to restructuring by flow. The incorporation of many of these thin insulating layers in the conduction path can thus have a dramatic effect on the electrode resistance.9
As a general trend, on continuing the cycling inside a given voltage window, the layer properties tend to saturate (i.e., the SEI growth rate tends to decrease). When a new, more reducing window is started, the growth rate generally increases again, presumably due to a greater potential drop over the pre-existing layer and/or the activation of new reactions. One exception can be found for the carbon sample, where the growth rate strongly decreases right at the beginning of the 0 V window. Here, the SEI layer is calculated to be around 100 nm thick, which is still well below the penetration depth (the maximum sensing depth) of the shear wave through it (∼900 nm at 65 MHz). The slowing down of the layer growth is thus real. This might be due to an almost complete passivation of the carbon electrode.
Figure 3 also shows the global variation of the elastic and viscous compliances, which are of comparable magnitude. In general, cycling at more reducing voltages diminishes both compliances, i.e., stiffens the layer. During the initial cycles when the layers are still very thin, the contribution of the compliance term to eq 3 is too small to resolve it with accuracy.
3.3. Changes per Voltage Cycle
The second cycle of each voltage window of the experiment in Figure 2 is plotted as a cyclic voltammogram in Figure 4. In addition to the current, also the changes in me and mf (referenced to the beginning of the cycle) are plotted. The signals corresponding to Δmf are relatively noisy, as the mass changes within each cycle are small and close to the noise limit (σ ≈ 5 × 10⁻⁷ kg m–2) of the QCM-D for this system.
Figure 4.

CVs with current (black ○) and change in me (red ×) and mf (blue ×) for the second cycle of each window (highlighted in Figure 3). In each cycle the potential vs Li/Li+ starts at 3.4 V and returns there after a clockwise trajectory in the I–V plot. Also, the m–V curves run clockwise. Left: TiO2. Right: carbon. For each sample the axis scales are kept the same to allow comparison.
In the TiO2 sample, both mass changes are largely reversible within a single cycle. Below ∼2.5 V the current starts to increase and consequently also me. mf closely follows the trend of me, suggesting that most of its growth is due to lithium intercalation. On the reverse half-cycle, the reduction in me is also closely followed by mf, again pointing at lithium (de)intercalation as the dominant process. At the end of the cycle there is a small overall positive growth in both the me and mf, in agreement with the trend over multiple cycles shown in Figure 3. This net effect per cycle is thus significant and is attributed to irreversible SEI growth, along with a possible contribution from irreversible intercalation. Of note is how close the values and trends of the changes of mf and me are, lending confidence to the accuracy of the analysis.
For the carbon sample, the currents and mass changes are significantly smaller than for TiO2, causing the mf signals to be even more noisy. The behavior is qualitatively different from TiO2: while both mf and me grow upon reducing the voltage, in the reverse part of the cycle only a slight decrease in me is seen while mf appears to remain constant (or even grow a little). This clearly suggests that the growth of mf is not determined by reversible lithium intercalation.
3.4. Changes per Charge–Discharge Cycle
So far, a cycle has referred to the cell starting at 3.4 V, going down to the low voltage boundary (1.5/1.0/0.5/0.0 V) and then back up to the initial voltage. However, in this potential based scheme, the growth or shrinkage of a layer is not complete at the end of a cycle (see Figure 5). The layer changes the least when the current is zero. We henceforth use every third current zero crossing to demarcate cycles.
Figure 5.

Top: typical cell graph of potential and current versus time (here for TiO2 in the most reductive voltage window; 340 s per cycle). The blue arrows indicate voltage-based cycles while the orange ones designate current-based cycles. Bottom: the change in me with the growth (red arrows) and shrinkage (green arrows).
We now look at the changes in the viscoelastic compliance and the mass during the second cycle of each window (Figure 6). Again, the changes are referenced to the beginning of the cycle. For the first voltage window, for both samples, the compliance signals are very noisy and difficult to extract, even though a change in mass is easily detected. This is because the layer is still extremely thin (∼2 nm).
Figure 6.

First column: plots of the change in me (red ○) and mf (blue ×). Second column: the viscoelastic compliances J′(35 MHz) (orange) and J″(35 MHz) (purple) versus time for the second cycle of each voltage window of the experiment in Figure 2. For the compliances both the raw (light thin lines) and SG smoothed (dark thick lines) data are shown. Left: TiO2. Right: carbon.
For the subsequent voltage widows, the TiO2 sample shows a noticeable change in the elastic compliance J′ when the mass changes. When lithium is intercalated into a host, it can change the structure and consequently the mechanical properties of the latter. Lithium intercalation is known to decrease the compliance of metal oxides and layered materials, while it increases the compliance of materials it alloys with.45 The changes in the elastic compliance may thus be related to lithium intercalation. At the end of the cycles for TiO2, the elastic compliance almost returns to its original value after deintercalation. However, the recovery is not full. This can be seen from the general reduction of the elastic compliance as cycling is continued (see Figure 3).
We add here that for the TiO2 sample the raw data show a strong change in the half-bandwidth shift (which is directly proportional to the layer’s elastic compliance and mass; see eq 3) in the two distinct stages of the charge–discharge cycle. Here the bandwidth shift decreases despite the layer mass increasing, and vice versa. Thus, the trend in the compliance is not a spurious fitting effect induced by the changing layer mass.
A second observation for the TiO2 sample is that Δmf is not precisely equal to Δme, as would be expected for a perfectly reversible lithium intercalation. In particular, the amplitude of Δme per half-cycle is somewhat larger than Δmf, and the same for the “reversible mass change” (Δmmax – Δmfinal) per cycle. The meaning hereof it is not precisely clear. Assuming that the fitted mf accurately represents the real mass, some reversible side reaction would be implied—electron transfer without mass deposition on the QCM electrode.
For the carbon sample, despite significant mass changes, the changes in compliance are only minor (while still leading to a small overall decrease per cycle; see Figure 3). Lithium insertion in layered carbons is expected to have a much stronger effect on the compliance than that in metal oxides. Our findings thus imply that the mass change of the carbon layer is mainly due to SEI growth and not irreversible lithium insertion.
3.5. Correlation between Changes in Mass and Compliance
We extend our analysis of the charge–discharge cycles by correlating the net changes in mf, me, and J′(35 MHz) per half-cycle. Defining the cycles as in Figure 5, Δme will inherently be positive in the first half-cycle and negative in the second one. Accordingly, we define the first half-cycle as “growth” and the second one as “shrinkage” (which thus refers strictly to me). To facilitate comparison of the magnitudes, we take the negative of Δme in the shrinkage regime and denote it as Δsme. For notational consistency, Δme in the growth regime is just replaced with Δgme. Similar definitions are applied to Δmf and ΔJ′. It is noted here that mf does not have to change in the same direction as me; one case was encountered where mf increased during “shrinkage”. This was however an exception. For the far majority of our data, the diagnosis becomes more straightforward with these definitions. For example, comparisons between Δgmf and Δsmf (of the same cycle) allow examination of the reversibility of mass deposition, while differences between Δgme and Δsme indicate irreversible electron transfer.
Figure 7 shows the (half-cycle) changes in mf, me, and J′ for the entire experiment, for TiO2 (left panel) and carbon (right panel). Important differences between the two materials become immediately evident. For the TiO2 sample, Δme is similar to the total mass change, for nearly all half-cycles and irrespective of the (growth or shrinkage) stage. In fact, the magnitude of Δme is even somewhat larger than that of Δmf (as already noted above). The near equality of Δgme and Δsme indicates a high degree of reversibility, which would also be expected for lithium intercalation. The changes in mf are largely reversible as well, albeit less so than for me (this causes the overall mf to grow over me as seen in Figure 3). Looking at the elastic compliance J′, a strong anticorrelation with both me and mf is observed. This corroborates lithium intercalation.
Figure 7.

Cycle by cycle growth (red) and shrinkage (green) of (top) mf (×) and me (○) and (bottom) J′(35 MHz) for TiO2 (left) and carbon (right). J′ data are omitted for the first four cycles for both experiments. Note that the vertical scales for the carbon sample are much smaller than for TiO2.
For the carbon sample the mass changes are significantly smaller than for the TiO2. Here the Δme signals are generally smaller than Δmf (except for the most reductive voltage window where Δmf has become very small), indicating the occurrence of other processes than Li intercalation. The changes in mf are less reversible (compared to me) also for this material. Meanwhile, the changes in elastic compliance fluctuate randomly. The mf and mfe growths are weakly correlated while the shrinkages are not. These correlations (further illustrated in Figure S10) indicate (more clearly now) that the majority of the mass changes in the carbon sample are due to irreversible SEI formation in the growth stage (Δme > 0).
3.6. Cycling of Carbon Directly to 0 V
We continue our study of the carbon system in PC with 1 M LiPF6 by cycling directly over the entire voltage range as done in traditional lithium battery systems: between 3.4 and 0 V. This corresponds to the fourth voltage window in the previous experiment, but with a different electrochemical history since we now start with pristine carbon (not yet covered by SEI).
Figure 8 shows the masses and viscoelastic compliances extracted from the QCM-D and current measurements, similar to Figure 3. During the initial cycles, there is significantly larger (approximately an order of magnitude) SEI growth per cycle as compared to cycling the pristine carbon in a 1.5 V voltage window (Figure 3). Again, the gradual mass changes are much stronger for mf than for me, while this time there is almost no reversibility in mf within the cycle. As the cycling is continued, the layer growth slows down while approaching a slightly larger thickness as compared to Figure 3. The elastic compliance is very similar to that in Figure 3, while the viscous compliance is higher now; this could indicate slight differences in the structure of the SEI formed in different voltage regimes. Importantly, cycling to strongly reducing voltages thus leads to quicker formation of an irreversible thick SEI, which is potentially catastrophic to flow systems.
Figure 8.
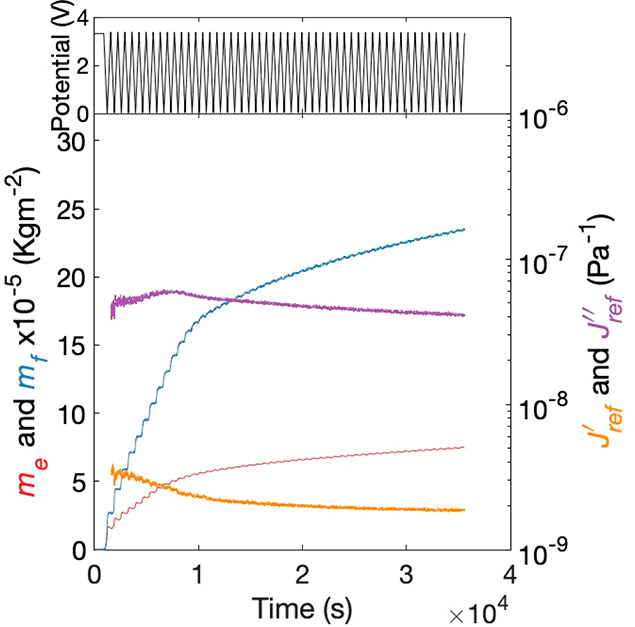
Carbon layer cycled to 0 V for 50 cycles. Top: applied cell potential. Bottom: me (pink), mf (blue), J′(35 MHz) (orange), and J″(35 MHz) (purple) versus time.
3.7. Cycling of Carbon in EC:DMC Electrolyte
In Figure 9 we examine the behavior of the carbon layer in a different electrolyte: EC-DMC with 1 M LiPF6, subsequently exploring two voltage windows: 3.4–1.5 and 3.4–0 V. Though the growth in me is similar to that in Figure 3, the growth in mf is much larger. Thus, more SEI mass per unit charge is deposited in EC-DMC as compared to PC. In addition, the viscoelastic compliances are much higher (along with the half-bandwidth shift). Because of the latter, the QCM-D was unable to track the experiment beyond the 49th cycle. Assuming a similar mass density, the layer is around 15 nm thick after just the first cycle and grows to over 200 nm at the end of the experiment. The partial reversibility in mf per cycle, evidenced by temporary mass decreases, largely disappears already after the first few cycles. Thus, in EC:DMC a permanent, “fluffier” and heavier SEI than that in PC is formed at the same voltages. Such a layer, if insulating, would almost completely block electron transfer in a flow system. We note here that due to the much higher layer compliance; the model fits and outputs are very sensitive to the viscoelastic parameter choices unlike the previous experiments.
Figure 9.

Carbon layer in EC DMC 1 M LiPF6 cycled over two voltage windows. Top: applied cell potential. Bottom: me (pink), me (blue), J′(35 MHz) (orange), and J″(35 MHz) (purple) versus time.
4. Conclusions
Using the sensitive eQCM-D, we have shown the formation of surface layers on carbon and TiO2 surfaces (that emulate fluid electrode particles) in an alkyl carbonate solvent with dissolved LiPF6 during electrochemical cycling. Applying increasingly reductive potentials, the same gradual evolutions are observed for TiO2 and carbon: an irreversible growth in deposited mass and the formation of a viscoelastic layer. Focusing on the changes within individual charge–discharge cycles reveals additional information. For TiO2 the mass changes per cycle are dominated by reversible Li intercalation, but the net effect of the cycle is a systematic mass growth, attributed to SEI. Also for carbon a systematic mass growth is observed, but without clear indications for reversible intercalation. Correlating the changes in the mass and elastic compliance per cycle, we find a strong anticorrelation for TiO2 and a lack of correlation for carbon. This underlines that while both intercalation and SEI growth lead to mass deposition, the former reduces the elastic compliance while the latter does not.
Our finding that even when cycling to 1.5 V vs lithium (a voltage considered to be within the operating window of most alkyl carbonate electrolytes) surface layers tens of nanometers thick form is of significance for slurry-based electrodes, whose performance can be destroyed by thin insulating layers. Operating at less conservative voltages results in an even more SEI layer formation and layer thicknesses up to O(100 nm). Our observations thus highlight the need for careful screening of systems for fluid electrode technologies, as they can be affected by SEI in operating regimes traditionally considered free of it.
Acknowledgments
The research leading to these results has received funding from the European Union Seventh Framework Programme (FP7/2007-2013) under grant agreement no. 608621. We thank Ing. Daniel Wijnperlé for preparation of the coated samples and Sachin Nair and Harry A. Bakker for characterizations with CRM and XRD, respectively.
Supporting Information Available
The Supporting Information is available free of charge at https://pubs.acs.org/doi/10.1021/acsaem.9b02233.
Accuracy and robustness of the viscoelastic modeling: (a) third-order perturbation analysis, (b) quality of overall fit as a function of viscoelastic exponents, (c) fitted mass and compliances as a function of viscoelastic exponents, (d) fitted mass and compliances as a function of estimated layer density, (e) effect of multilayers, and (f) effect of roughness; other graphs: (i) confocal Raman microscopy of carbon layer, (ii) X-ray diffraction of carbon layer, (iii) cyclic voltammograms, and (iv) correlation plots for the shrinkage and growth of mass and elastic compliance (PDF)
The authors declare no competing financial interest.
Footnotes
Sputtered layers are considered as part of the “unloaded” crystal since the acoustic wave impedances of the sputtered layers are close to quartz as compared to layers deposited during the experiment.
Supplementary Material
References
- Hatzell K. B.; Boota M.; Gogotsi Y. Materials for suspension (semi-solid) electrodes for energy and water technologies. Chem. Soc. Rev. 2015, 44 (23), 8664–8687. 10.1039/C5CS00279F. [DOI] [PubMed] [Google Scholar]
- Duduta M.; Ho B.; Wood V. C.; Limthongkul P.; Brunini V. E.; Carter W. C.; Chiang Y. M. Semi-Solid Lithium Rechargeable Flow Battery. Adv. Energy Mater. 2011, 1 (4), 511–516. 10.1002/aenm.201100152. [DOI] [Google Scholar]
- Lacroix R.; Biendicho J. J.; Mulder G.; Sanz L.; Flox C.; Morante J. R.; Da Silva S. Modelling the rheology and electrochemical performance of Li4Ti5O12 and LiNi1/3Co1/3Mn1/3O2 based suspensions for semi-solid flow batteries. Electrochim. Acta 2019, 304, 146–157. 10.1016/j.electacta.2019.02.107. [DOI] [Google Scholar]
- Richards J. J.; Scherbarth A. D.; Wagner N. J.; Butler P. D. Mixed Ionic/Electronic Conducting Surface Layers Adsorbed on Colloidal Silica for Flow Battery Applications. ACS Appl. Mater. Interfaces 2016, 8 (36), 24089–24096. 10.1021/acsami.6b07372. [DOI] [PubMed] [Google Scholar]
- Poli F.; De Giorgio F.; Soavi F. Flowable Semi-Solid Electrodes with Superconcentrated Electrolytes: An Electrochemical Impedance Study. Meeting Abstracts. The Electrochemical Society. 2019, 3, 173–173. [Google Scholar]
- Shukla G.; Franco A. A. Interphases in Electroactive Suspension Systems: Where Chemistry Meets Mesoscale Physics. Batteries & Supercaps 2019, 2 (7), 579–590. 10.1002/batt.201800152. [DOI] [Google Scholar]
- Zhang Y.; Narayanan A.; Mugele F.; Cohen Stuart M. A.; Duits M. H.G. Charge inversion and colloidal stability of carbon black in battery electrolyte solutions. Colloids Surf., A 2016, 489, 461–468. 10.1016/j.colsurfa.2015.08.041. [DOI] [Google Scholar]
- Narayanan A.; Mugele F.; Duits M. H. G. Mechanical History Dependence in Carbon Black Suspensions for Flow Batteries: A Rheo-lmpedance Study. Langmuir 2017, 33 (7), 1629–1638. 10.1021/acs.langmuir.6b04322. [DOI] [PMC free article] [PubMed] [Google Scholar]
- Narayanan A.; Wijnperle D.; Mugele F.; Buchholz D.; Vaalma C.; Dou X.; Passerini S.; Duits M.H. G. Influence of electrochemical cycling on the rheo-impedance of anolytes for Li-based Semi Solid Flow Batteries. Electrochim. Acta 2017, 251, 388–395. 10.1016/j.electacta.2017.08.022. [DOI] [Google Scholar]
- Narayanan A.; Mugele F.; Duits M. H. G. Device for rheometry, impedance spectroscopy, and electrochemistry on fluid electrodes. Rev. Sci. Instrum. 2019, 90 (2), 025112. 10.1063/1.5031126. [DOI] [PubMed] [Google Scholar]
- Peled E.; Menkin S. SEI: past, present and future. J. Electrochem. Soc. 2017, 164 (7), A1703–A1719. 10.1149/2.1441707jes. [DOI] [Google Scholar]
- An S. J.; Li J. L.; Daniel C.; Mohanty D.; Nagpure S.; Wood D. L. The state of understanding of the lithium-ion-battery graphite solid electrolyte interphase (SEI) and its relationship to formation cycling. Carbon 2016, 105, 52–76. 10.1016/j.carbon.2016.04.008. [DOI] [Google Scholar]
- Verma P.; Maire P.; Novak P. A review of the features and analyses of the solid electrolyte interphase in Li-ion batteries. Electrochim. Acta 2010, 55 (22), 6332–6341. 10.1016/j.electacta.2010.05.072. [DOI] [Google Scholar]
- Kumar H.; Detsi E.; Abraham D. P.; Shenoy V. B. Fundamental Mechanisms of Solvent Decomposition Involved in Solid-Electrolyte Interphase Formation in Sodium Ion Batteries. Chem. Mater. 2016, 28 (24), 8930–8941. 10.1021/acs.chemmater.6b03403. [DOI] [Google Scholar]
- Ventosa E.; Zampardi G.; Flox C.; La Mantia F.; Schuhmann W.; Morante J. R. Solid electrolyte interphase in semi-solid flow batteries: a wolf in sheep’s clothing. Chem. Commun. 2015, 51 (81), 14973–14976. 10.1039/C5CC04767F. [DOI] [PubMed] [Google Scholar]
- Ventosa E.; Madej E.; Zampardi G.; Mei B.; Weide P.; Antoni H.; La Mantia F.; Muhler M.; Schuhmann W. Solid electrolyte interphase (SEI) at TiO2 electrodes in Li-Ion batteries: defining apparent and effective SEI based on evidence from X-ray photoemission spectroscopy and scanning electrochemical microscopy. ACS Appl. Mater. Interfaces 2017, 9 (3), 3123–3130. 10.1021/acsami.6b13306. [DOI] [PubMed] [Google Scholar]
- Peled E. the electrochemical-behavior of alkali and alkaline-earth metals in non- aqueous battery systems - the solid electrolyte interphase model. J. Electrochem. Soc. 1979, 126 (12), 2047–2051. 10.1149/1.2128859. [DOI] [Google Scholar]
- Liu T.; Lin L.; Bi X.; Tian L.; Yang K.; Liu J.; Li M.; Chen Z.; Lu J.; Amine K.; Xu K.; Pan F. In situ quantification of interphasial chemistry in Li-ion battery. Nat. Nanotechnol. 2019, 14 (1), 50. 10.1038/s41565-018-0284-y. [DOI] [PubMed] [Google Scholar]
- Bhattacharya S.; Alpas A. T. Micromechanisms of solid electrolyte interphase formation on electrochemically cycled graphite electrodes in lithium-ion cells. Carbon 2012, 50 (15), 5359–5371. 10.1016/j.carbon.2012.07.009. [DOI] [Google Scholar]
- Nie M. Y.; Abraham D. P.; Chen Y. J.; Bose A.; Lucht B. L. Silicon Solid Electrolyte Interphase (SEI) of Lithium Ion Battery Characterized by Microscopy and Spectroscopy. J. Phys. Chem. C 2013, 117 (26), 13403–13412. 10.1021/jp404155y. [DOI] [Google Scholar]
- Nie M. Y.; Chalasani D.; Abraham D. P.; Chen Y. J.; Bose A.; Lucht B. L. Lithium Ion Battery Graphite Solid Electrolyte Interphase Revealed by Microscopy and Spectroscopy. J. Phys. Chem. C 2013, 117 (3), 1257–1267. 10.1021/jp3118055. [DOI] [Google Scholar]
- Lu P.; Li C.; Schneider E. W.; Harris S. J. Chemistry, Impedance, and Morphology Evolution in Solid Electrolyte Interphase Films during Formation in Lithium Ion Batteries. J. Phys. Chem. C 2014, 118 (2), 896–903. 10.1021/jp4111019. [DOI] [Google Scholar]
- Yang Z.; Ingram B. J.; Trahey L. Interfacial Studies of Li-Ion Battery Cathodes Using In Situ Electrochemical Quartz Microbalance with Dissipation. J. Electrochem. Soc. 2014, 161 (6), A1127–A1131. 10.1149/2.101406jes. [DOI] [Google Scholar]
- Wang S. W.; Yang K.; Gao F.; Wang D. Y.; Shen C. Direct visualization of solid electrolyte interphase on Li4Ti5O12 by in situ AFM. RSC Adv. 2016, 6 (81), 77105–77110. 10.1039/C6RA16208H. [DOI] [Google Scholar]
- Singh K.; Blanford C. F. Electrochemical Quartz Crystal Microbalance with Dissipation Monitoring: A Technique to Optimize Enzyme Use in Bioelectrocatalysis. ChemCatChem 2014, 6 (4), 921–929. 10.1002/cctc.201300900. [DOI] [Google Scholar]
- Sigalov S.; Shpigel N.; Levi M. D.; Feldberg M.; Daikhin L.; Aurbach D. Electrochemical Quartz Crystal Microbalance with Dissipation Real-Time Hydrodynamic Spectroscopy of Porous Solids in Contact with Liquids. Anal. Chem. 2016, 88 (20), 10151–10157. 10.1021/acs.analchem.6b02684. [DOI] [PubMed] [Google Scholar]
- Buttry D. A.; Ward M. D. measurement of interfacial processes at electrode surfaces with the electrochemical quartz crystal microbalance. Chem. Rev. 1992, 92 (6), 1355–1379. 10.1021/cr00014a006. [DOI] [Google Scholar]
- Aurbach D.; Zaban A. the application of eqcm to the study of the electrochemical-behavior of propylene carbonate solutions. J. Electroanal. Chem. 1995, 393 (1–2), 43–53. 10.1016/0022-0728(95)04014-F. [DOI] [Google Scholar]
- Rodahl M.; Kasemo B. A simple setup to simultaneously measure the resonant frequency and the absolute dissipation factor of a quartz crystal microbalance. Rev. Sci. Instrum. 1996, 67 (9), 3238–3241. 10.1063/1.1147494. [DOI] [Google Scholar]
- Rodahl M.; Hook F.; Krozer A.; Brzezinski P.; Kasemo B. Quartz-crystal microbalance setup for frequency and q-factor measurements in gaseous and liquid environments. Rev. Sci. Instrum. 1995, 66 (7), 3924. 10.1063/1.1145396. [DOI] [Google Scholar]
- Shpigel N.; Levi M. D.; Sigalov S.; Daikhin L.; Aurbach D. In Situ Real-Time Mechanical and Morphological Characterization of Electrodes for Electrochemical Energy Storage and Conversion by Electrochemical Quartz Crystal Microbalance with Dissipation Monitoring. Acc. Chem. Res. 2018, 51 (1), 69–79. 10.1021/acs.accounts.7b00477. [DOI] [PubMed] [Google Scholar]
- Dargel V.; Shpigel N.; Sigalov S.; Nayak P.; Levi M. D.; Daikhin L.; Aurbach D. In situ real-time gravimetric and viscoelastic probing of surface films formation on lithium batteries electrodes. Nat. Commun. 2017, 10.1038/s41467-017-01722-x. [DOI] [PMC free article] [PubMed] [Google Scholar]
- Kitz P. G.; Lacey M. J.; Novak P.; Berg E. J. Operando EQCM-D with Simultaneous in Situ EIS: New Insights into Interphase Formation in Li Ion Batteries. Anal. Chem. 2019, 91 (3), 2296–2303. 10.1021/acs.analchem.8b04924. [DOI] [PubMed] [Google Scholar]
- Zampardi G.; Ventosa E.; La Mantia F.; Schuhmann W. In situ visualization of Li-ion intercalation and formation of the solid electrolyte interphase on TiO2 based paste electrodes using scanning electrochemical microscopy. Chem. Commun. 2013, 49 (81), 9347–9349. 10.1039/c3cc44576c. [DOI] [PubMed] [Google Scholar]
- Bresser D.; Paillard E.; Binetti E.; Krueger S.; Striccoli M.; Winter M.; Passerini S. Percolating networks of TiO2 nanorods and carbon for high power lithium insertion electrodes. J. Power Sources 2012, 206, 301–309. 10.1016/j.jpowsour.2011.12.051. [DOI] [Google Scholar]
- Zhang S. S.; Ding M. S.; Xu K.; Allen J.; Jow T. R. Understanding solid electrolyte interface film formation on graphite electrodes. Electrochem. Solid-State Lett. 2001, 4 (12), A206–A208. 10.1149/1.1414946. [DOI] [Google Scholar]
- Buqa H.; Blyth R. I. R.; Golob P.; Evers B.; Schneider I.; Santis Alvarez M. V.; Hofer F.; Netzer F. P.; Ramsey M. G.; Winter M.; Besenhard J. O. Negative Electrodes in Rechargeable Lithium Ion Batteries - Influence of Graphite Surface Modification on the Formation of the Solid Electrolyte Interphase. Ionics 2000, 6 (3–4), 172–179. 10.1007/BF02374063. [DOI] [Google Scholar]
- Scott M. G.; Whitehead A. H.; Owen J. R. Chemical formation of a solid electrolyte interface on the carbon electrode of a Li-Ion cell. J. Electrochem. Soc. 1998, 145 (5), 1506–1510. 10.1149/1.1838511. [DOI] [Google Scholar]
- Chusid O.; Ely Y. E.; Aurbach D.; Babai M.; Carmeli Y. electrochemical and spectroscopic studies of carbon electrodes in lithium battery electrolyte systems. J. Power Sources 1993, 43 (1–3), 47–64. 10.1016/0378-7753(93)80101-T. [DOI] [Google Scholar]
- Rafieian D.; Ogieglo W.; Savenije T.; Lammertink R. G. H. Controlled formation of anatase and rutile TiO2 thin films by reactive magnetron sputtering. AIP Adv. 2015, 5 (9), 097168. 10.1063/1.4931925. [DOI] [Google Scholar]
- Johannsmann D.The quartz crystal microbalance in soft matter research. Fundamentals and Modeling; Springer International Publishing: Switzerland, 2015. [Google Scholar]
- Tschoegl N. W.The Phenomenological Theory of Linear Viscoelastic Behavior: An Introduction; Springer Science & Business Media: 2012. [Google Scholar]
- Sichel E. K.; Gittleman J. I.; Sheng P. transport properties of the composite-material carbon-poly(vinyl chloride). Phys. Rev. B: Condens. Matter Mater. Phys. 1978, 18 (10), 5712–5716. 10.1103/PhysRevB.18.5712. [DOI] [Google Scholar]
- Sherman R. D.; Middleman L. M.; Jacobs S. M. electron-transport processes in conductor-filled polymers. Polym. Eng. Sci. 1983, 23 (1), 36–46. 10.1002/pen.760230109. [DOI] [Google Scholar]
- Qi Y.; Hector L. G.; James C.; Kim K. J. Lithium Concentration Dependent Elastic Properties of Battery Electrode Materials from First Principles Calculations. J. Electrochem. Soc. 2014, 161 (11), F3010–F3018. 10.1149/2.0031411jes. [DOI] [Google Scholar]
Associated Data
This section collects any data citations, data availability statements, or supplementary materials included in this article.