Abstract
The TAFRO clinical subtype of idiopathic multicentric Castleman disease (iMCD-TAFRO) is a rare hematologic illness involving episodic disease flares of thrombocytopenia, anasarca, fever, reticulin myelofibrosis, renal dysfunction, and organomegaly (TAFRO) and progressive multiple organ dysfunction. We previously showed that the mTOR signaling pathway is elevated in lymph nodes of iMCD-TAFRO patients and that an mTOR inhibitor is effective in a small cohort of patients. However, the upstream mechanisms, cell types, and mediators involved in disease pathogenesis remain unknown. Here, we developed a targeted approach to identify candidate cellular drivers and mechanisms in iMCD-TAFRO through cellular and transcriptomic studies. Using paired iMCD-TAFRO PBMC samples collected during flare and remission, we identified T cell activation and alterations in NK cell and monocyte subset frequencies during iMCD-TAFRO flare. These changes were associated with increased Type I IFN (IFN-I) response gene signatures across CD8+ T cells, NK cells, and monocytes. Finally, we found that IFN-β stimulation of monocytes and T cells from iMCD-TAFRO patient remission samples induced increased mTOR activation compared with healthy donors, and this was abrogated with either mTORC1 or JAK1/2 inhibition. The data presented here support a potentially novel role for IFN-I signaling as a driver of increased mTOR signaling in iMCD-TAFRO.
Keywords: Hematology, Immunology
Keywords: Cellular immune response, Cytokines, T cells
Introduction
The TAFRO clinical subtype of idiopathic multicentric Castleman disease (iMCD-TAFRO) is a rare hematologic illness characterized by episodic disease flares of systemic inflammation and multiple organ system dysfunction (1–3). A constellation of characteristic histopathological features is observed in enlarged lymph nodes and historically classified into hyaline vascular/hypervascular, plasmacytic, and mixed histopathological subtypes. An IL-6–mediated cytokine storm is thought to drive disease pathogenesis in some patients (4, 5); however, only 34% of patients responded to anti–IL-6 therapy with siltuximab in the phase II trial (6). In addition, recent work has led to further classification of iMCD into 2 distinct subsets: the thrombocytopenia, anasarca, fever/elevated C-reactive protein (CRP), reticulin myelofibrosis, renal dysfunction, and organomegaly (iMCD-TAFRO) clinical subtype and iMCD–not otherwise specified (iMCD-NOS) subtype characterized by thrombocytosis, milder clinical features, and hypergammaglobulinemia (7–11). iMCD-TAFRO patients are more often acutely ill, and clinical features appear more clinically homogeneous compared with iMCD-NOS, making iMCD-TAFRO a more suitable subtype for study (7–12). IL-6 blockade with high-dose steroids is the recommended first-line treatment for severe iMCD-TAFRO cases. Combination chemotherapy is recommended for second-line treatment if there is progressive organ dysfunction, but it is variably effective and difficult to tolerate, highlighting an unmet need for additional targeted therapies (13).
The identification of novel therapeutics for iMCD-TAFRO patients has been challenging, as the etiology, pathological cell types, and signaling pathways involved in iMCD-TAFRO are largely unknown. While a number of immune cell subsets have been implicated in related systemic inflammatory diseases, such as circulating plasma cells in systemic lupus erythematosus (SLE) (14) and CD4–CD8– T cells in autoimmune lymphoproliferative syndrome (ALPS) (15), similar associations have not been identified in iMCD-TAFRO. A great deal of work also remains to identify underlying alterations in signaling pathways or transcriptional programs that may contribute to iMCD-TAFRO pathogenesis. We recently identified increased mTOR signaling in lymph node tissue of iMCD-TAFRO patients; however, the upstream mechanisms responsible for increased mTOR activation remain unknown (16). Notably, inhibition of mTOR signaling in 3 patients had significant clinical benefits (17), highlighting the clinical importance of elucidating the mechanisms underlying iMCD-TAFRO pathogenesis.
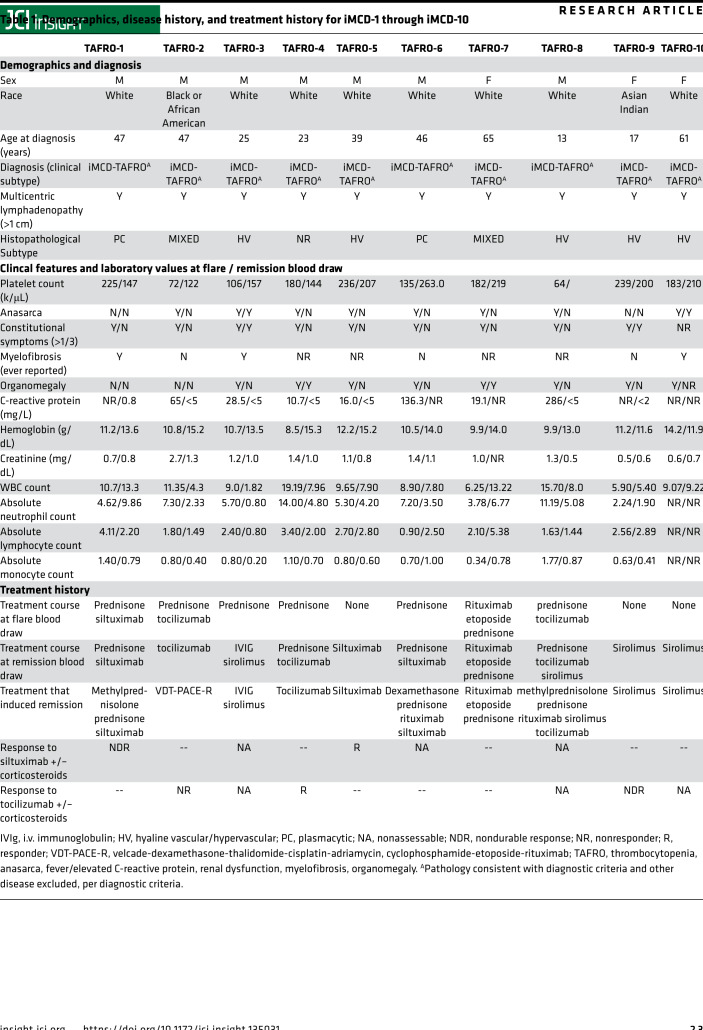
Here, we used an unbiased approach to examine potential candidate cellular drivers and pathophysiological mechanisms in iMCD-TAFRO. We leveraged paired patient samples (n = 10) obtained during disease flare and after treatment-induced resolution of flare (remission) to define potential cellular and molecular drivers of iMCD-TAFRO disease pathogenesis (Table 1 and Supplemental Figure 1; supplemental material available online with this article; https://doi.org/10.1172/jci.insight.135031DS1). Importantly, both iMCD-TAFRO patients who have responded and who have failed to respond to IL-6 blockade were included in this study, so the therapeutic implications of this work may be relevant for both IL-6 blockade responders and nonresponders. This longitudinal approach allowed us to interrogate changes in immune cell number, relative frequency, and phenotype at the patient level as opposed to a populationwise cross-sectional comparison. Three paired iMCD-TAFRO flare and remission samples were also selected for deep transcriptional profiling using single-cell RNA sequencing (scRNAseq). Our results define the immunophenotypic and quantitative changes in circulating T cells, NK cells, and monocytes during disease flare and identify the type I IFN (IFN-I) response as a common gene signature upregulated during iMCD-TAFRO flare. Moreover, we find a positive correlation between the IFN-I response genes and mTOR gene signature in classical monocytes, as well as increased mTOR activation upon in vitro stimulation with IFN-I, which can be abrogated with either mTORC1 or JAK1/2 inhibition. These data support a mechanism whereby IFN-I signaling may contribute to iMCD-TAFRO pathogenesis through increased JAK-dependent mTOR activation.
Table 1. Demographics, disease history, and treatment history for iMCD-1 through iMCD-10.
Results
Alterations in immune cell subsets between iMCD-TAFRO flare, iMCD-TAFRO remission, and healthy donors.
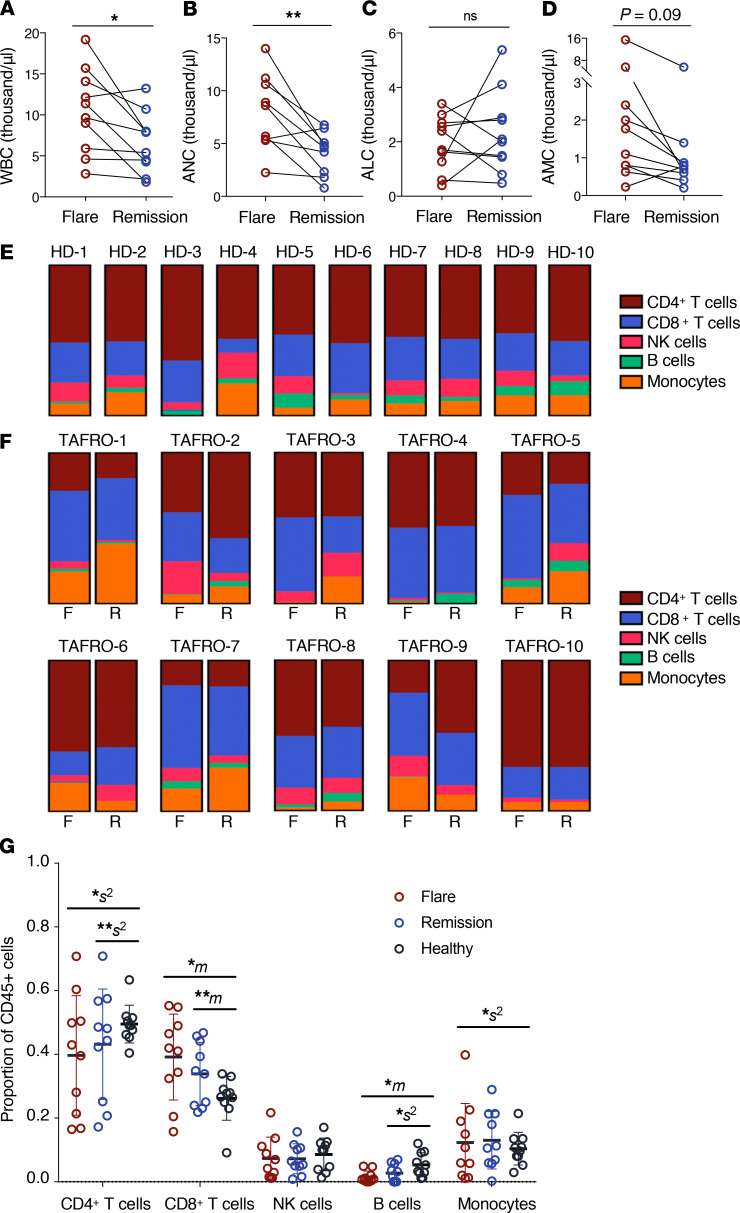
To uncover the immune cell subsets and transcriptional programs contributing to iMCD-TAFRO pathogenesis, we compared circulating immune cell populations between iMCD-TAFRO flare and remission (Table 1). Complete blood counts during flare showed a significant increase in the WBC count compared with remission (Figure 1A). We observed significantly elevated absolute neutrophil counts (ANC) and absolute monocyte counts (AMC) in flare compared with remission, but we observed no difference in absolute lymphocyte count (ALC) (Figure 1, B–D).
Figure 1. Altered number and relative frequency of circulating immune cell subsets during iMCD-TAFRO flare.
(A–C) Clinical blood counts as identified in whole blood at time of remission and flare blood draw (n = 9–10). (A) White blood cell (WBC) count representing PBMCs and neutrophils across paired remission and flare samples (P = 0.0165). (B) Absolute neutrophil count (ANC) in whole blood (P = 0.0069). (C) Absolute lymphocyte count (ALC) in whole blood (P = 0.4785). (D) Absolute monocyte count (AMC) in whole blood (P = 0.0939). (E–F) Relative percent composition of CD4+ T cells, CD8+ T cells, NK cells, B cells, and monocytes across healthy donors (n = 10) (E) and iMCD-TAFRO patients (n = 10) (F), with relative percent composition from flare (on left) and remission (on right) measured by flow cytometry. (G) Cellular composition of major immune cell types by flow cytometry. P values are based on paired 2-tailed t tests between remission and flare samples and unpaired 2-tailed t tests between healthy donor and flare. Proportion of cells were analyzed using compositional analysis (centrometric log-ratio transformation) with Welch t tests for the means (m) and Brown-Forsythe tests for the variance (s2). Data are mean ± SEM. *P < 0.05; **P < 0.01. Bonferroni’s multiple-hypotheses correction was applied to the comparisons for 3 groups, each testing for means and variances (6 independent hypotheses). P values were, therefore, adjusted by multiplication by 6; a correction was not applied for testing across 5 proportions, since these are interdependent and transformed before the statistical test.
We further investigated potential alterations in CD4+ and CD8+ T cells, NK cells, B cells, and monocytes in iMCD-TAFRO by flow cytometry (Supplemental Figure 2). The relative composition of these immune cell subsets was highly variable across iMCD-TAFRO patient samples compared with healthy donors (Figure 1, E and F), which has been observed in other systemic inflammatory diseases (18). We found that the degree of variation (s2) in the relative frequency of both CD4+ T cells and monocytes was significantly greater across both flare and remission samples when compared with healthy donor samples (Figure 1G). In addition, we observed significant increases in the mean (m) relative frequency of CD8+ T cells and B cells during iMCD-TAFRO flare and remission compared with healthy donors (Figure 1G). However, 2 iMCD-TAFRO patients were treated with the B cell–depleting agent rituximab during flare, and as a result, we did not further characterize B cells in this study.
Activated CD8+ and CD4+ T cells and alterations in monocyte and NK cell subsets during iMCD-TAFRO flare.
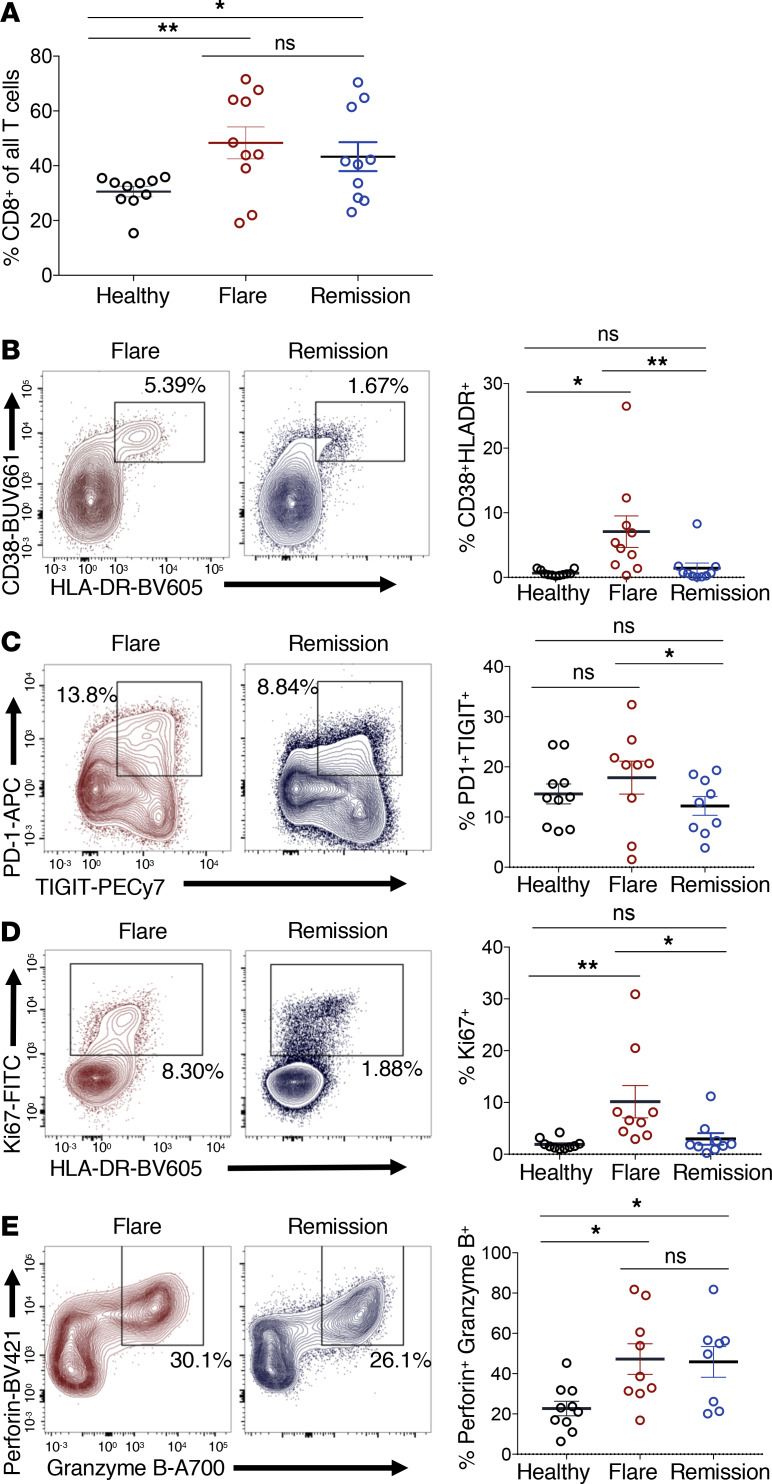
Using multicolor flow cytometry, we further examined changes in cellular subsets during iMCD-TAFRO flare compared with remission and healthy donors. CD8+ T cells represented a greater fraction of all CD3+ T cells in iMCD-TAFRO patients compared with healthy donors but did not differ between flare and remission within iMCD-TAFRO patients (Figure 2A). This elevation in relative frequency may represent increased survival and/or an expansion of CD8+ T cells in iMCD-TAFRO patients or, alternatively, may result from decreased survival and/or trafficking of other T cell populations out of circulation.
Figure 2. Circulating CD8+ T cells are more activated during flare when compared with remission and healthy donors.
(A) Identification of CD8+ T cells (previously gated as singlets, live, CD45+, CD3+) and subsequent gating of nonnaive CD8+ T cells lacking coexpression of CD45RA and CCR7. (B–D) Flow cytometric analyses of healthy donor (n = 10), iMCD-TAFRO flare (n = 9), and iMCD-TAFRO remission (n = 9) nonnaive CD8+ T cells with representative plots gating CD38+HLA-DR+ (B), PD-1+TIGIT+ (C), Ki67+ (D), and perforin+granzymeB+ CD8+ T cells (E) in flare and remission and comparison of frequencies across remission versus flare and healthy donor (HD) versus flare. Data are mean ± SEM. P values are based on paired 2-tailed t tests between remission and flare samples and unpaired 2-tailed t tests between healthy donor and flare with a Bonferroni’s correction for multiple comparisons. *P < 0.05; **P < 0.01.
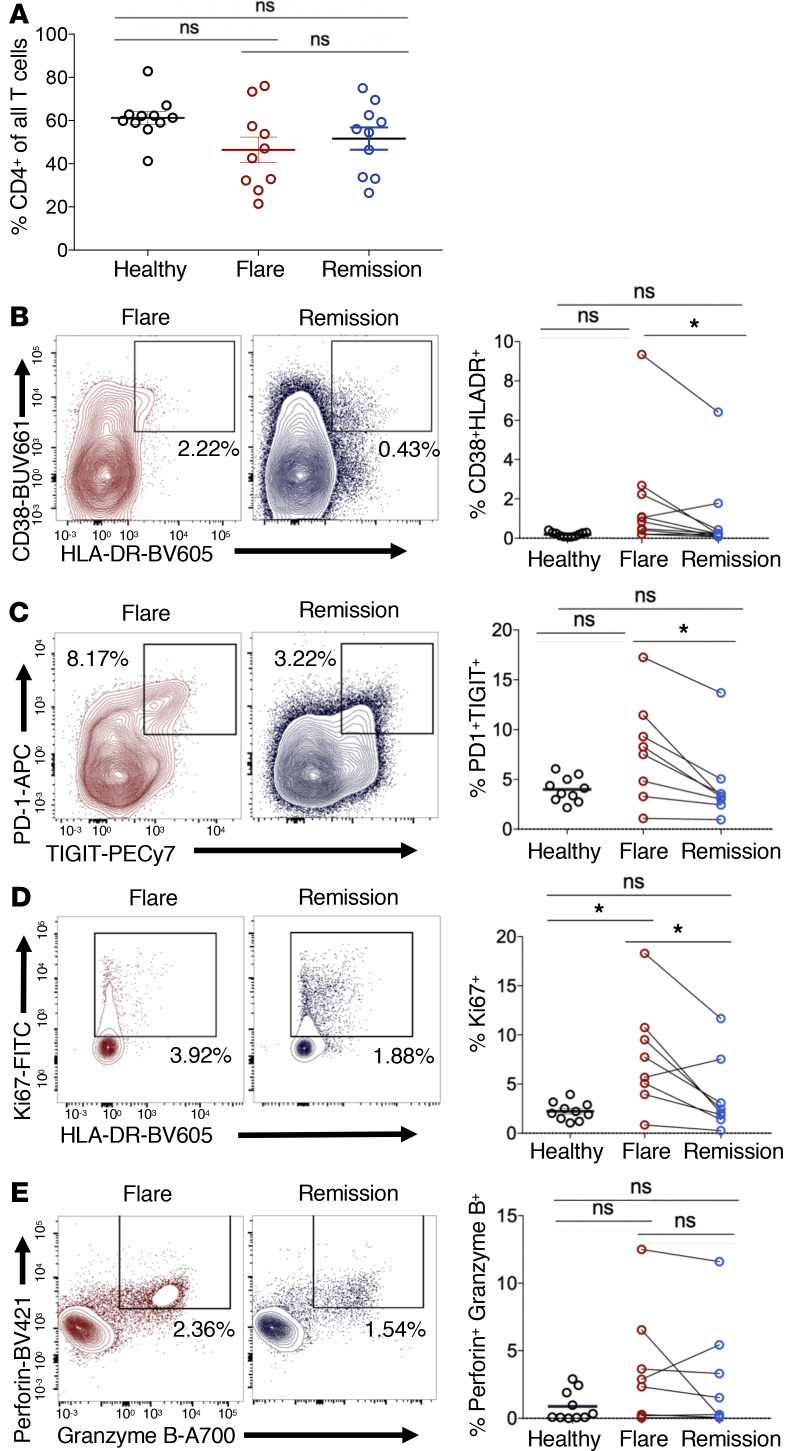
To investigate these possibilities, we examined activation and proliferation markers within nonnaive, or memory, CD8+ T cells during flare and remission. CD8+ T cells displayed a more activated phenotype during flare, as we observed elevated CD38+HLA-DR+, PD-1+TIGIT+, and Ki67+ CD8+ T cells during flare compared with remission and healthy donors (Figure 2, B–D). Although these markers are also associated with T cell exhaustion, the single cell transcriptomic profile of CD8+ T cells from these patients was associated with effector or memory rather than an exhaustion profile (Supplemental Figure 6). These CD8+ T cells also had increased coexpression of the effector cytolytic proteins perforin and granzyme B in both flare and remission compared with healthy donors, suggesting that CD8+ T cells may be driven to a cytotoxic differentiation state in iMCD-TAFRO (Figure 2E). The activation and proliferation was not restricted to CD8+ T cells, as we also observed an increased frequency of PD-1+TIGIT+CD4+ T cells and cycling Ki67+CD4+ T cells (Figure 3, B–E). While CD4+ T cells did not represent a greater fraction of all CD3+ T cells in iMCD-TAFRO patients across flare and remission and compared with healthy donors (Figure 3A), we did observe a trend toward a reduced relative frequency of CXCR5+CD4+ T cells during flare compared with healthy donors (P = 0.0624) (Supplemental Figure 3, A and B). Given the previously reported increased levels of circulating CXCL13 and lymph node germinal center expression of CXCL13, this likely represents increased homing of CXCR5+ cells to germinal centers. Within this population of CXCR5+CD4+ T cells, we identified a trend toward an increased frequency of circulating T follicular helper cells (cTfh) coexpressing PD-1 and the activation marker TIGIT (P = 0.591) in flare versus remission (Supplemental Figure 3, C and D). Altogether, these data demonstrate the presence of both CD4+ and CD8+ T cell activation during iMCD-TAFRO flare.
Figure 3. Circulating CD4+ T cells are more activated during flare when compared with remission and healthy donors.
(A) Identification of CD4+ T cells (previously gated as singlets, live, CD45+, CD3+) and subsequent gating of nonnaive CD4+ T cells lacking coexpression of CD45RA and CCR7. (B–D) Flow cytometric analyses of healthy donor (n = 10), iMCD-TAFRO flare (n = 8), and iMCD-TAFRO remission (n = 8) nonnaive CD4+ T cells with representative plots gating CD38+HLA-DR+ (B), PD-1+TIGIT+ (C), Ki67+ (D), and perforin+granzymeB+ CD4+ T cells (E) in flare and remission and comparison of frequencies across remission versus flare and healthy donor (HD) versus flare. Data are mean ± SEM. P values are based on paired 2-tailed t tests between remission and flare samples and unpaired 2-tailed t tests between healthy donor and flare, with a Bonferroni’s correction for multiple hypotheses testing. *P < 0.05.
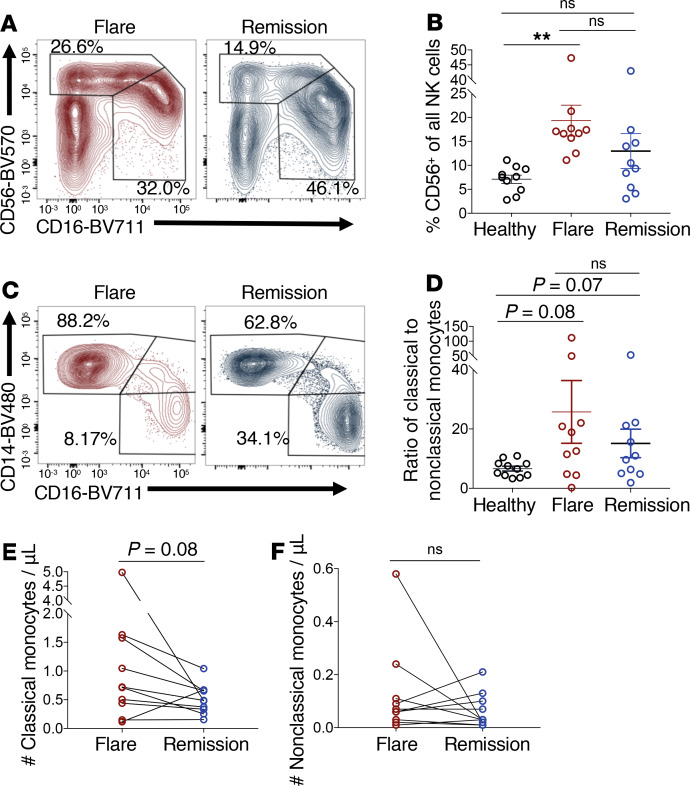
Finally, we characterized distinct NK cell and monocyte subsets in iMCD-TAFRO flare and remission. A significant increase in the relative frequency of CD56bright NK cells compared with CD16+ NK cells was seen within the NK cell compartment during iMCD-TAFRO flare compared with healthy donors (Figure 4, A and B). CD56bright NK cells are better cytokine producers and have also been reported to be elevated in frequency in SLE and Sjogren’s syndrome (19). We also observed a trend toward an increased ratio of classical (CD14+CD16–) to nonclassical (CD14–CD16+) monocytes in iMCD-TAFRO flare (P = 0.08) and remission (P = 0.07) when compared with healthy donors (Figure 4, C and D). There was also a trend toward an increased absolute number of classical monocytes in flare compared with remission (P = 0.08), but there was no change in the absolute number of nonclassical monocytes between flare and remission (Figure 4, E and F). Classical monocytes tend to be more proinflammatory in function, although both monocyte subsets have been shown to promote inflammation and contribute to pathogenesis in autoimmune diseases such as SLE and rheumatoid arthritis (20).
Figure 4. Monocyte and NK cell subset composition is altered during flare when compared with healthy donors.
(A) Identification of CD56-expressing and CD16-expressing NK cell subsets, previously gated as singlets, live, CD45+, within the lymphocyte gate (SSC-A-low), CD3–, and CD19– during iMCD-TAFRO flare and remission. (B) Relative frequency of CD56bright NK cells among all NK cells from healthy donors (n = 10), iMCD-TAFRO flare (n = 10), and iMCD-TAFRO remission (n = 10). (C) Identification of monocytes (previously gated as singlets, live, CD45+, within the monocyte gate [SSC-A-intermediate and CD4-intermediate] CD3–, CD19–, CD56–) and subsequent gating of classical (CD14+CD16–) and nonclassical (CD14–CD16+) monocytes during iMCD-TAFRO flare and remission. (D) Ratio of classical to nonclassical monocytes from healthy donors (n = 10), iMCD-TAFRO flare (n = 10), and iMCD-TAFRO remission (n = 10). (E and F) The absolute number of classical (E) and nonclassical (F) monocytes per μL of whole blood across paired remission and flare samples. Data are mean ± SEM. P values are based on paired 2-tailed t tests between remission and flare samples, with a Bonferroni’s correction for multiple comparisons. **P < 0.01.
IFN-I gene signature within circulating CD8+ T cells, NK cells, and monocytes during iMCD-TAFRO flare.
In order to define potential underlying mechanisms driving T cell activation and innate cell expansion in iMCD-TAFRO flare, we investigated potential signaling pathways and transcriptional programs using scRNAseq. Single-cell transcriptomics data sets were generated from PBMCs from 3 iMCD-TAFRO patients at flare and remission. We integrated these data sets using the R package Seurat and visualized the gene sets from flare and remission by t-distributed stochastic neighbor embedding (tSNE) plot (21). Immune cell populations were identified based on expression of common lineage genes within each cluster (Supplemental Figure 4, A and C–H). Cells were found to cluster according to immune cell subset and not due to patient sample or disease state (Supplemental Figure 4B).
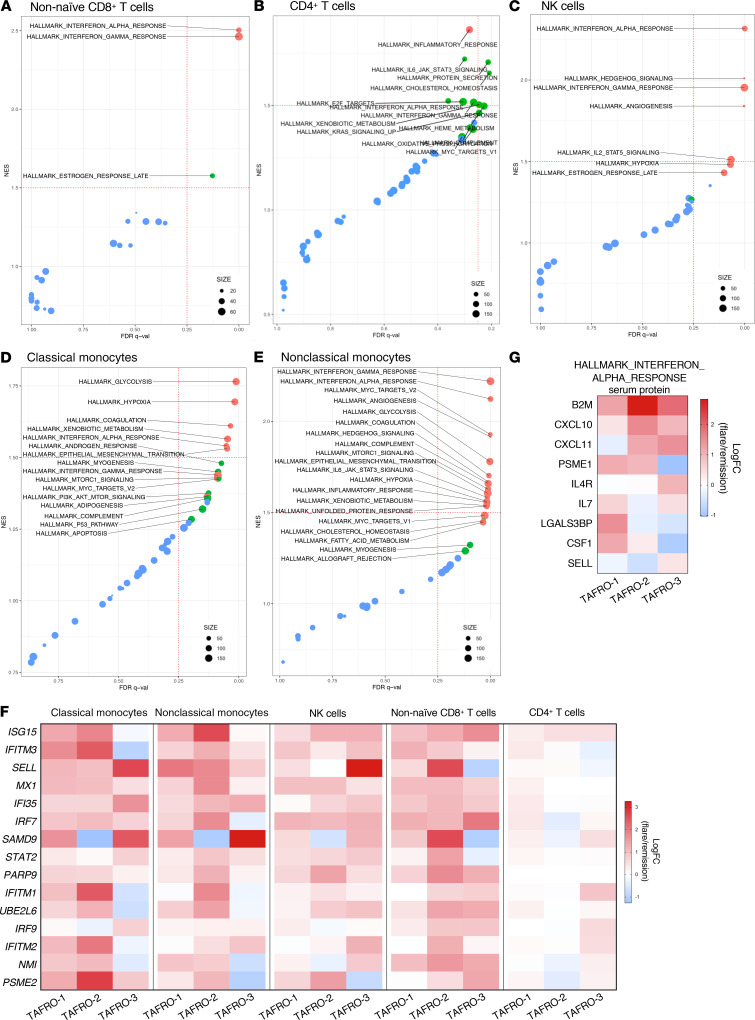
Next, we compared the ratio of differences in gene expression between the flare and remission data sets to determine whether any of the Molecular Signatures Database (MSigDB) 50 hallmark gene sets were enriched within clusters of classical and nonclassical monocytes, NK cells, and CD4+ and CD8+ T cells by Gene Set Enrichment Analysis (GSEA) (22) (Supplemental Figure 5). We identified the HALLMARK_INTERFERON_ALPHA_RESPONSE gene set as the only gene set significantly enriched (P < 0.05, FDR q < 0.05) across classical monocytes, nonclassical monocytes, NK cells, and CD8+ T cells (Figure 5, A–E). However, the HALLMARK_INTERFERON_ALPHA_RESPONSE gene set was not enriched within CD4+ T cells below our predefined FDR (P = 0.052, FDR q = 0.361) (Figure 5B). Quantification of the natural log-fold change gene expression between flare and remission identified consistent upregulation of genes from the HALLMARK_INTERFERON_ALPHA_RESPONSE gene set across all 3 patients and all cell populations investigated (Figure 5F). These data suggest the presence of an enhanced IFN-I gene signature within multiple immune cell populations during iMCD-TAFRO flare.
Figure 5. Circulating immune cell populations have an enriched type I IFN response gene signature during flare when compared with remission.
(A–E) Gene set enrichment plots reporting enrichment of the HALLMARK gene sets with observed FDR q value and normalized enrichment score (NES) across nonnaive CD8+ T cells (A), CD4+ T cells (B), NK cells (C), classical monocytes (D), and nonclassical monocytes (E). Size of points represent number of genes expressed within each HALLMARK gene set. Color representative of P value for each gene set, with P < 0.01 in red, 0.01 < P < 0.05 in green, and P > 0.05 in blue. (F) Heatmap of the top 15 highly expressed genes within the HALLMARK_INTERFERON_ALPHA_RESPONSE reporting the Log2 fold change (LogFC) gene expression between flare and remission across all 3 TAFRO patients and all cell populations in which this pathway was found to be enriched in GSEA. (G) Heatmap reporting the natural LogFC serum levels of HALLMARK_INTERFERON_ALPHA_RESPONSE proteins between flare and remission from TAFRO-1, TAFRO-2, and TAFRO-3 using the SomaLogic platform.
To corroborate the GSEA analysis, we next asked whether genes from the HALLMARK_INTERFERON_ALPHA_RESPONSE gene set were among the top significantly differentially expressed genes (DEGs) within immune cell subsets during flare compared with remission. During flare, elevated expression of several IFN-α response genes was found within the top 15 DEGs in each cell subset, including IFI6, PSMB9, and PSME2 in CD8+ T cells; ISG15 in CD4+ T cells; ISG15 in NK cells; SELL, CLEC4E, and OAS1 in classical monocytes; and ISG15, IFITM3, IFI6, and CASP1 in nonclassical monocytes (Supplemental Figure 5).
Evidence of a systemic IFN-I response during iMCD-TAFRO flare was also apparent from serum proteomics of the same patients. Serum protein levels of 7 of 9 IFN-α response analytes were elevated in flare compared with remission across at least 2 of the 3 iMCD-TAFRO patients (Figure 5G).
Enrichment of mTORC1 gene signatures associated with IFN-I gene expression in classical, but not nonclassical, monocytes.
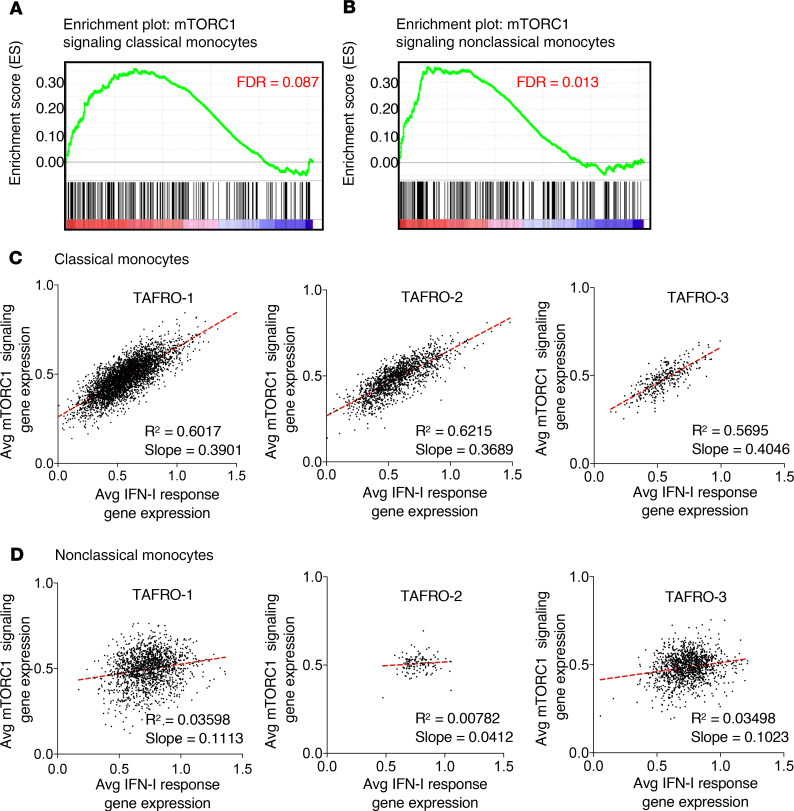
We recently discovered increased pathogenic mTORC1 activation in a cohort of 3 iMCD-TAFRO patients, which we have now extended to more than 20 iMCD (TAFRO and NOS) patients (16). However, the cell types and pathologic mechanisms underlying increased mTORC1 activation in the 3 iMCD-TAFRO patients responsive to mTOR inhibition with sirolimus remain largely unknown (16, 17). Here, we asked which, if any, immune cell populations show enrichment of mTORC1 signaling at the transcript level during flare compared with remission. Through GSEA, we found enrichment of the HALLMARK_MTORC1_SIGNALING gene set in classical and nonclassical monocytes during flare compared with remission (Figure 5, D and E; and Figure 6, A and B) and consistently across all 3 patients (Supplemental Figure 7).
Figure 6. mTORC1 signaling is enriched and associated with type I IFN response gene expression in classical monocytes from iMCD flare.
(A and B) Enrichment of HALLMARK_MTORC1_SIGNALING in classical monocytes (A) and nonclassical monocytes (B). (C and D) Dot plots with linear regression of the average expression of genes from the HALLMARK_MTORC1_SIGNALING gene set and average expression of genes from the HALLMARK_INTERFERON_ALPHA_RESPONSE gene set within each single-cell sequenced from TAFRO-1, TAFRO-2, and TAFRO-3, identified as classical monocytes (C) and nonclassical monocytes (D). Linear regression was used to assess association between 2 continuous variables, and significant association was set if the lower 95% of the CI was above zero.
Having observed both IFN-I and mTORC1 gene sets enriched in both monocyte populations, we quantified the average relative expression of IFN-α response genes, as well as mTORC1 signaling genes, at the single-cell level and asked whether expression of genes within these 2 gene sets were associated. We observed a strong positive correlation (R2 > 0.55, slope > 0.35) in the expression of genes from these 2 pathways within classical monocytes from all 3 iMCD-TAFRO patients (Figure 6C). In contrast, no correlation (R2 < 0.05, slope < 0.12) was observed in nonclassical monocytes (Figure 6D). These data suggest that mTORC1 signaling and IFN-I response gene expression are associated in classical monocytes from iMCD-TAFRO patients in flare.
Increased IFN-I–induced activation of the mTOR signaling pathway in iMCD-TAFRO.
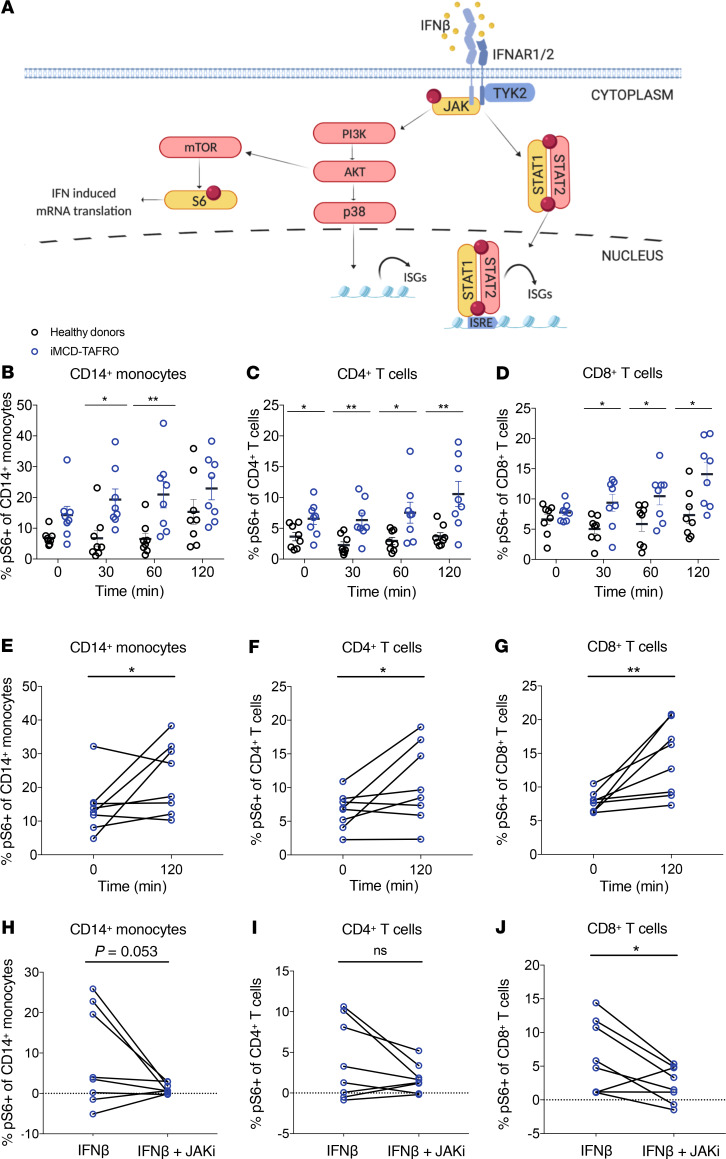
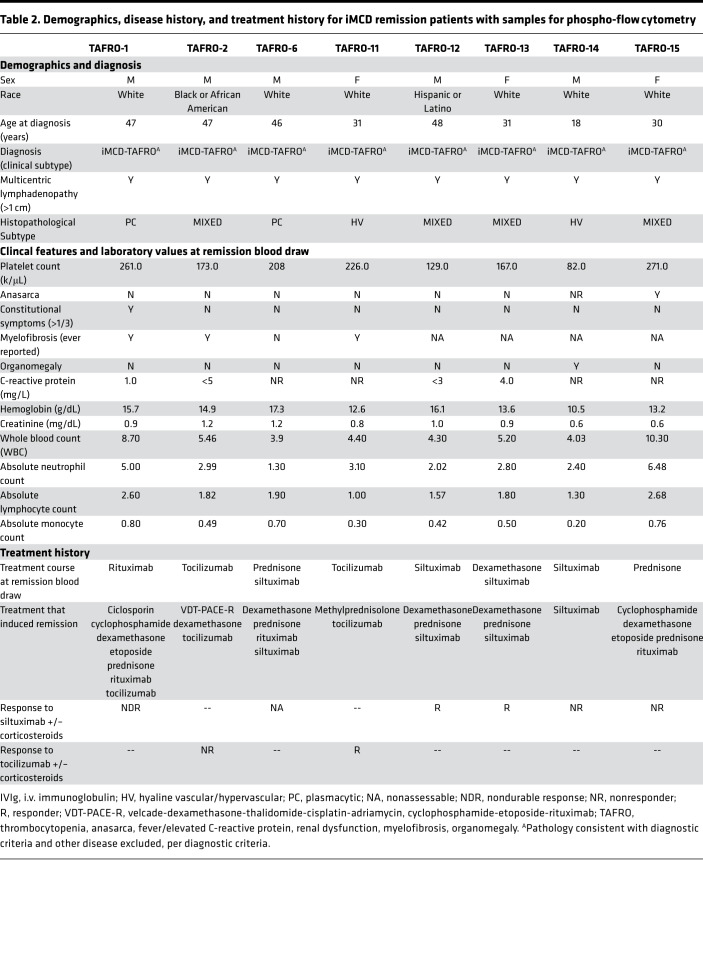
Having observed a correlation between IFN-I and mTOR signaling gene expression in classical monocytes, we hypothesized that mTOR activation in iMCD-TAFRO could result from IFN-I signaling, such that IFN-I may induce JAK signaling, leading to mTORC1 activation and STAT1-mediated expression of IFN-I response genes (Figure 7A). In order to test this hypothesis, the sensitivity of PBMCs to IFN-I–stimulated STAT1 and mTOR signaling was assessed in 8 iMCD-TAFRO patients during remission using phospho-flow cytometry (Table 2 and Supplemental Figure 8). Here, we examined the phosphorylation of STAT1 and ribosomal protein S6 (RPS6 or S6), a downstream readout of mTOR activation and an effector of mTORC1, following stimulation with the IFN-I family member IFN-β. Importantly, all members of the IFN-I family have a single receptor (IFNAR1/2) and demonstrate common signaling through JAK-STAT pathways, so we regard IFN-α and IFN-β as identical members of the IFN-I family for the purpose of these studies.
Figure 7. Induction of mTOR signaling downstream of IFN-β in iMCD-TAFRO.
(A) Schematic detailing Type I IFN proximal signaling to JAK, downstream activation of mTOR to phosphorylate ribosomal protein S6, and parallel engagement of p38 and pSTAT1/pSTAT2 leading to expression of IFN-stimulated genes (ISGs). Created with www.BioRender.com (B–D) Percent of healthy donor (black) cells (n = 8) and iMCD-TAFRO remission (blue) cells (n = 8) expressing phosphorylated ribosomal protein S6 (S235/S236) upon stimulation with 100 ng/mL IFN-β for 0, 30, 60, or 120 minutes within CD14+ classical monocytes (B), CD4+ T cells (C), and CD8+ T cells (D). (E–G) Percent of iMCD-TAFRO remission cells (n = 8) expressing phosphorylated ribosomal protein S6 (S235/S236) upon stimulation with 100 ng/mL IFN-β for 0 or 120 minutes within CD14+ classical monocytes (E), CD4+ T cells (F), and CD8+ T cells (G). (H–J) Comparison of the change in the percentage of cells compared with untreated samples expressing phosphorylated ribosomal protein S6 (S235/S236) following treatment with either 100 ng/mL IFN-β alone or both IFN-β and 1 μM JAKi within CD14+ classical monocytes (H), CD4+ T cells (I), and CD8+ T cells (J) from iMCD-TAFRO samples from remission. Data are mean ± SEM. For time-dependent comparisons, P values are based on 2-way ANOVA with Bonferroni’s correction for multiple comparisons. P values are based on 1-tailed, paired t tests between samples treated with IFN-β and IFN-β and JAKi.
Table 2. Demographics, disease history, and treatment history for iMCD remission patients with samples for phospho-flow cytometry.
Neither the degree nor the kinetics of IFN-β–mediated pSTAT1 induction were significantly different between healthy donors and iMCD-TAFRO patients in remission (Supplemental Figure 9), suggesting that IFN-β–induced pSTAT1 signaling may not be altered in circulating immune cell populations from iMCD-TAFRO patients. However, across multiple time points of stimulation, the frequency of pS6+ monocytes and T cells in iMCD-TAFRO remission samples was significantly higher compared with healthy donor samples (Figure 7, B–D). We also found that IFN-β stimulation significantly increased the frequency of pS6-expressing classical monocytes, CD4+ T cells, and CD8+ T cells from iMCD-TAFRO patients in remission following 120 minutes of stimulation (Figure 7, E–G, and Supplemental Figure 10). However, significant induction of pS6 by IFN-β was only observed in CD14+ monocytes from healthy donors and not within healthy donor T cells (Supplemental Figure 11). Linear mixed model (LMM) analyses were performed to assess the time-dependent induction of pS6 and confirmed these findings (Supplemental Figure 12).
Having observed induction of pS6 in iMCD-TAFRO remission samples, we then asked whether IFN-β–induced phosphorylation of pS6 is dependent on JAK1 signaling. A significant reduction in the frequency of pS6+CD8+ T cells was seen following treatment with the JAK1/2 inhibitor (JAKi) ruxolitinib, and a similar trend was observed in CD4+ T cells (Figure 7, H–J). Finally, we tested whether IFN-β–induced phosphorylation of pS6 is dependent on mTORC1 signaling. Here, we observed a significant reduction in the frequency of pS6+ CD8+ T cells following treatment with the mTORC1 inhibitor rapamycin (sirolimus), suggesting that the IFN-β–mediated phosphorylation of S6 is dependent on both JAK and mTOR (Supplemental Figure 13). These data support a mechanistic link between IFN-I signaling, JAK signaling, and the increased pathogenic mTOR activation previously observed in iMCD-TAFRO, and they suggest a potential therapeutic role for both JAK and mTORC1 inhibition.
Discussion
To our knowledge, this study provides the first in-depth flow cytometric and single-cell transcriptional characterization of circulating immune cell populations in iMCD-TAFRO and reveals the functional difference reported in iMCD-TAFRO patient samples compared with controls. Specifically, multicolor flow cytometry identified a number of phenotypic differences, including T cell activation and alterations in NK cell and monocyte subset frequencies. We also observed heterogeneity in cell numbers and relative frequencies across iMCD-TAFRO patients in this cohort, which may reflect the presence of multiple pathogenic mechanisms, heterogeneous disease progression, or variable disease state at the time of blood draw.
Through the use of scRNAseq and GSEA, we identified a IFN-I response gene signature across circulating CD8+ T cells, NK cells, and monocyte subsets and an mTORC1 signaling gene signature within circulating monocytes. Serum proteomics data and differential gene expression analysis support this IFN-I signature, as well. We demonstrated that the increased mTOR activation in iMCD-TAFRO may occur downstream of IFN-I signaling, as we observed significantly greater induction of pS6 in monocytes and T cells from iMCD-TAFRO remission samples compared with healthy donors. Finally, this IFN-I–mediated mTOR activation can be abrogated through treatment with the JAKi ruxolitinib, as well as the mTOR inhibitor rapamycin (sirolimus). The data presented here corroborate the notion of widespread systemic inflammation during iMCD-TAFRO disease flare and suggest a role for IFN-I signaling as a mechanistic driver of increased mTOR activation in iMCD-TAFRO. Future work should aim to determine whether mTOR activation results from hyperresponsiveness to IFN-I or is the result of elevated IFN-I in circulation or in tissue.
Our findings reveal increased activation of both CD4+ and CD8+ T cells during iMCD-TAFRO flare. T cell activation is critical and potentially pathogenic in a number of contexts, including both infection and autoimmunity. The phenotypes detailed here are consistent with both and, as the etiology of iMCD-TAFRO remains unknown, we can only speculate as to the cause of T cell activation observed across this patient cohort. These T cells may become activated as a bystander result of systemic inflammation or may expand clonally in an antigen-dependent manner. Our group aims to address the possibility of clonal T cell expansion through the characterization of TCR repertoires in a follow-up cohort of iMCD-TAFRO patients as additional matched flare and remission samples become available.
This study was also the first to sequence the single-cell transcriptomes of circulating immune cell populations from matched iMCD-TAFRO flare and remission samples. Across the immune cell populations investigated, transcriptional profiling identified upregulation of various effector genes. These data combine to suggest activation and mobilization of T cells, NK cells, and monocytes, which is in accordance with the iMCD-TAFRO clinical features and, more broadly, a systemic inflammatory disorder (11). However, we did not anticipate observing differential expression of IFN-I response genes across numerous immune cell populations, since neither IFN-I production nor response has been previously reported in iMCD-TAFRO. While the IFN-I gene signature was identified in 3 patients with iMCD-TAFRO using scRNAseq, further work is needed to perform orthogonal methods and larger sample sets are required to further develop this for potential clinical application.
IFN-I are secreted cytokines that have 3 major functions. First, they induce cell-intrinsic antimicrobial states in infected and neighboring cells, limiting the spread of pathogens. Second, they modulate innate immune responses to promote antigen presentation and NK cell functions while restraining proinflammatory cytokine production. Third, they promote the development of antigen-specific T and B cell responses and immunological memory. While IFN-I are protective during acute viral infections, they can play either protective or deleterious roles during bacterial infection and in autoimmune diseases (23).
Deleterious IFN-I production has been reported in a number of autoimmune diseases, with the prototype being SLE (24). Genetic associated data suggest that single nucleotide polymorphisms (SNPs) in TLR and IFN-I signaling pathways contribute to lupus disease susceptibility in at least a subset of patients (25–27). Genetic association studies have not been performed to date in iMCD-TAFRO, but the enriched IFN-I response signature in iMCD-TAFRO patients could be the result of genetic factors leading to increased intrinsic IFN-I responsiveness, or they could be the result of increased circulating IFN-I. Future work is needed to address these questions and should aim to quantify IFN-I levels in serum and within lymph node tissue from iMCD-TAFRO patients.
Increased mTOR activation was recently identified in lymph node tissue from iMCD-TAFRO patients by our group and has led to a clinical trial of sirolimus in IL-6 blockade refractory iMCD, which began enrollment in July 2019 (28). However, the mechanistic driver for increased mTOR signaling in iMCD-TAFRO remains unknown. Here, we observed increased mTOR activation in monocytes and T cells from iMCD-TAFRO patients in remission following stimulation with IFN-β, suggesting that IFN-I is a cytokine capable of inducing mTOR activation in iMCD-TAFRO (Figure 7). In this study, we observed a strong positive correlation between the expression of mTORC1 signaling genes and IFN-I response genes within classical monocytes. Because this finding is only correlative, this led us to perform functional experiments to investigate the relationship between IFN-I signaling and mTORC1 activation. Since we did not observe a correlation within nonclassical monocytes, NK cells, or CD4+ or CD8+ T cells, there may be other contributors (e.g., other cytokines, TCR) to the mTORC1 response independent of IFN-I response gene expression. These data do not signify that IFNAR1/2 signaling cannot lead to both mTORC1 activation and IFN-I response gene expression in multiple cell types; these data set suggest that these 2 pathways may be more strongly associated in classical monocytes.
Consistent with this line of thought, our functional experiments measuring induction of pS6 (a readout of mTOR activation) downstream of IFNAR1/2 suggest that IFN-I–induced, JAK-mediated mTOR activation occurs in both classical monocytes and T cells from these patients. IFN-I–induced mTOR activation has also been observed in systemic inflammatory diseases such as SLE, where IFN-I–induced mTOR activation may promote the translation of select IFN-α response genes (23, 29, 30). Furthermore, IFN-I can have varied effects on a number of immune cell populations. For example, IFN-I can drive DCs to become more potent antigen presenting cells through increased expression of costimulatory and MHC molecules (31), and IFN-I in tissue may drive recruitment of inflammatory monocytes and their differentiation into macrophages (32, 33). Now, we aim to determine the cause and potential pathologic consequences of IFN-I signaling and mTOR activation in iMCD-TAFRO.
In addition, all IFN-I family members, including IFN-α and IFN-β, bind to and signal through a receptor complex composed of IFNAR1 and IFNAR2, which activates the JAK-STAT signaling pathway (34). Here, we determined that IFN-β–induced mTOR activation in iMCD-TAFRO is dependent on both JAK and mTORC1 signaling (Figure 7), suggesting that both JAK and mTORC1 inhibitors should be further investigated as candidate treatments for iMCD-TAFRO patients. JAK inhibitors are approved by the US Food and Drug Administration (FDA) for treatment of rheumatoid arthritis and myelofibrosis and have been suggested in recent years as treatment for a variety of immune-mediated diseases (35–37). Interestingly, myelofibrosis is commonly observed in iMCD-TAFRO patients and is one of the defining features of the iMCD-TAFRO subtype (7). JAK inhibitors hinder signals from multiple cytokines intracellularly (36), as well as STAT3 signaling; therefore, they may be useful in treating iMCD-TAFRO when other therapies are ineffective, particularly in patients who do not respond to IL-6 blockade with siltuximab, the only FDA-approved treatment to date. Clinical information from the 8 iMCD-TAFRO patients who received IL-6 blockade with or without corticosteroids also revealed an important insight into treatment. Two of the 4 patients with the hyaline vascular/hypervascular histopathological subtype, 0 of 1 with plasmacytic histopathological subtype, and 2 of 3 with mixed histopathological subtype demonstrated durable clinical responses to IL-6 blockade. This observation is consistent with the existing body of published literature and treatment guidelines, which support not using histopathological subtype to guide treatment decisions.
We would like to acknowledge several limitations of the samples included in this study. First, because treatment regimens were not uniform for all the patients, we cannot exclude the possibility that some of the effects observed between flare and remission could be due to treatment rather than disease resolution. Still, the uniformity seen in the decrease of activated T cells and other immune parameters suggest that patients in remission share similar immunological signatures, regardless of the treatment employed to achieve remission. Since disease flares are not self-limiting and remission does not occur spontaneously, it is extraordinarily unlikely to be able to obtain a remission sample before a patient first presents, is diagnosed, and is treated. Though it does not fully address the confounding role that these treatments may play, the age/sex-matched healthy donors provide a comparison group to ascertain differences between both flare and remission from disease-free, treatment-free individuals. Furthermore, the mTORC1 enrichment in GSEA between flare and remission within monocytes could be due to downregulation of mTORC1 signaling genes due to treatment with sirolimus during remission. However, only 1 of the 3 patients (iMCD-TAFRO-3) who underwent scRNAseq was on sirolimus at the time of remission. To address the concern that enrichment of the HALLMARK_MTORC1_SIGNALING gene set could have been influenced by strong downregulation of mTORC1 signaling, we calculated the log fold change (logFC) between flare and remission individually across all 3 patients and observed elevated expression of mTORC1 signaling genes during flare compared with remission across all 3 patients and all cell populations tested, including classical and nonclassical monocytes, NK cells, and CD4+ and CD8+ T cells (Supplemental Figure 7).
Our flow cytometry panel did not allow us to fully determine whether PD-1 and TIGIT expression during flare represents a state of T cell exhaustion or activation. However, the increased frequency of cells expressing the cell cycle marker Ki67 suggest that at least a portion of the T cells are activated during flare, since fully exhausted T cells are not capable of undergoing cell division (38, 39). We also further analyzed our scRNAseq data set and performed GSEA using publicly available data sets for genes enriched in exhausted CD8+ T cells and alternatively in effector or memory CD8+ T cells. Nonnaive CD8+ T cells from all 3 patients showed stronger enrichment of effector and memory genes when compared with exhausted genes, suggesting that they are more likely to be activated (Supplemental Figure 6). Finally, while we identified a number of immune cell populations within clusters in our scRNAseq data set, the cluster containing CD4+ T cells may not be a homogeneous cell population. It may also contain CD4–CD8–CD3+ T cells (or double-negative (DN) T cells, since CD4 is a low-abundance transcript and other genes are better at identifying this population. With this caveat in mind and knowing that these DN T cells reflect less than 10% of CD3+ T cells based on flow cytometry, we performed downstream analyses on this population.
In summary, this study provides in-depth flow cytometric and transcriptional characterization of circulating immune cell populations in iMCD-TAFRO and identifies a number of phenotypic differences, including the identification of a IFN-I response gene signature across circulating CD8+ T cells, NK cells, and monocyte subsets. The data presented here corroborate the notion of a widespread systemic inflammation during iMCD-TAFRO disease flare and have revealed potentially novel candidate cell types and mechanisms involved in iMCD-TAFRO pathogenesis.
Methods
Study design.
The goal of this study was to characterize circulating immune cell populations within PBMCs from iMCD-TAFRO patients. PBMCs were collected and cryopreserved at independent research centers worldwide. Only patients for whom treatment regimen, clinical parameters, and paired flare and remission samples were available were selected for inclusion in this study. Recruitment occurred at the University of Pennsylvania and the University of Arkansas for Medical Sciences. A panel of iMCD-TAFRO experts assembled for the ACCELERATE Natural History Registry or physicians at the University of Arkansas for Medical Sciences Castleman Disease Center of Excellence reviewed clinical, laboratory, and radiological data, as well as histopathology for all 10 cases.
As defined in published diagnostic criteria, diagnosis with iMCD was determined by multicentric lymphadenopathy with defined histopathology, ≥ 2 clinical/laboratory changes, and exclusion of diseases with overlapping clinical features. T cell activation data (relative frequency of CD38+HLA-DR+ T cells) was previously reported for 3 (iMCD-TAFRO-3, iMCD-TAFRO-9, iMCD-TAFRO-10) of the 10 patients (17). Classification of patients with the TAFRO clinical subtype of iMCD was determined according to published guidelines (7, 8, 10, 11). Definition of patients from this cohort with the TAFRO subtype included thrombocytopenia, anasarca, and fever at the time of diagnosis in all patients and reticulin fibrosis, renal dysfunction, and/or organomegaly in some iMCD-TAFRO patients. All laboratory values, treatments, and sample collection dates were obtained from the patients’ medical records. Disease flares were determine based on clinical features and laboratory test results, including hypoalbuminemia (<3.5 g/dL), elevated CRP (>10 mg/L), anemia (hemoglobin < 13.5 g/dL), renal dysfunction (creatinine > 1.3 mg/dL), constitutional symptoms, and fluid accumulation. All laboratory tests were performed in hospital laboratories or in Clinical Laboratory Improvement Amendments of 1988–certified (CLIA-certified) laboratories, as part of the patients’ clinical care. No additional laboratory tests were performed to assess their levels for this study.
Subject grouping and clinical parameters are summarized in Table 1. A more detailed clinical history is presented in Supplemental Document 1.
Sample collection and isolation of PBMCs.
PBMCs were isolated by density gradient centrifugation using Ficoll-Paque PLUS (GE Healthcare). Cells were washed twice in PBS (Invitrogen), cryopreserved in freezing medium containing 20% FBS (Invitrogen) and 10% DMSO (MilliporeSigma), and maintained in liquid nitrogen for long-term storage. When required, cryopreserved samples were shipped to the University of Pennsylvania on dry ice. Cryopreserved PBMC samples from age- and sex-matched healthy donors were obtained from the Human Immunology Core at the University of Pennsylvania.
Flow cytometry.
Samples from patients and healthy donors were processed following the same protocol. Briefly, cryopreserved cells were thawed and rested for 3 hours in RPMI medium supplemented with 10% FBS (Gemini), 1% penicillin/streptomycin (Lonza), 2 mM L-glutamine (Corning), and 10 U/mL DNase I (Roche Diagnostics). Cells were then washed with PBS and stained with a viability dye (LIVE/DEAD Aqua, Thermo Fisher Scientific) for 10 minutes at room temperature, followed by 20 minutes of staining with antibodies against surface markers. Supplemental Table 1 shows a list of antibodies used, as well as fluorochromes, clone numbers, and catalog numbers. After staining, cells were washed with PBS containing 1% BSA (Gemini) and 0.1% sodium azide (Thermo Fisher Scientific) and fixed with 1% paraformaldehyde (Electron Microscopy Sciences).
For identification of phospho-proteins, cells were thawed as described above and maintained in serum-free media throughout. Cells were plated in 96-well plates and allowed to rest for 2 hours in serum-free RPMI medium (Thermo Fisher Scientific) supplemented with 1% penicillin/streptomycin (Lonza). Samples were then treated with recombinant human IFN-β (Peprotech) in a reverse time course. At the end of the time course, samples were fixed on ice immediately with 2% PFA (Electron Microscopy Sciences) for 20 minutes and permeabilized on ice for 30 minutes with methanol (MilliporeSigma). Cells were then stained overnight, washed, and collected for analysis. All samples were read using a LSRFortessa X-50 cytometer or LSRII cytometer (BD Biosciences) and analyzed using FlowJo software. Lymphocytes were identified by forward and side scatter.
10X Chromium Genomics single-cell library generation and sequencing.
At the time of experimentation, cell suspensions were thawed and cell aliquots were taken immediately for scRNAseq. Single-cell isolation and library preparation was performed using the Chromium platform (10x Genomics, v2 chemistry) at the Center for Applied Genomics (CAG) core at the Children’s Hospital of Philadelphia. Sequencing was performed on an Illumina Hiseq2500 SBS v4. The Chromium scRNAseq output was processed using the Cell Ranger (v.2.1.0) analytical pipeline to align reads to the GRCh38 reference genome and generate feature-barcode matrices. These feature-barcode matrices were then read into the R computing environment for downstream quality control and preprocessing of all samples using Seurat (21, 40). We first removed cells with a unique molecular identifiers (UMI) count < 500 and mitochondrial genes > 0.2. We then performed log-normalization of all data sets and standardized expression values for each gene across all cells. We then used the FindIntegrationAnchors and IntegrateData functions to identify pairwise correspondences, or anchors, between individual cells and then integrate the 3 iMCD-TAFRO flare data sets, 3 iMCD-TAFRO remission, and 1 healthy donor data set. Data was scaled across all cells in the integrated data set, and dimensionality reduction was performed using principal component analysis (PCA) and canonical correlation analysis (CCA). Cells were visualized by tSNE plot, and immune cell populations were identified based on expression of common lineage genes within each cluster. Differential gene expression was performed using a Wilcoxon rank-sum test and the FindConservedMarkers function within Seurat, which performs differential gene expression testing for each cell population between flare and remission and combines the P values using meta-analysis methods from the MetaDE R package. scRNAseq files are available from GEO series accession number GSE140881 (https://www.ncbi.nlm.nih.gov/geo/query/acc.cgi?acc=GSE140881).
GSEA.
GSEA was conducted using the software GSEA v3.0 for an a priori–defined set of genes within the 50 Molecular Signatures Database (MSigDB) hallmark gene sets (https://www.gsea-msigdb.org/gsea/msigdb/index.jsp) (22). The relative expression of each gene was averaged across all cells within a given cluster and used as input for GSEA. Genes with an average expression of zero across all samples were excluded from analyses. Following exploration level analyses of the 50 Hallmark gene sets, further individual GSEAs were performed using reference gene sets published in the MSigDB, including HALLMARK_INTERFERON_ALPHA_RESPONSE (M5911), SANA_RESPONSE_TO_IFNG_UP (M4551), and HALLMARK_MTORC1_SIGNALING (M5924).
Serum proteomics.
Serum from iMCD-TAFRO-1 in flare and remission and plasma from iMCD-TAFRO-2 and iMCD-TAFRO-3 in flare and remission were isolated according to standard protocols and stored at –80°C. Proteomic quantification was performed by SomaLogic SOMAscan, which uses a modified, aptamer-based technology, and serum and plasma samples were quantified separately. Log2 fold change was calculated as log2(flare/remission).
Statistics.
A paired 2-sided t test was used to compare the proportions of cell populations in iMCD-TAFRO samples obtained during flare versus matched remission samples. An unpaired 2-sided t test was used to compare the proportions of cell populations in iMCD-TAFRO flare samples versus healthy controls. Statistical comparisons were performed using 2-tailed Student’s t test or Wilcoxon signed-rank test, using P < 0.05 as a cutoff to determine statistical significance. Corrections were made in all analyses involving multiple comparisons. For analyses in Figure 7 comparing frequency of pS6+ cells between stimulation conditions, a paired 1-sided t test performed.
Association between 2 continuous variables was assessed by calculating the Pearson correlation coefficient. The slope and 95% CI were calculated using the bootstrap method in Prism, and significant association was set if the lower 95% of the CI was above zero. Pearson correlation was used to measure the degree of association. The best-fitting line was calculated using least squares fit regression. Statistical analyses were performed using GraphPad Prism.
Statistical tests for differences in the means of proportions (i.e., proportion of CD45+ cell types) were carried out using a 1- or 2-tailed Student’s t test on the centrometric log-ratio transformed proportions. To test for statistically significant variances in 2 different groups, we used the Brown-Forsythe test (Levene’s test modified for the median). Multiple independent hypothesis correction was not performed for cell proportion types, as these are dependent on each other. All analysis performed in R.
For time-dependent comparisons, P values are based on 2-way ANOVA with Bonferroni’s correction for multiple comparisons. P values are based on 1-tailed, paired t tests between samples treated with IFN-β and IFN-β and JAKi. For time-dependent changes in relative frequencies for pS6 and median fluorescence intensity (MFI) for pSTAT1, the statistical analysis of the dependence on time for each group (iMCD and healthy donor) was carried out using a LMM. First, the proportions were center–log ratio transformed (compositional analysis). Then, the LMM analysis allowed the intercept for every patient to vary (random effect) with the purpose of taking advantage of the repeated measures design and for allowing generalizability from the limited subject group. The 95% CI for the regression coefficient of each estimate was compared with zero to judge significance. The reported β1 coefficients are in units of percentage change per minute.
Study approval.
All participants enrolled in this study provided written informed consent as per protocols approved by IRB at the University of Pennsylvania. Sample sizes were based on the availability of biological samples rather than a prespecified effect size. Investigators were not blinded to group identity during the course of experimentation.
Author contributions
RALP, ASJ, MG, MRB, TK, and DCF contributed to study design. RFR, FVR, and DCF contributed to sample collection. RALP, ASJ, MG, VP, MO, and AAKL contributed to data collection. All authors contributed to data interpretation. RALP, ASJ, TK, and DCF contributed to writing the manuscript. RALP, ASJ, MG, DA, and SKP conducted analyses. VP contributed to data collection. CK and HH contributed to study design.
Supplementary Material
Acknowledgments
We thank Dustin Shilling for his contributions to the development and implementation of this study. We also thank Terri Laufer, Nina Luning Prak, Dan Beiting, Dan Rader, Patricia Tsao, and Kojo Elenitoba-Johnson for their consultations on this study. We thank Norman Pai, Mary Taylor, and Dave Allman for their support and guidance. We thank Martin Carroll, Ed Stadtmauer, Elena Amsterdam, and Marjorie Raines for their continued contributions to the study and treatment of Castleman Disease. This study was funded by Castleman’s Awareness & Research Effort/Castleman Disease Collaborative Network; the National Heart, Lung, and Blood Institute (1R01HL141408-01); the Hematologic Malignancies Translational Center of Excellence of the Abramson Cancer Center; University of Pennsylvania; and Uplifting Athletes.
Version 1. 05/07/2020
Electronic publication
Footnotes
214/215 Anatomy-Chemistry Building, 3620 Hamilton Walk, Philadelphia, Pennsylvania 19104-6061, USA. Phone: 215-614-0936; Email: davidfa@pennmedicine.upenn.edu.
Conflict of interest: DCF receives research support from EUSA Pharma for the ACCELERATE study (formerly sponsored by Janssen Pharmaceuticals) and study drug from Pfizer for NCT03933904 without corresponding financial support. FVR receives research support from Janssen Pharmaceuticals and consultant fees from EUSA Pharma. There is a pending provisional patent application based on the work in this paper.
Copyright: © 2020, American Society for Clinical Investigation.
Reference information: JCI Insight. 2020;5(9):e135031.https://doi.org/10.1172/jci.insight.135031.
Contributor Information
Ruth-Anne Langan Pai, Email: rhl68@cornell.edu.
Alberto Sada Japp, Email: ajapp@pennmedicine.upenn.edu.
Rozena F. Rasheed, Email: rrasheed@pennmedicine.upenn.edu.
Mariko Okumura, Email: okumura@mail.med.upenn.edu.
Sheila K. Pierson, Email: sheila.pierson@uphs.upenn.edu.
Victoria Powers, Email: Victoria.Powers@Pennmedicine.upenn.edu.
Awo Akosua Kesewa Layman, Email: Aaboagy1@gmail.com.
Charlly Kao, Email: KaoC@email.chop.edu.
Hakon Hakonarson, Email: hakonarson@email.chop.edu.
Frits van Rhee, Email: vanrheefrits@uams.edu.
Taku Kambayashi, Email: taku.kambayashi@uphs.upenn.edu.
David C. Fajgenbaum, Email: davidfa@pennmedicine.upenn.edu.
References
- 1.Dispenzieri A, et al. The clinical spectrum of Castleman’s disease. Am J Hematol. 2012;87(11):997–1002. doi: 10.1002/ajh.23291. [DOI] [PMC free article] [PubMed] [Google Scholar]
- 2.Liu AY, et al. Idiopathic multicentric Castleman’s disease: a systematic literature review. Lancet Haematol. 2016;3(4):e163–e175. doi: 10.1016/S2352-3026(16)00006-5. [DOI] [PubMed] [Google Scholar]
- 3.Munshi N, Mehra M, van de Velde H, Desai A, Potluri R, Vermeulen J. Use of a claims database to characterize and estimate the incidence rate for Castleman disease. Leuk Lymphoma. 2015;56(5):1252–1260. doi: 10.3109/10428194.2014.953145. [DOI] [PubMed] [Google Scholar]
- 4.Beck JT, et al. Brief report: alleviation of systemic manifestations of Castleman’s disease by monoclonal anti-interleukin-6 antibody. N Engl J Med. 1994;330(9):602–605. doi: 10.1056/NEJM199403033300904. [DOI] [PubMed] [Google Scholar]
- 5.Nishimoto N, et al. Humanized anti-interleukin-6 receptor antibody treatment of multicentric Castleman disease. Blood. 2005;106(8):2627–2632. doi: 10.1182/blood-2004-12-4602. [DOI] [PubMed] [Google Scholar]
- 6.van Rhee F, et al. Siltuximab for multicentric Castleman’s disease: a randomised, double-blind, placebo-controlled trial. Lancet Oncol. 2014;15(9):966–974. doi: 10.1016/S1470-2045(14)70319-5. [DOI] [PubMed] [Google Scholar]
- 7.Fajgenbaum DC, et al. International, evidence-based consensus diagnostic criteria for HHV-8-negative/idiopathic multicentric Castleman disease. Blood. 2017;129(12):1646–1657. doi: 10.1182/blood-2016-10-746933. [DOI] [PMC free article] [PubMed] [Google Scholar]
- 8.Iwaki N, et al. Clinicopathologic analysis of TAFRO syndrome demonstrates a distinct subtype of HHV-8-negative multicentric Castleman disease. Am J Hematol. 2016;91(2):220–226. doi: 10.1002/ajh.24242. [DOI] [PubMed] [Google Scholar]
- 9.Iwaki N, et al. Elevated serum interferon γ-induced protein 10 kDa is associated with TAFRO syndrome. Sci Rep. 2017;7:42316. doi: 10.1038/srep42316. [DOI] [PMC free article] [PubMed] [Google Scholar]
- 10.Kawabata H, et al. Castleman-Kojima disease (TAFRO syndrome) : a novel systemic inflammatory disease characterized by a constellation of symptoms, namely, thrombocytopenia, ascites (anasarca), microcytic anemia, myelofibrosis, renal dysfunction, and organomegaly : a status report and summary of Fukushima (6 June, 2012) and Nagoya meetings (22 September, 2012) J Clin Exp Hematop. 2013;53(1):57–61. doi: 10.3960/jslrt.53.57. [DOI] [PubMed] [Google Scholar]
- 11.Masaki Y, et al. Proposed diagnostic criteria, disease severity classification and treatment strategy for TAFRO syndrome, 2015 version. Int J Hematol. 2016;103(6):686–692. doi: 10.1007/s12185-016-1979-1. [DOI] [PubMed] [Google Scholar]
- 12.Gabay C, Kushner I. Acute-phase proteins and other systemic responses to inflammation. N Engl J Med. 1999;340(6):448–454. doi: 10.1056/NEJM199902113400607. [DOI] [PubMed] [Google Scholar]
- 13.van Rhee F, et al. International, evidence-based consensus treatment guidelines for idiopathic multicentric Castleman disease. Blood. 2018;132(20):2115–2124. doi: 10.1182/blood-2018-07-862334. [DOI] [PMC free article] [PubMed] [Google Scholar]
- 14.Hiepe F, Radbruch A. Plasma cells as an innovative target in autoimmune disease with renal manifestations. Nat Rev Nephrol. 2016;12(4):232–240. doi: 10.1038/nrneph.2016.20. [DOI] [PubMed] [Google Scholar]
- 15.Bleesing JJ, Straus SE, Fleisher TA. Autoimmune lymphoproliferative syndrome. A human disorder of abnormal lymphocyte survival. Pediatr Clin North Am. 2000;47(6):1291–1310. doi: 10.1016/S0031-3955(05)70272-8. [DOI] [PubMed] [Google Scholar]
- 16. doi: 10.1182/blood.2019002792. Arenas DJ. Increased mTOR activation in idiopathic multicentric Castleman disease [published ahead of print March 23, 2020]. Blood . [DOI] [PMC free article] [PubMed]
- 17.Fajgenbaum DC, et al. Identifying and targeting pathogenic PI3K/AKT/mTOR signaling in IL-6-blockade-refractory idiopathic multicentric Castleman disease. J Clin Invest. 2019;130:4451–4463. doi: 10.1172/JCI126091. [DOI] [PMC free article] [PubMed] [Google Scholar]
- 18.Zhang F, et al. Defining inflammatory cell states in rheumatoid arthritis joint synovial tissues by integrating single-cell transcriptomics and mass cytometry. Nat Immunol. 2019;20(7):928–942. doi: 10.1038/s41590-019-0378-1. [DOI] [PMC free article] [PubMed] [Google Scholar]
- 19.Michel T, et al. Human CD56bright NK Cells: An Update. J Immunol. 2016;196(7):2923–2931. doi: 10.4049/jimmunol.1502570. [DOI] [PubMed] [Google Scholar]
- 20.Hirose S, Lin Q, Ohtsuji M, Nishimura H, Verbeek JS. Monocyte subsets involved in the development of systemic lupus erythematosus and rheumatoid arthritis. Int Immunol. 2019;31(11):687–696. doi: 10.1093/intimm/dxz036. [DOI] [PMC free article] [PubMed] [Google Scholar]
- 21.Butler A, Hoffman P, Smibert P, Papalexi E, Satija R. Integrating single-cell transcriptomic data across different conditions, technologies, and species. Nat Biotechnol. 2018;36(5):411–420. doi: 10.1038/nbt.4096. [DOI] [PMC free article] [PubMed] [Google Scholar]
- 22.Liberzon A, Birger C, Thorvaldsdóttir H, Ghandi M, Mesirov JP, Tamayo P. The Molecular Signatures Database (MSigDB) hallmark gene set collection. Cell Syst. 2015;1(6):417–425. doi: 10.1016/j.cels.2015.12.004. [DOI] [PMC free article] [PubMed] [Google Scholar]
- 23.Ivashkiv LB, Donlin LT. Regulation of type I interferon responses. Nat Rev Immunol. 2014;14(1):36–49. doi: 10.1038/nri3581. [DOI] [PMC free article] [PubMed] [Google Scholar]
- 24.Crow MK. Type I interferon in the pathogenesis of lupus. J Immunol. 2014;192(12):5459–5468. doi: 10.4049/jimmunol.1002795. [DOI] [PMC free article] [PubMed] [Google Scholar]
- 25.Deng Y, Tsao BP. Genetic susceptibility to systemic lupus erythematosus in the genomic era. Nat Rev Rheumatol. 2010;6(12):683–692. doi: 10.1038/nrrheum.2010.176. [DOI] [PMC free article] [PubMed] [Google Scholar]
- 26.Niewold TB, Kelly JA, Flesch MH, Espinoza LR, Harley JB, Crow MK. Association of the IRF5 risk haplotype with high serum interferon-alpha activity in systemic lupus erythematosus patients. Arthritis Rheum. 2008;58(8):2481–2487. doi: 10.1002/art.23613. [DOI] [PMC free article] [PubMed] [Google Scholar]
- 27.Rullo OJ, et al. Association of IRF5 polymorphisms with activation of the interferon alpha pathway. Ann Rheum Dis. 2010;69(3):611–617. doi: 10.1136/ard.2009.118315. [DOI] [PMC free article] [PubMed] [Google Scholar]
- 28. Sirolimus in previously treated idiopathic Multicentric Castleman Disease [press release]. https://clinicaltrials.gov/ct2/show/NCT03933904.
- 29.Livingstone M, Sikström K, Robert PA, Uzé G, Larsson O, Pellegrini S. Assessment of mTOR-Dependent Translational Regulation of Interferon Stimulated Genes. PLoS One. 2015;10(7):e0133482. doi: 10.1371/journal.pone.0133482. [DOI] [PMC free article] [PubMed] [Google Scholar]
- 30.Platanias LC. Mechanisms of type-I- and type-II-interferon-mediated signalling. Nat Rev Immunol. 2005;5(5):375–386. doi: 10.1038/nri1604. [DOI] [PubMed] [Google Scholar]
- 31.Montoya M, et al. Type I interferons produced by dendritic cells promote their phenotypic and functional activation. Blood. 2002;99(9):3263–3271. doi: 10.1182/blood.V99.9.3263. [DOI] [PubMed] [Google Scholar]
- 32.Lee PY, et al. Type I interferon modulates monocyte recruitment and maturation in chronic inflammation. Am J Pathol. 2009;175(5):2023–2033. doi: 10.2353/ajpath.2009.090328. [DOI] [PMC free article] [PubMed] [Google Scholar]
- 33.Shi C, Pamer EG. Monocyte recruitment during infection and inflammation. Nat Rev Immunol. 2011;11(11):762–774. doi: 10.1038/nri3070. [DOI] [PMC free article] [PubMed] [Google Scholar]
- 34.Gadina M. Janus kinases: an ideal target for the treatment of autoimmune diseases. J Investig Dermatol Symp Proc. 2013;16(1):S70–S72. doi: 10.1038/jidsymp.2013.29. [DOI] [PMC free article] [PubMed] [Google Scholar]
- 35.Kotyla PJ. Are Janus Kinase Inhibitors Superior over Classic Biologic Agents in RA Patients? Biomed Res Int. 2018;2018:7492904. doi: 10.1155/2018/7492904. [DOI] [PMC free article] [PubMed] [Google Scholar]
- 36.Taylor PC. Clinical efficacy of launched JAK inhibitors in rheumatoid arthritis. Rheumatology (Oxford) 2019;58(Suppl 1):i17–i26. doi: 10.1093/rheumatology/key225. [DOI] [PMC free article] [PubMed] [Google Scholar]
- 37.Verstovsek S, et al. A double-blind, placebo-controlled trial of ruxolitinib for myelofibrosis. N Engl J Med. 2012;366(9):799–807. doi: 10.1056/NEJMoa1110557. [DOI] [PMC free article] [PubMed] [Google Scholar]
- 38.Paley MA, et al. Progenitor and terminal subsets of CD8+ T cells cooperate to contain chronic viral infection. Science. 2012;338(6111):1220–1225. doi: 10.1126/science.1229620. [DOI] [PMC free article] [PubMed] [Google Scholar]
- 39.Wherry EJ, Blattman JN, Ahmed R. Low CD8 T-cell proliferative potential and high viral load limit the effectiveness of therapeutic vaccination. J Virol. 2005;79(14):8960–8968. doi: 10.1128/JVI.79.14.8960-8968.2005. [DOI] [PMC free article] [PubMed] [Google Scholar]
- 40.Stuart T, et al. Comprehensive Integration of Single-Cell Data. Cell. 2019;177(7):1888–1902.e21. doi: 10.1016/j.cell.2019.05.031. [DOI] [PMC free article] [PubMed] [Google Scholar]
Associated Data
This section collects any data citations, data availability statements, or supplementary materials included in this article.


