Abstract
BACKGROUND
Specific features of the tumor microenvironment (TME) may provide useful prognostic information. We conducted a systematic investigation of the cellular composition and prognostic landscape of the TME in gastric cancer.
METHODS
We evaluated the prognostic significance of major stromal and immune cells within the TME. We proposed a composite TME-based risk score and tested it in 6 independent cohorts of 1678 patients with gene expression or IHC measurements. Further, we devised a patient classification system based on TME characteristics.
RESULTS
We identified NK cells, fibroblasts, and endothelial cells as the most robust prognostic markers. The TME risk score combining these cell types was an independent prognostic factor when adjusted for clinicopathologic variables (gene expression, HR [95% CI], 1.42 [1.22–1.66]; IHC, 1.34 [1.24–1.45], P < 0.0001). Higher TME risk scores consistently associated with worse survival within every pathologic stage (HR range, 2.18–3.11, P < 0.02) and among patients who received surgery only. The TME risk score provided additional prognostic value beyond stage, and combination of the two improved prognostication accuracy (likelihood-ratio test χ2 = 235.4 vs. 187.6, P < 0.0001; net reclassification index, 23%). The TME risk score can predict the survival benefit of adjuvant chemotherapy in nonmetastatic patients (stage I–III) (interaction test, P < 0.02). Patients were divided into 4 TME subtypes that demonstrated distinct genetic and molecular patterns and complemented established genomic and molecular subtypes.
CONCLUSION
We developed and validated a TME-based risk score as an independent prognostic and predictive factor, which has the potential to guide personalized management of gastric cancer.
FUNDING
This project is partially supported by NIH grant 1R01 CA222512.
Keywords: Oncology
Keywords: Gastric cancer
Introduction
Gastric cancer (GC) is a heterogeneous disease with diverse clinical, histological, and molecular characteristics (1). When diagnosed at early stages, GC can be effectively treated with endoscopic or surgical resection with or without adjuvant therapy. However, survival outcomes can vary widely among patients receiving the same treatment for disease of the same stage (2, 3). There is a critical unmet need for accurate prognostication tools beyond the current staging system to better guide adjuvant treatment. On the other hand, the prognosis for advanced GC is extremely poor, with a median survival less than 1 year. New, effective treatments are needed to prolong survival for patients with metastatic disease.
Recent whole-genome and transcriptome studies have significantly improved our understanding of the pathobiology and molecular alterations of GC. The Cancer Genome Atlas (TCGA) divided GC into 4 subtypes based on genomic characteristics: EBV, microsatellite instability (MSI), genomically stable (GS), and chromosomal instability (CIN) (4). The Asian Cancer Research Group (ACRG) proposed another molecular classification system of 4 subtypes that demonstrated distinct prognoses, most notably between microsatellite-stable/epithelial-mesenchymal transition (MSS/EMT) subtypes (5). Subsequent studies defined alternative patient clusters that largely overlapped with ACRG subtypes and in part validated these findings (6, 7). The existing subtypes are focused on cancer cell–intrinsic molecular characteristics of the tumor (8–10).
Solid tumors are a complex ecosystem that does not only consist of neoplastic cells, but also includes a variety of nonmalignant cell types, such as stromal and immune cells, which together with soluble factors and extracellular matrix constitute the tumor microenvironment (TME) (11). The TME plays an important role in cancer progression, metastasis, therapeutic response, and resistance (12, 13). Specific features of the TME have been shown to provide useful prognostic and predictive information in multiple cancers (14–17). More importantly, various components of the TME represent potential therapeutic targets (18). Immunotherapy, and in particular, immune check inhibitors, has been the most promising treatment strategy in the past decade (19, 20). However, the response rates remain relatively low at around 15% in the phase III KEYNOTE-062 trial (21). Novel strategies and combination therapies are needed to improve response and survival. This will require a deeper understanding of the TME and its clinical significance.
In this work, we conducted a systematic evaluation of the cellular composition and prognostic landscape of the TME in GC. We proposed a TME-based risk score and validated its prognostic and predictive significance in multiple independent cohorts using both gene expression profiles (GEPs) and IHC measurements. Further, we devised what we believe to be a novel patient classification system based on TME characteristics and showed that these subtypes were associated with distinct molecular, genomic, and cytokine profiles. Critically, our proposed TME subtypes demonstrated complementary prognostic value to established molecular subtypes.
Results
Development of the TME risk score.
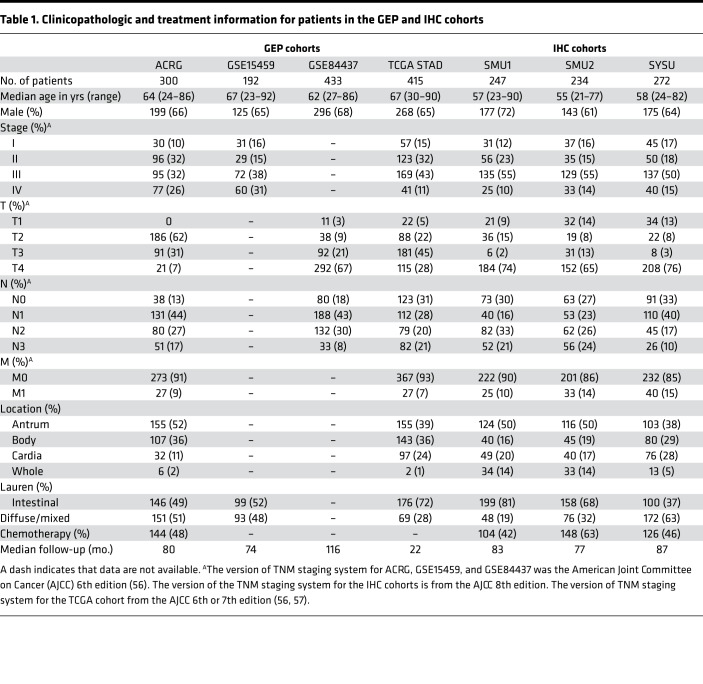
The TME plays a critical role in cancer progression and metastasis and may be targeted to improve therapeutic response and survival. Here, we conducted a systematic investigation into the prognostic landscape and therapeutic relevance of major stromal and immune cells in the TME of GC. Details about the study design and patient cohorts can be found in the Methods, the Supplemental Methods, Supplemental Figure 1 (supplemental material available online with this article; https://doi.org/10.1172/jci.insight.136570DS1), and Table 1. In the ACRG cohort, the abundance levels of 3 cell types, namely, NK cells, endothelial cells, and fibroblasts, was significantly associated with overall survival in Cox regression analysis (P < 0.0005, Supplemental Figure 2A). Their prognostic value was independent of pathological stage and adjuvant chemotherapy (P < 0.03, Supplemental Figure 2B). Consistently, the same 3 cell types were the most important variables among TME cell types for predicting overall survival using the random survival forest algorithm (Supplemental Figure 2C). Thus, among major cellular components in the TME, NK cells, fibroblasts, and endothelial cells were identified as the most robust prognostic markers in GC.
Table 1. Clinicopathologic and treatment information for patients in the GEP and IHC cohorts.
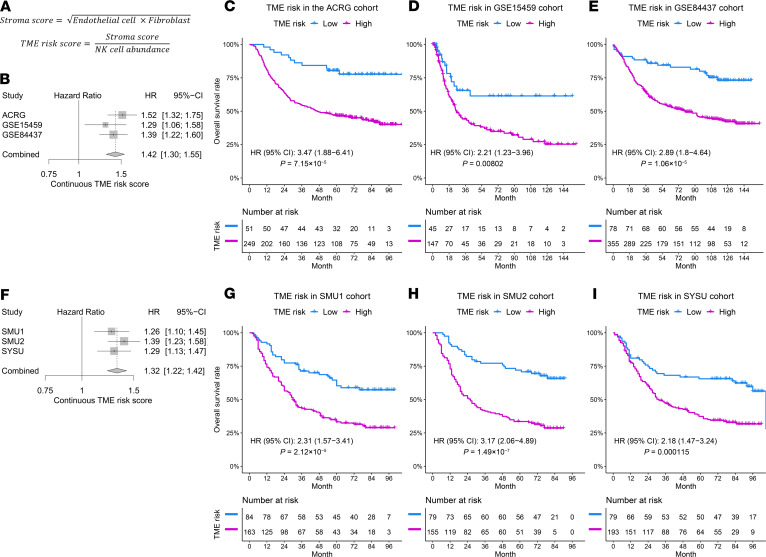
There was a high positive correlation (Pearson’s r = 0.73) between the abundance of fibroblasts and endothelial cells in the TME (Supplemental Figure 2D). Given the collinearity and similar adverse effects on prognosis, we combined the endothelial cells and fibroblasts into a stroma score by taking the square root of their product to reflect the overall stroma status (Figure 1A). As expected, the stroma score was highly correlated the endothelial cell and fibroblast abundance (both Pearson’s r > 0.91) but did not correlate with the NK cell abundance (Pearson’s r = –0.28, Supplemental Figure 2D). We further explored the correlation of NK cell abundance and the stroma score with other cell types or established signatures. The abundance of NK cells weakly or moderately correlated with T cell and CD8 T cell abundance and the T cell–inflamed signature (22) (Supplemental Figure 3, A and B). On the other hand, the proposed stroma score highly correlated with the EMT score (5, 23), fibroblast signatures (24), and the estimated fraction of stromal cells by the ESTIMATE algorithm (25) in all GEP cohorts (Supplemental Figure 3C). Bivariate analysis revealed independent, opposite prognostic effects of the NK cells (HR [95% CI], 0.42 [0.27–0.65], P = 0.00011) and stroma score (HR [95% CI], 1.37 [1.08–1.73], P = 0.009). Based on these results, we defined a continuous TME risk score as the ratio of the stroma score to NK cell abundance, which summarizes the overall prognostic effects of the TME based on the expression of 50 marker genes (Supplemental Table 1 and Figure 1A).
Figure 1. Prognostic significance of the TME risk score in the GEP and IHC cohorts.
(A) The formula to define the TME risk score. The abundance level of each cell type is calculated by taking the average expression of preselected marker genes listed in Supplemental Table 2. (B) Increased TME risk score was significantly correlated with inferior overall survival in all 3 GEP cohorts (ACRG, n = 300; GSE15459, n = 192; and GSE84437, n = 433). A fixed-effect model indicated a strong overall prognostic effect of the TME risk score. Cox regression was used to measure the prognostic effects of the TME risk score. (C–E) The high TME risk group was associated with worse overall survival in these cohorts (ACRG, n = 300; GSE15459, n = 192; and GSE84437, n = 433). The GEP cutoff value for TME risk score was defined by optimizing the Cox regression P value in the ACRG cohort. (F–I) Same as in C–E with for 3 IHC cohorts (SMU1, n = 247; SMU2, n = 234; and SYSU, n = 272). The IHC cutoff value was defined by optimizing the Cox regression P value in the SMU1 cohort. HRs and CIs were estimated by Cox regression. P values were generated by log-rank test.
Validation of the TME risk score as an independent prognostic factor.
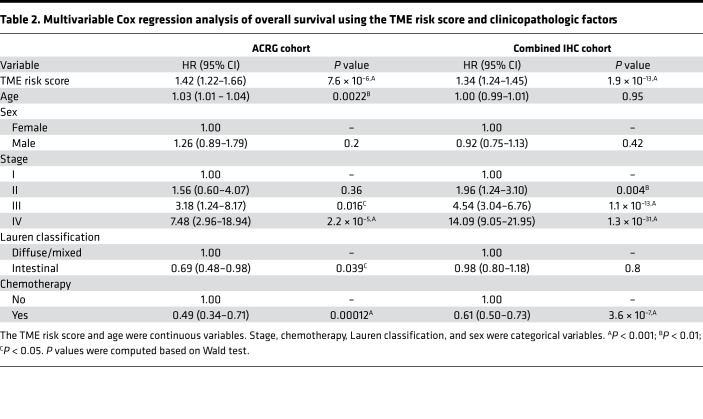
In multivariable Cox regression analysis, the continuous TME risk score was an independent prognostic factor for overall survival when adjusted for clinicopathologic factors, including age, sex, stage, Lauren histology type, and use of adjuvant chemotherapy in the ACRG cohort (Table 2). We independently confirmed the prognostic value of the TME risk score in 2 additional microarray gene expression cohorts (Figure 1, B–E). In both GEP validation cohorts, the TME risk score was significantly correlated with survival (Figure 1B), adjusting for clinicopathologic factors as well as microsatellite status (Supplemental Table 2). A meta-analysis of the 3 GEP cohorts indicated that the TME risk score was a strong prognostic factor (HR [95% CI], 1.42 [1.30–1.55], P < 0.0001, Figure 1B). In addition, we confirmed the independent prognostic effects of NK cell abundance and stroma score in the combined GEP validation cohorts (Supplemental Figure 4A). To stratify patients into low- and high-risk groups, we defined a cutoff value for the TME risk score (cutoffGEP = 1.78) based on the ACRG cohort while controlling for major confounding factors, i.e., treatment and stage (Supplemental Figure 5A). In all 3 GEP cohorts, we observed significantly worse survival in the high TME risk group (HR ranges from 2.21 to 3.47, all P < 0.01, Figure 1, C–E).
Table 2. Multivariable Cox regression analysis of overall survival using the TME risk score and clinicopathologic factors.
To further validate its prognostic value, we retrospectively analyzed data in 3 IHC cohorts and assessed the association of our TME risk score with overall survival. Consistent with the results in GEP cohorts, the continuous TME risk score was significantly correlated with overall survival in all 3 IHC cohorts with an overall HR [95% CI] of 1.32 [1.22–1.42] (P < 0.0001, Figure 1F). In addition, we confirmed the independent prognostic effects of NK cell abundance and stroma score in the combined IHC validation cohorts (Supplemental Figure 4B). Similar to that in the gene expression analysis, we defined an optimal cutoff value for the TME risk score (cutoffIHC = 0.59, Supplemental Figure 5B) based on the SMU1 cohort. Again, patients in the high TME risk group had significantly worse overall survival in all 3 IHC cohorts (HR ranges from 2.18 to 3.17; all P < 0.0005, Figure 1, G–I). In multivariable Cox analysis, the prognostic value of the continuous TME risk score was independent of major clinicopathologic factors in the IHC cohorts (Table 2).
We investigated whether the proposed TME risk score would provide any additional prognostic information to clinical risk factors. In the combined IHC cohort, we compared the goodness of fit for the composite Cox regression model (TME risk score and stage) with the model only including stage by the likelihood-ratio test, which was statistically significant (composite model, χ2 = 235.4 vs. stage only, χ2 = 187.6, P = 4.67 × 10⁻¹²), indicating the additive value of the TME risk score for prognostication. We also quantified the relative improvement in accuracy for prediction of 5-year overall survival between the 2 models, which showed a continuous net reclassification index of 23.3%.
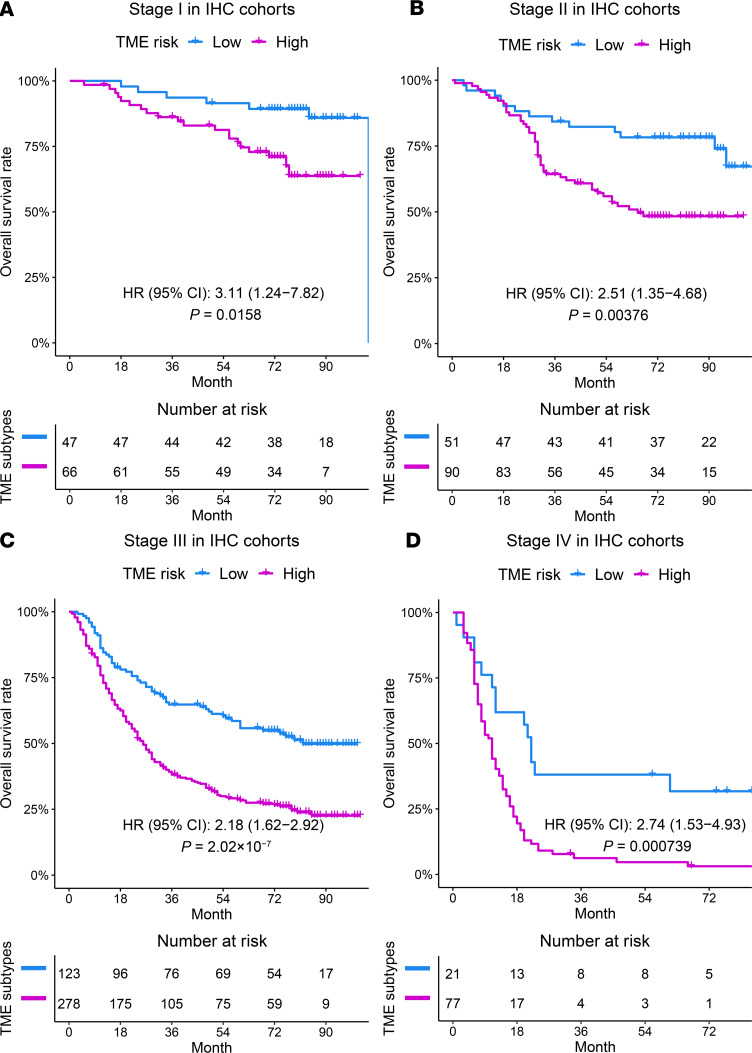
Finally, we examined the prognostic significance of the TME risk score at different stages and in different treatment subgroups. Within every pathologic stage (I–IV), a higher TME risk score was consistently associated with worse survival in the combined GEPs (Supplemental Figure 6) as well as IHC cohort (Figure 2). In addition, the prognostic value of the TME risk score was confirmed in patients who underwent surgery alone without adjuvant chemotherapy in the ACRG and each IHC validation cohort (Supplemental Figure 7).
Figure 2. The prognostic effects of the TME risk score in patients within each pathological stage in the combined IHC cohorts.
A high TME risk score was consistently associated with worse overall survival in patients with stage I (n = 113, A), stage II (n = 141, B), stage III (n = 401, C), and stage IV (n = 98, D) disease. The cutoff value for the TME risk score was the same as in Figure 1. HRs and CIs were estimated by Cox regression. P values were generated by log-rank test.
Association between the TME risk score and benefit from chemotherapy.
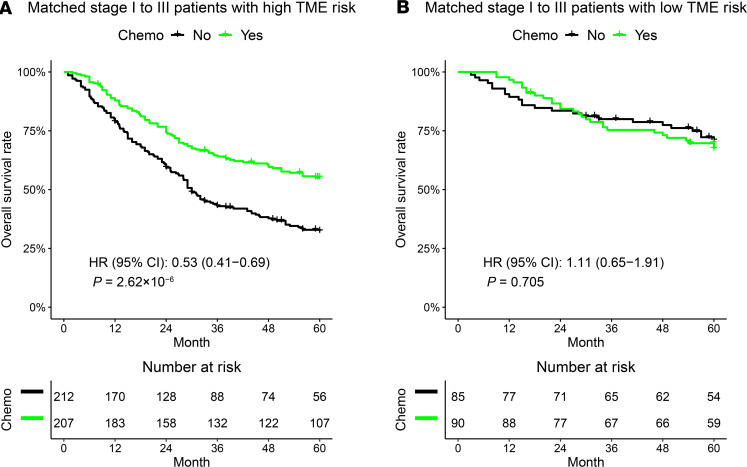
We tested the ability of the TME risk score to predict the benefit of adjuvant chemotherapy in patients with nonmetastatic GC (stage I–III) by merging the ACRG and 3 IHC cohorts. Before conducting the statistical test, the patients with or without adjuvant chemotherapy were matched with regard to 5 clinicopathologic factors to mitigate the potential selection bias in retrospective cohorts. As shown in Figure 3A, patients with a high TME risk score derived a significant survival benefit from adjuvant chemotherapy (HR [95% CI], 0.53 [0.41–0.69], P < 0.0001). On the other hand, patients at a low TME risk score did not benefit from adjuvant chemotherapy (HR [95% CI], 1.11 [0.65–1.91], P = 0.705, Figure 3B). A formal interaction test between the TME risk group and treatment was statistically significant (P = 0.0148), indicating a predictive effect for the benefit from adjuvant chemotherapy. Similar results were observed using all the patients without matching (Supplemental Figure 8).
Figure 3. Predictive relevance of the TME risk score for the benefit of chemotherapy in stage I–III gastric cancer.
(A) Patients with a high TME risk score (n = 419) derived a significant survival benefit from adjuvant chemotherapy at 5 years. However, patients with a low TME risk score (n = 175) did not benefit from adjuvant chemotherapy (B). The patients treated with or without chemotherapy were matched according to 5 clinicopathologic factors. HRs and CIs were estimated by Cox regression. P values were generated by log-rank test. The P value for the interaction between the TME risk group and adjuvant chemotherapy was 0.0148.
Identification of the TME subtypes.
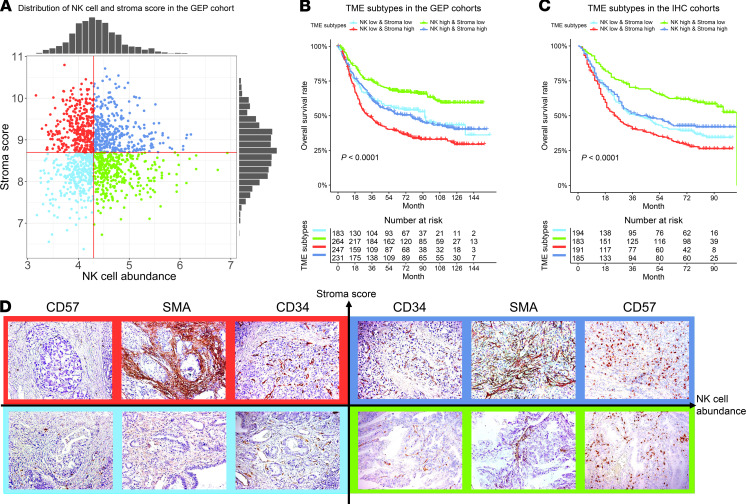
To elucidate the molecular and genomic characteristics related to the prognostic cell types in TME, we divided patients into 4 TME subtypes based on the abundance level of NK cells and stroma score (Figure 4A). The TME subtypes were associated with distinct prognoses, with a similar pattern between the combined GEP cohort and combined IHC cohort (both P < 0.0001, Figure 4, B and C). Specifically, patients in the NK-high and stroma-low subgroup had the best prognosis; patients in the NK-low and stroma-high subgroup had the worst prognosis; the remaining 2 subtypes were associated with intermediate prognoses. Some representative examples of IHC images for 4 TME subtypes are shown in Figure 4D.
Figure 4. The definition of the TME subtypes and their prognostic significance.
(A) Patients were divided into 4 TME subtypes, based on the distribution of NK cell abundance and stroma scores in the merged GEP cohorts (n = 1340). In the merged GEP cohorts (except TCGA) (n = 925) (B) and IHC cohorts (n = 753) (C), the NK-high and stroma-low and NK-low and stroma-high groups correspond to the best and the worst prognosis, respectively. The NK-high and stroma-high and NK-low and stroma-low subtypes were associated with an intermediate prognosis. (D) Representative examples of IHC images for 4 TME subtypes. CD57, CD34, and αSMA are stains for NK cells, endothelial cells, and fibroblasts. Original magnification, ×200. P values were generated by log-rank test.
Complementary value of the TME subtypes to ACRG molecular subtypes.
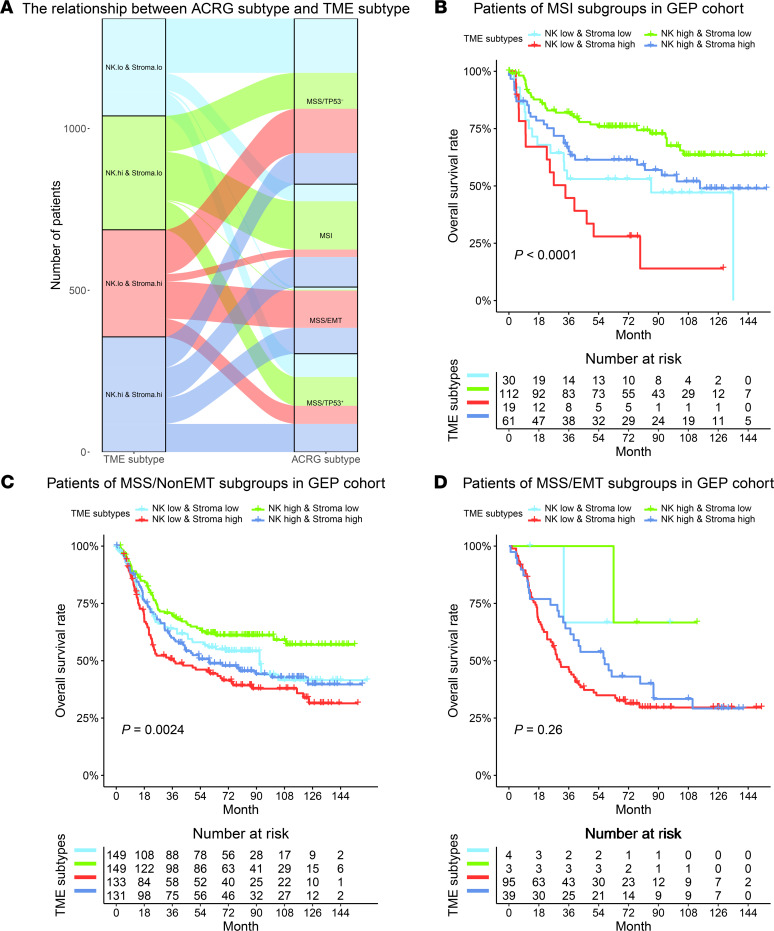
We compared the proposed TME subtypes with the established ACRG subtypes for GC, which were defined by cancer cell–intrinsic molecular features. While the ACRG MSI and MSS/EMT subtypes were enriched with patients predicted to be NK high and stroma high, respectively, the distribution of the TME subtypes within the ACRG MSS/non-EMT subtypes was relatively balanced (Figure 5A). Importantly, we found that the TME subtypes provided complementary prognostic value to the ACRG subtypes (Figure 5, B–D). Within the ACRG MSI subtype, which is known to have favorable outcomes, our TME subtypes can still distinguish subgroups of patients with distinct prognoses (P < 0.0001, Figure 5B). Similarly, within the ACRG MSS/non-EMT subtypes, patients were divided into 4 different prognostic groups by the TME subtypes (P = 0.0024, Figure 5C).
Figure 5. Complementary prognostic value of the TME subtypes to the ACRG subtypes.
(A) The correspondence between patients classified according to the TME subtypes and ACRG subtypes in the merged GEP cohorts (n = 1340). (B and C) The TME subtypes can further stratify patients within the ACRG MSI (n = 222) and MSS/TP53+/– (n = 562) subtypes into groups with distinct prognoses. The survival difference within the ACRG MSS/EMT (n = 141) subgroup showed a trend due to a smaller number of patients (D). P values were generated by log-rank test.
Complementary value of the TME subtypes to intrinsic subtypes for GC.
We found that 2 TME subtypes with a high stroma score were enriched for the G-DIF intrinsic molecular subtype and vice versa (Supplemental Figure 9A). This relation is expected given our current understanding of GC. Within the G-INT subtype, the prognostic effect of the TME subtypes was well preserved (Supplemental Figure 9B). For the G-DIF subtype, the NK-high and stroma-low subtype confers a better prognosis compared with others (Supplemental Figure 9C). Again, these results showed that the proposed TME-based subtypes provide additional information to tumor-intrinsic classification systems.
Relation between the TME subtypes and TCGA genomic subtypes.
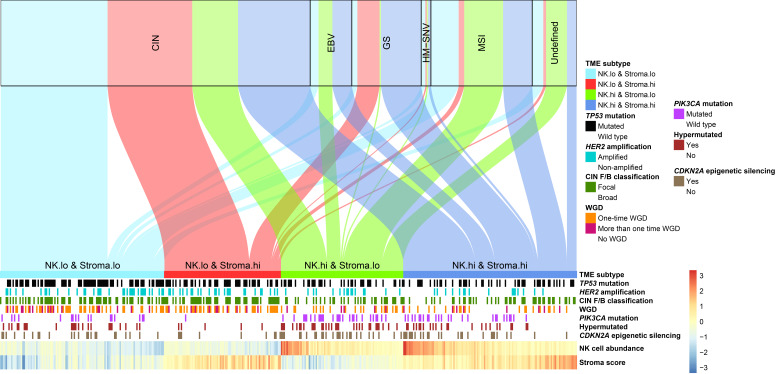
We compared our TME subtypes with the 5 genomic subtypes defined by TCGA research group (Figure 6). Similar to the comparison with ACRG subtypes, TCGA MSI subtype was enriched, with patients predicted to be NK high (67%); the NK-low and stroma-high subtype only accounted for 6% of the MSI subtype. The majority (90%) of patients in TCGA GS subtype had a stroma-high phenotype (58% NK high, 32% NK low), while TCGA EBV subtype mainly (80%) consisted of patients with an NK-high phenotype (47% stroma high, 33% stroma low). On the other hand, the distribution of the TME subtypes was relatively balanced within the dominant TCGA subtype, CIN, with a slight bias toward patients with a NK-low phenotype relative to those with NK-high phenotype (62% vs. 38%). Therefore, the proposed TME subtypes and TCGA genomic subtypes were related but largely nonredundant classification systems.
Figure 6. The correspondence between patients classified according to TCGA subtypes and the TME subtypes in TCGA cohort.
Genomic features that were significantly enriched in certain TME subtypes in TCGA STAD cohort (n = 415) are presented.
Genetic alterations associated with TME subtypes.
We evaluated the genetic characteristics of the TME subtypes by leveraging the comprehensive genomic data available in TCGA stomach adenocarcinoma (STAD) cohort. This evaluation was done separately for the 2 key features (NK cell abundance and stroma score) because they were largely independent of each other (Figure 4A). The features only correlated with NK cell status were presented in Supplemental Figure 10. The most striking observation was that tumors with an NK-low status were more likely to have an instable genome and a higher level of aneuploidy (Supplemental Figure 10A). What’s more, these tumors demonstrated a higher clonal deletion score, frequency of CIN focal events and increased arm-level copy number variations (Supplemental Figure 10, B–D). The overall ploidy and whole genome doubling events were also markedly associated with low NK cell level (Supplemental Figure 10, E and F). In addition, we observed that the low NK status was associated with increased rates of HER2 amplification and TP53 mutation (Supplemental Figure 10, G and H). On the other hand, tumors with a high NK status were characterized by PIK3CA mutation (Supplemental Figure 10I) and elevated rates of epigenetic silencing of CDKN2A (Supplemental Figure 10J). What’s more, we have reassessed the distribution of PIK3CA and TP53 mutations across TME subtypes by focusing on the subgroups of patients as defined by either MSI or T cell inflammation status. We found that the differential mutation status for both genes still holds in the MSS group as well as the T cell inflammation–high and –low groups (Supplemental Figure 11). The only exception is the MSI-H group, which may partly be due to a limited number of MSI patients (n = 96). Three genomic features were correlated with varying stroma status, i.e., SNV density, indel density, and mutation density, the higher levels of which were all markedly correlated with stroma-low status (Supplemental Figure 12).
Four genomic features, i.e., percentage of hypermutation, the number of focal CNV events, focal CNV amplification, and focal CNV deletion events, were markedly correlated with both NK cell and stroma status (Supplemental Figure 13). Specifically, a higher level of NK cell infiltration or lower level of stroma status associated with higher rates of hypermutation (Supplemental Figure 13A). Increased focal CNV events (both deletion and amplification) were observed to be enriched in patients with low-NK or low-stroma status (Supplemental Figure 13, B–D). Of note, we observed similar patterns when specifically focusing on the CIN subgroup, which indicated the above observation was not confounded by the MSI or EBV status (Supplemental Figure 14).
Gene expression, molecular pathways, and cytokines correlated with stroma and NK cell infiltration.
Meta-analysis of 4 GEP cohorts identified robust correlation between NK cell abundance and expression of specific genes and molecular pathway activity. At the individual gene level, we found that NKG2A, an NK cell inhibitory receptor, had the highest correlation with the amount of NK cell infiltration in the TME (meta-analysis with Pearson’s r = 0.73, Supplemental Table 3). Several other NK cell–activating or inhibitory receptors were also highly correlated with NK cell infiltration, including KIR3DL2, NKG2C/E, CD94, and CD244, along with genes related to immune-mediated cytolytic activity, such as FASLG, PRF1, and GZMA/B (Supplemental Table 3).
At the pathway level, we found that the interferon-γ signaling pathway was correlated with an increased level of NK cell infiltration, which is consistent with a preexisting antitumor immune response. By contrast, the hedgehog and Wnt/β catenin signaling pathways were correlated with decreased NK cell infiltration (Supplemental Figure 15 and Supplemental Table 4). On the other hand, the TME stroma score was positively correlated with the EMT and angiogenesis pathways, while it was negatively correlated with cell cycle and proliferation, such as MYC and E2F pathways (Supplemental Figure 16 and Supplemental Table 4).
Since cytokines are key regulators of cellular migration and composition in the TME, we next identified differentially expressed cytokines related to the NK and stroma status. A total of 17 cytokines were differentially expressed (all upregulated) in the NK-high group, including IL1, IFNγ, and FasL, which is consistent with an active inflammatory response and cytolytic activity (Supplemental Figure 17A). The chemokines CXCL9, -10, and -11, which mediate immune cell migration, differentiation, and activation (26), were also upregulated in the NK-high group. On the other hand, cytokines upregulated in the stroma-high group were mostly related to an immunosuppressive function, such as IL6, TGFB3, and BMP6, in the TGF-β signaling pathway (Supplemental Figure 17B).
In summary, these TME subtypes demonstrated distinct genetic and molecular patterns, including aneuploidy; somatic mutation load; interferon-γ, hedgehog, and Wnt/β catenin signaling pathway activation; and distinct cytokine profiles.
Discussion
In this study, we developed a TME-based risk score by integrating immune and stromal signatures and validated it as an independent prognostic factor in multiple gene expression and IHC cohorts of 1678 patients with GC. The TME risk score provided additional information beyond the current staging system for improved risk stratification and could potentially guide personalized management of resected GC regarding adjuvant chemotherapy. Further, we proposed 4 TME subtypes as defined by the NK cell abundance and stroma score, which were associated with distinct molecular, genomic, and cytokine profiles. These TME subtypes reflect differing aspects of the tumor biology and complement-established genomic subtypes, which may be used to refine molecular classification of GC.
Our work adds to a growing body of literature supporting the critical role of the TME in cancer progression and its therapeutic relevance (13, 27, 28). Specifically, we demonstrate that stroma score and NK cell abundance are independent prognostic factors in GC. Stromal gene signatures have been consistently shown to correlate with a poor prognosis in gastrointestinal cancers (29, 30), including GC (31). Cancer-associated fibroblasts are one of the most abundant stromal cells in the TME and are known to be a driver of cancer progression and therapeutic resistance (32). Cheong et al. recently developed a predictive biomarker for chemotherapy response in GC based on 4 genes related to immune, stem-like, and epithelial signatures (13). Tumor angiogenesis is induced by various growth factors such as VEGF in the TME and significantly contributes to tumor progression and metastasis (18, 33). One recent study (34) investigated stromal gene expression signatures of GC and confirmed the prognostic value of the vascular signature driven by angiogenesis. Our composite stroma score combines both fibroblasts and endothelial cells, which may serve as a more robust prognostic biomarker.
One finding of our study that we believe to be novel is the discovery of NK cells as an orthogonal prognostic factor with an opposite effect compared with tumor stroma. NK cells are innate lymphoid cells widely known for their ability to exert robust cytotoxic function against viral infection, and they play a prominent role in the control of cancer metastasis (35). However, the relevance of NK cells in the immunosurveillance of primary solid tumors remains controversial. Our data show that higher abundance of NK cells in the TME consistently confers a favorable prognosis, independent of the stroma score across multiple cohorts of patients with GC. In addition, we found that tumors with an NK-low phenotype had an increased level of aneuploidy, which is consistent with the fact that aneuploidy correlates with immune evasion and is a marker of aggressive disease and unfavorable outcome (36). Beyond genomic factors, we showed that hedgehog and Wnt/β catenin signaling pathway activation was correlated with reduced NK cell infiltration in GC, also consistent with recent reports that correlated these pathways with immune evasion across human cancers (37, 38).
There is a growing interest in developing therapeutic strategies to increase the infiltration and improve the function of NK cells in the TME (39); these may synergize with current immunotherapies primarily targeting T cells. It has recently been shown that NK cells are a cytolytic effector against PD-L1–negative tumors treated with anti–PD-L1 antibody (40), and NK cells stimulate the recruitment of type I conventional dendritic cells and CD8+ T cells into the tumor (41). Further, an increased NK cell infiltration in the TME is associated with an improved response to immune checkpoint blockade (42). In our study, we found that several inhibitory receptors, including NKG2A/C/E, KIR3DL2, and CD94, were highly expressed on NK cells in the GC TME (Supplemental Table 3). As the activity of tumor-infiltrating NK cells is strongly suppressed, these inhibitory molecules may be targeted to restore NK cell function (43). Indeed, 2 recent studies demonstrated that NKG2A blockade in combination with a tumor-specific vaccine or antibody improved immunotherapy response and outcomes (44, 45).
In our study, we did not find that the amount of CD8+ T lymphocytes represents a robust prognostic factor, which is in line with previous reports of inconsistent results (46, 47). This could be due to a lower tumor mutational burden in GC compared with other more immunogenic tumors, leading to an immune-cold or immune-excluded phenotype (48). Alternatively, potent factors in the TME such as TGF-β could also suppress immune function, leading to T cell exhaustion (49).
Strengths of our study include independent validation of the results in multiple patient cohorts, and the use of 2 different methodologies, including GEPs and clinically applicable IHC assays in FFPE tissue samples, which can reduce potential biases and enhance reproducibility of the findings. In the future, gene expression assays of our TME risk score using qPCR or nCounter systems may be developed to facilitate its practical use. Our study is mainly limited by its retrospective nature and use of patient cohorts with nonrandomized treatment, which makes it challenging to assess the predictive value in a therapeutic setting. The TME risk score only included the major immune and stromal cell types. Incorporating specific phenotypic or functional subsets (such as M2 macrophages) might improve the prognostic value, albeit with an increased complexity. Finally, our study included patients primarily of the Asian origin who received adjuvant chemotherapy. The generalizability of our findings in the neoadjuvant setting among non-Asian populations (50) should be tested in future studies.
In summary, we developed and validated a TME-based risk score as an independent prognostic factor in GC and proposed TME subtypes with distinct molecular, genomic, and cytokine profiles. Our findings provide potentially new insights into the prognostic landscape of the TME in GC, which warrant further validation in prospective studies.
Methods
Patients and data.
We retrospectively analyzed data for patients who were diagnosed with primary GC and treated with surgical resection. For discovery purposes, we used the ACRG cohort of 300 patients for whom microarray GEPs as well as detailed patient-level clinical and treatment information are publicly available (GEO GSE62254) (5). For validation purposes, we used 2 additional microarray GEP cohorts measuring fresh-frozen tissue of large sample sizes (GEO GSE84437, ref. 13, n = 433 and GEO GSE15459, ref. 51): n = 192) with survival. For further validation, we used 3 independent IHC cohorts (denoted as SMU1, SMU2, and SYSU) of 753 patients who were consecutively treated between 2005 and 2009 at 2 medical centers. Finally, we used TCGA STAD data to evaluate the genetic and molecular characteristics of our TME subtypes.
Discovery and validation of a TME-based risk score.
Given the bulk gene expression data, we computed the absolute abundance levels of the major cell types in the TME, including 8 immune and 2 stromal cell types (fibroblasts and endothelial cells) by averaging the expression of a set of carefully selected marker genes (Supplemental Table 1) provided by the Microenvironment Cell Populations–counter (MCP-counter) algorithm (52). The main reason to use the MCP-counter algorithm is that it provides an estimation of the absolute abundance of cellular components in the TME and, therefore, meaningful comparisons can be made across different samples. By contrast, several other algorithms such as ESTIMATE only provide the fraction of stromal and immune cells as a whole. On the other hand, CIBERSORT generates the relative fractions of 22 immune cells. However, these fractions are normalized within a sample and, thus, not comparable across samples.
We independently assessed the prognostic effects of these cell types using two different approaches (Cox regression analysis and random survival forest model) in the ACRG cohort. Those cell types that demonstrated a consistent prognostic significance in both models were selected for subsequent analyses. After identifying cell types with the most robust prognostic value, we integrated them into a composite TME risk score by considering their pairwise correlation and effect on survival. The prognostic significance of the TME risk score was independently tested in 2 additional GEP cohorts and 3 IHC cohorts. The IHC-based TME risk score was derived using the same formula, where semiquantitative evaluation of stains for established cell markers was performed. Details about these analyses can be found in the Supplemental Methods.
TME-based subtypes and molecular characterization.
Based on the cellular composition of the TME, we stratified patients into 4 distinct groups, i.e., TME subtypes. We compared our TME subtypes with the existing ACRG molecular subtypes (5) and the intrinsic subtypes for GC (8) as well as TCGA genomic subtypes (53), in terms of patient assignment and prognostic stratification. We evaluated the genetic and molecular characteristics of our TME subtypes, including genetic or epigenetic alterations of specific driver genes, genome/chromosome instability, and mutational burden. In addition, we reassessed the differential patterns of certain genomic features across TME subtypes by focusing on subgroups of patients defined by MSI, T cell inflamed–, or CIN status. Finally, we investigated gene expression, cancer hallmark pathway activity, and soluble factors correlated with infiltration of prognostic relevant cell types in the TME. Details are presented in the Supplemental Methods.
Statistics.
The Cox regression model was used to assess the prognostic effect of continuous variables. A fixed-effect model was used to summarize the prognostic effect of the TME risk score in the GEP and IHC cohorts. We performed multivariable Cox regression analyses to assess the independent prognostic value of the TME risk score by adjusting for clinicopathologic factors. The log-rank test was used to evaluate the survival difference among different patient groups. We used the likelihood-ratio test and net reclassification index (54) to assess the additive prognostic value of the TME risk score to pathological stage. P values of less than 0.05 were considered significant.
We used a multivariable Cox regression model with the main effects (TME risk group and chemotherapy) and the interaction effect (TME risk group × chemotherapy) to test the ability of the TME risk score to predict the chemotherapy benefit. To minimize selection bias and confounding effects, we used a matching strategy to balance patients within the GEP (ACRG) and IHC cohorts, respectively. We performed exact 1:1 matching of nonmetastatic patients (stage I–III) who received chemotherapy versus those who did not according to 5 clinicopathologic factors, including stage, age (>50 years), sex, Lauren histology type, and tumor location. We also tested the predictive effect of the TME risk group in the merged unmatched cohorts.
The χ2 and Mann-Whitney tests were used to assess the difference among TME subgroups regarding categorical and continuous genomic features, respectively. Fisher’s Z transformation of correlation was used to assess the overall correlation of single gene and pathway activity with NK cell abundance or stroma score in different cohorts. Differentially expressed cytokine genes were identified via limma (55). The Benjamini-Hochberg method was used to compute the FDR to adjust for multiple testing. More details are presented in the Supplemental Methods. All statistical analyses were performed in R version 3.5.3.
Study approval.
This study was approved by the institutional review board of each participating center at Stanford University School of Medicine and Southern Medical University and conducted in accordance with ethical guidelines, such as the Declaration of Helsinki. Informed consent for patients in the GEP cohort was waived, given the use of existing, deidentified public data sets. Written informed consent was obtained from all the enrolled patients in the IHC cohort.
Author contributions
BL, YJ, GAF, and RL designed the study. BL, YJ, and GL conducted the experiments and gathered the data. GL, GAF, and RL supervised the design, analysis, and study interpretation. BL, YJ, and RL wrote the manuscript.
Supplementary Material
Acknowledgments
This project is partially supported by NIH grant 1R01 CA222512.
Version 1. 03/31/2020
In-Press Preview
Version 2. 05/07/2020
Electronic publication
Footnotes
Conflict of interest: The authors have declared that no conflict of interest exists.
Copyright: © 2020, American Society for Clinical Investigation.
Reference information: JCI Insight. 2020;5(9):e136570.https://doi.org/10.1172/jci.insight.136570.
Contributor Information
Bailiang Li, Email: bli2@stanford.edu.
Yuming Jiang, Email: jiangymbest@163.com.
Guoxin Li, Email: gzliguoxin@163.com.
Ruijiang Li, Email: rli2@stanford.edu.
References
- 1.Ajani JA, Lee J, Sano T, Janjigian YY, Fan D, Song S. Gastric adenocarcinoma. Nat Rev Dis Primers. 2017;3:17036. doi: 10.1038/nrdp.2017.36. [DOI] [PubMed] [Google Scholar]
- 2.Noh SH, et al. Adjuvant capecitabine plus oxaliplatin for gastric cancer after D2 gastrectomy (CLASSIC): 5-year follow-up of an open-label, randomised phase 3 trial. Lancet Oncol. 2014;15(12):1389–1396. doi: 10.1016/S1470-2045(14)70473-5. [DOI] [PubMed] [Google Scholar]
- 3.Sasako M, et al. Five-year outcomes of a randomized phase III trial comparing adjuvant chemotherapy with S-1 versus surgery alone in stage II or III gastric cancer. J Clin Oncol. 2011;29(33):4387–4393. doi: 10.1200/JCO.2011.36.5908. [DOI] [PubMed] [Google Scholar]
- 4.Cancer Genome Atlas Research Network Comprehensive molecular characterization of gastric adenocarcinoma. Nature. 2014;513(7517):202–209. doi: 10.1038/nature13480. [DOI] [PMC free article] [PubMed] [Google Scholar]
- 5.Cristescu R, et al. Molecular analysis of gastric cancer identifies subtypes associated with distinct clinical outcomes. Nat Med. 2015;21(5):449–456. doi: 10.1038/nm.3850. [DOI] [PubMed] [Google Scholar]
- 6.Oh SC, et al. Clinical and genomic landscape of gastric cancer with a mesenchymal phenotype. Nat Commun. 2018;9(1):1777. doi: 10.1038/s41467-018-04179-8. [DOI] [PMC free article] [PubMed] [Google Scholar]
- 7.Zeng D, et al. Tumor microenvironment characterization in gastric cancer identifies prognostic and immunotherapeutically relevant gene signatures. Cancer Immunol Res. 2019;7(5):737–750. doi: 10.1158/2326-6066.CIR-18-0436. [DOI] [PubMed] [Google Scholar]
- 8.Tan IB, et al. Intrinsic subtypes of gastric cancer, based on gene expression pattern, predict survival and respond differently to chemotherapy. Gastroenterology. 2011;141(2):476–485. doi: 10.1053/j.gastro.2011.04.042. [DOI] [PMC free article] [PubMed] [Google Scholar]
- 9.Lei Z, et al. Identification of molecular subtypes of gastric cancer with different responses to PI3-kinase inhibitors and 5-fluorouracil. Gastroenterology. 2013;145(3):554–565. doi: 10.1053/j.gastro.2013.05.010. [DOI] [PubMed] [Google Scholar]
- 10.Bijlsma MF, Sadanandam A, Tan P, Vermeulen L. Molecular subtypes in cancers of the gastrointestinal tract. Nat Rev Gastroenterol Hepatol. 2017;14(6):333–342. doi: 10.1038/nrgastro.2017.33. [DOI] [PubMed] [Google Scholar]
- 11.Maman S, Witz IP. A history of exploring cancer in context. Nat Rev Cancer. 2018;18(6):359–376. doi: 10.1038/s41568-018-0006-7. [DOI] [PubMed] [Google Scholar]
- 12.Quail DF, Joyce JA. Microenvironmental regulation of tumor progression and metastasis. Nat Med. 2013;19(11):1423–1437. doi: 10.1038/nm.3394. [DOI] [PMC free article] [PubMed] [Google Scholar]
- 13.Cheong JH, et al. Predictive test for chemotherapy response in resectable gastric cancer: a multi-cohort, retrospective analysis. Lancet Oncol. 2018;19(5):629–638. doi: 10.1016/S1470-2045(18)30108-6. [DOI] [PubMed] [Google Scholar]
- 14.Gentles AJ, et al. The prognostic landscape of genes and infiltrating immune cells across human cancers. Nat Med. 2015;21(8):938–945. doi: 10.1038/nm.3909. [DOI] [PMC free article] [PubMed] [Google Scholar]
- 15.Pagès F, et al. International validation of the consensus Immunoscore for the classification of colon cancer: a prognostic and accuracy study. Lancet. 2018;391(10135):2128–2139. doi: 10.1016/S0140-6736(18)30789-X. [DOI] [PubMed] [Google Scholar]
- 16.Li B, Cui Y, Diehn M, Li R. Development and validation of an individualized immune prognostic signature in early-stage nonsquamous non-small cell lung cancer. JAMA Oncol. 2017;3(11):1529–1537. doi: 10.1001/jamaoncol.2017.1609. [DOI] [PMC free article] [PubMed] [Google Scholar]
- 17.Cui Y, Li B, Pollom EL, Horst KC, Li R. Integrating radiosensitivity and immune gene signatures for predicting benefit of radiotherapy in breast cancer. Clin Cancer Res. 2018;24(19):4754–4762. doi: 10.1158/1078-0432.CCR-18-0825. [DOI] [PMC free article] [PubMed] [Google Scholar]
- 18.Uhlik MT, et al. Stromal-based signatures for the classification of gastric cancer. Cancer Res. 2016;76(9):2573–2586. doi: 10.1158/0008-5472.CAN-16-0022. [DOI] [PubMed] [Google Scholar]
- 19.Shitara K, et al. Pembrolizumab versus paclitaxel for previously treated, advanced gastric or gastro-oesophageal junction cancer (KEYNOTE-061): a randomised, open-label, controlled, phase 3 trial. Lancet. 2018;392(10142):123–133. doi: 10.1016/S0140-6736(18)31257-1. [DOI] [PubMed] [Google Scholar]
- 20.Fuchs CS, et al. Safety and efficacy of pembrolizumab monotherapy in patients with previously treated advanced gastric and gastroesophageal junction cancer: phase 2 clinical KEYNOTE-059 trial. JAMA Oncol. 2018;4(5):e180013. doi: 10.1001/jamaoncol.2018.0013. [DOI] [PMC free article] [PubMed] [Google Scholar]
- 21. Tabernero J, Vet al. Pembrolizumab with or without chemotherapy versus chemotherapy for advanced gastric or gastroesophageal junction (G/GEJ) adenocarcinoma: The phase III KEYNOTE-062 study. J Clin Oncol. https://ascopubs.org/doi/abs/10.1200/JCO.2019.37.18_suppl.LBA4007.
- 22.Cristescu R, et al. Pan-tumor genomic biomarkers for PD-1 checkpoint blockade-based immunotherapy. Science. 2018;362(6411):eaar3593. doi: 10.1126/science.aar3593. [DOI] [PMC free article] [PubMed] [Google Scholar]
- 23.Loboda A, et al. EMT is the dominant program in human colon cancer. BMC Med Genomics. 2011;4:9. doi: 10.1186/1755-8794-4-9. [DOI] [PMC free article] [PubMed] [Google Scholar]
- 24.Elyada E, et al. Cross-species single-cell analysis of pancreatic ductal adenocarcinoma reveals antigen-presenting cancer-associated fibroblasts. Cancer Discov. 2019;9(8):1102–1123. doi: 10.1158/2159-8290.CD-19-0094. [DOI] [PMC free article] [PubMed] [Google Scholar]
- 25.Yoshihara K, et al. Inferring tumour purity and stromal and immune cell admixture from expression data. Nat Commun. 2013;4:2612. doi: 10.1038/ncomms3612. [DOI] [PMC free article] [PubMed] [Google Scholar]
- 26.Tokunaga R, et al. CXCL9, CXCL10, CXCL11/CXCR3 axis for immune activation - A target for novel cancer therapy. Cancer Treat Rev. 2018;63:40–47. doi: 10.1016/j.ctrv.2017.11.007. [DOI] [PMC free article] [PubMed] [Google Scholar]
- 27.Ligorio M, et al. Stromal microenvironment shapes the intratumoral architecture of pancreatic cancer. Cell. 2019;178(1):160–175.e27. doi: 10.1016/j.cell.2019.05.012. [DOI] [PMC free article] [PubMed] [Google Scholar]
- 28.Mahajan UM, et al. Immune cell and stromal signature associated with progression-free survival of patients with resected pancreatic ductal adenocarcinoma. Gastroenterology. 2018;155(5):1625–1639.e2. doi: 10.1053/j.gastro.2018.08.009. [DOI] [PubMed] [Google Scholar]
- 29.Calon A, et al. Stromal gene expression defines poor-prognosis subtypes in colorectal cancer. Nat Genet. 2015;47(4):320–329. doi: 10.1038/ng.3225. [DOI] [PubMed] [Google Scholar]
- 30.Moffitt RA, et al. Virtual microdissection identifies distinct tumor- and stroma-specific subtypes of pancreatic ductal adenocarcinoma. Nat Genet. 2015;47(10):1168–1178. doi: 10.1038/ng.3398. [DOI] [PMC free article] [PubMed] [Google Scholar]
- 31.Wu Y, et al. Comprehensive genomic meta-analysis identifies intra-tumoural stroma as a predictor of survival in patients with gastric cancer. Gut. 2013;62(8):1100–1111. doi: 10.1136/gutjnl-2011-301373. [DOI] [PubMed] [Google Scholar]
- 32.Kobayashi H, Enomoto A, Woods SL, Burt AD, Takahashi M, Worthley DL. Cancer-associated fibroblasts in gastrointestinal cancer. Nat Rev Gastroenterol Hepatol. 2019;16(5):282–295. doi: 10.1038/s41575-019-0115-0. [DOI] [PubMed] [Google Scholar]
- 33.Weis SM, Cheresh DA. Tumor angiogenesis: molecular pathways and therapeutic targets. Nat Med. 2011;17(11):1359–1370. doi: 10.1038/nm.2537. [DOI] [PubMed] [Google Scholar]
- 34.Uhlik MT, et al. Stromal-based signatures for the classification of gastric cancer. Cancer Res. 2016;76(9):2573–2586. doi: 10.1158/0008-5472.CAN-16-0022. [DOI] [PubMed] [Google Scholar]
- 35.López-Soto A, Gonzalez S, Smyth MJ, Galluzzi L. Control of metastasis by NK cells. Cancer Cell. 2017;32(2):135–154. doi: 10.1016/j.ccell.2017.06.009. [DOI] [PubMed] [Google Scholar]
- 36.Davoli T, Uno H, Wooten EC, Elledge SJ. Tumor aneuploidy correlates with markers of immune evasion and with reduced response to immunotherapy. Science. 2017;355(6322):eaaf8399. doi: 10.1126/science.aaf8399. [DOI] [PMC free article] [PubMed] [Google Scholar]
- 37.Luke JJ, Bao R, Sweis RF, Spranger S, Gajewski TF. WNT/β-catenin pathway activation correlates with immune exclusion across human cancers. Clin Cancer Res. 2019;25(10):3074–3083. doi: 10.1158/1078-0432.CCR-18-1942. [DOI] [PMC free article] [PubMed] [Google Scholar]
- 38.Tamborero D, et al. A pan-cancer landscape of interactions between solid tumors and infiltrating immune cell populations. Clin Cancer Res. 2018;24(15):3717–3728. doi: 10.1158/1078-0432.CCR-17-3509. [DOI] [PubMed] [Google Scholar]
- 39.Souza-Fonseca-Guimaraes F, Cursons J, Huntington ND. The emergence of natural killer cells as a major target in cancer immunotherapy. Trends Immunol. 2019;40(2):142–158. doi: 10.1016/j.it.2018.12.003. [DOI] [PubMed] [Google Scholar]
- 40.Dong W, et al. The mechanism of anti-PD-L1 antibody efficacy against PD-L1-negative tumors identifies NK cells expressing PD-L1 as a cytolytic effector. Cancer Discov. 2019;9(10):1422–1437. doi: 10.1158/2159-8290.CD-18-1259. [DOI] [PMC free article] [PubMed] [Google Scholar]
- 41.Böttcher JP, et al. NK cells stimulate recruitment of cDC1 into the tumor microenvironment promoting cancer immune control. Cell. 2018;172(5):1022–1037.e14. doi: 10.1016/j.cell.2018.01.004. [DOI] [PMC free article] [PubMed] [Google Scholar]
- 42.Barry KC, et al. A natural killer-dendritic cell axis defines checkpoint therapy-responsive tumor microenvironments. Nat Med. 2018;24(8):1178–1191. doi: 10.1038/s41591-018-0085-8. [DOI] [PMC free article] [PubMed] [Google Scholar]
- 43.Guillerey C, Huntington ND, Smyth MJ. Targeting natural killer cells in cancer immunotherapy. Nat Immunol. 2016;17(9):1025–1036. doi: 10.1038/ni.3518. [DOI] [PubMed] [Google Scholar]
- 44.van Montfoort N, et al. NKG2A blockade potentiates CD8 T cell immunity induced by cancer vaccines. Cell. 2018;175(7):1744–1755.e15. doi: 10.1016/j.cell.2018.10.028. [DOI] [PMC free article] [PubMed] [Google Scholar]
- 45.André P, et al. Anti-NKG2A mAb is a checkpoint inhibitor that promotes anti-tumor immunity by unleashing both T and NK cells. Cell. 2018;175(7):1731–1743.e13. doi: 10.1016/j.cell.2018.10.014. [DOI] [PMC free article] [PubMed] [Google Scholar]
- 46.Fridman WH, Zitvogel L, Sautès-Fridman C, Kroemer G. The immune contexture in cancer prognosis and treatment. Nat Rev Clin Oncol. 2017;14(12):717–734. doi: 10.1038/nrclinonc.2017.101. [DOI] [PubMed] [Google Scholar]
- 47.Thompson ED, et al. Patterns of PD-L1 expression and CD8 T cell infiltration in gastric adenocarcinomas and associated immune stroma. Gut. 2017;66(5):794–801. doi: 10.1136/gutjnl-2015-310839. [DOI] [PMC free article] [PubMed] [Google Scholar]
- 48.Chalmers ZR, et al. Analysis of 100,000 human cancer genomes reveals the landscape of tumor mutational burden. Genome Med. 2017;9(1):34. doi: 10.1186/s13073-017-0424-2. [DOI] [PMC free article] [PubMed] [Google Scholar]
- 49.Wherry EJ, Kurachi M. Molecular and cellular insights into T cell exhaustion. Nat Rev Immunol. 2015;15(8):486–499. doi: 10.1038/nri3862. [DOI] [PMC free article] [PubMed] [Google Scholar]
- 50.Lin SJ, et al. Signatures of tumour immunity distinguish Asian and non-Asian gastric adenocarcinomas. Gut. 2015;64(11):1721–1731. doi: 10.1136/gutjnl-2014-308252. [DOI] [PMC free article] [PubMed] [Google Scholar]
- 51.Ooi CH, et al. Oncogenic pathway combinations predict clinical prognosis in gastric cancer. PLoS Genet. 2009;5(10):e1000676. doi: 10.1371/journal.pgen.1000676. [DOI] [PMC free article] [PubMed] [Google Scholar]
- 52.Becht E, et al. Estimating the population abundance of tissue-infiltrating immune and stromal cell populations using gene expression. Genome Biol. 2016;17(1):218. doi: 10.1186/s13059-016-1070-5. [DOI] [PMC free article] [PubMed] [Google Scholar]
- 53.Liu Y, et al. Comparative molecular analysis of gastrointestinal adenocarcinomas. Cancer Cell. 2018;33(4):721–735.e8. doi: 10.1016/j.ccell.2018.03.010. [DOI] [PMC free article] [PubMed] [Google Scholar]
- 54.Pencina MJ, D’Agostino RB, Steyerberg EW. Extensions of net reclassification improvement calculations to measure usefulness of new biomarkers. Stat Med. 2011;30(1):11–21. doi: 10.1002/sim.4085. [DOI] [PMC free article] [PubMed] [Google Scholar]
- 55.Ritchie ME, et al. limma powers differential expression analyses for RNA-sequencing and microarray studies. Nucleic Acids Res. 2015;43(7):e47. doi: 10.1093/nar/gkv007. [DOI] [PMC free article] [PubMed] [Google Scholar]
- 56. Frederick LGMD, et al. AJCC cancer staging manual. Springer Science & Business Media; 2002. [Google Scholar]
- 57.Washington K. 2010. 7th of the AJCC cancer staging manual: stomach. Ann Surg Oncol. 2010;17(12):3077–3079. doi: 10.1245/s10434-010-1362-z. [DOI] [PubMed] [Google Scholar]
Associated Data
This section collects any data citations, data availability statements, or supplementary materials included in this article.


