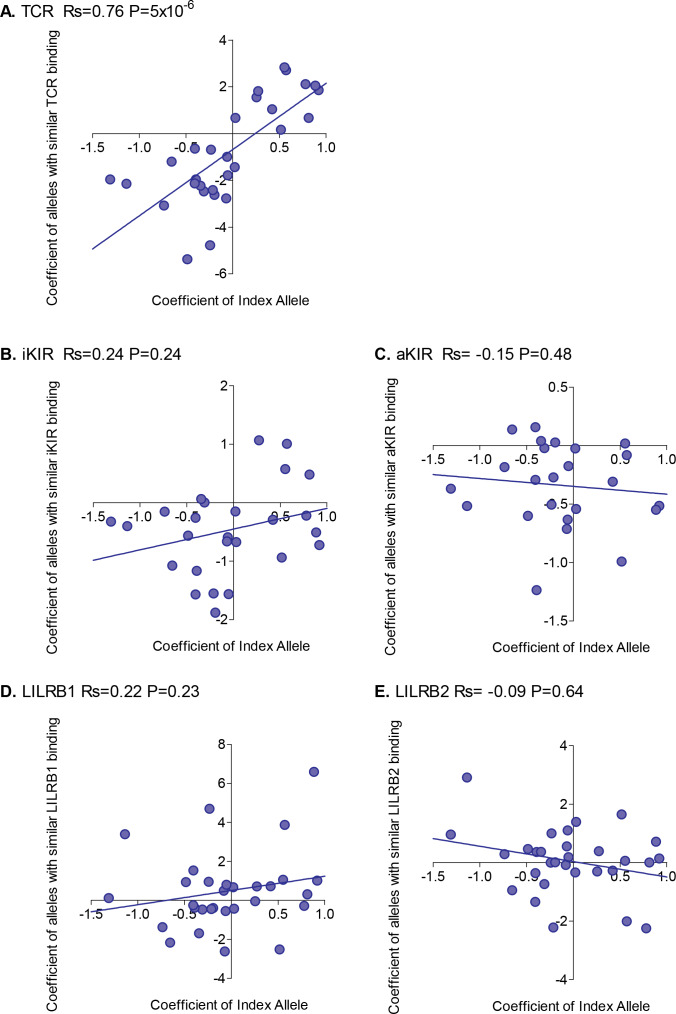
Figure 2. Correlation between the risk of HAM/TSP associated with an allele and the risk associated with similar alleles.
The risk of HAM/TSP associated with an HLA class I allele (“Coefficient of Index Allele, x axis) was compared with the coefficient of HLA class I alleles with (A) similar TCR binding, (B) similar iKIR binding, (C) similar activating KIR binding, (D) similar LILRB1 binding and (E) similar LILRB2 binding. All alleles in the cohort of a sufficient frequency (N > 15) and with sufficient near alleles (N > 15 with 50% or more similarity) were considered. The Spearman correlation coefficient (Rs) and corresponding P value are reported in the title bar for each plot. There is a very striking positive correlation for TCR binding, i.e. the risk of HAM/TSP associated with an allele is strongly correlated with the risk associated with other alleles that share similar TCR binding properties. No such correlation was observed for any of the other metrics.

