Abstract
Immunohistochemical (IHC) quantification of estrogen receptor-α (ER) is used for assessment of treatment regimen in breast cancer. Different ER IHC assays may produce diverging results, because of different antibody clones, protocols, and stainer platforms. Objective tissue-based techniques to assess sensitivity and specificity of IHC assays are therefore needed. We tested the usability of ER mRNA-in situ hybridization (mRNA-ISH) in comparison with assays based on clones SP1 and 6F11. We selected 56 archival specimens according to their reported ER IHC positivity, representing a wide spectrum from negative to strongly positive cases. The specimens were used to prepare 4 TMAs with 112 cores. Serial sections of each TMA were stained for ER and pan-cytokeratin (PCK) by IHC and ESR1 (ER gene) by mRNA-ISH. Digital image analysis (DIA) was used to determine ER IHC H-score. ESR1 mRNA-ISH was scored both manually and by DIA. DIA showed a nonlinear correlation between IHC and ESR1 mRNA-ISH with R2-values of 0.80 and 0.78 for the ER antibody clones SP1 and 6F11, respectively. Comparison of manual mRNA-ISH scoring categories and SP1 and 6F11 IHC H-scores showed a highly significant relationship (P<0.001). In conclusion, the study showed good correlation between mRNA-ISH and IHC, suggesting that mRNA-ISH can be a valuable tool in the assessment of the sensitivity and specificity of ER IHC assays.
Key Words: estrogen receptor, immunohistochemistry, mRNA in situ hybridization, specificity
BACKGROUND
The use of immunohistochemical (IHC) detection of biomarkers is fundamental in the field of surgical pathology, and reliable results of the analysis are essential in order to make the right diagnosis and to offer the most efficient treatment.1 One example of this is the assessment of estrogen receptor α (ER) expression in breast cancer, which is of both prognostic and predictive value.2 According to international guidelines, tumors should be reported as ER-positive even with a weak immunoreactivity in ≥1% of the tumor cells, as this predicts responsiveness to endocrine therapy.3 This places strong demands on the performance of the ER assays in terms of sensitivity and specificity.
Nordic immunohistochemical Quality Control (NordiQC) is an external proficiency testing program at present involving around 600 pathology laboratories worldwide. Since 2003 NordiQC has assessed the performance of ER IHC assays twice annually. A typical test program, or “run,” evaluates the influence of epitope retrieval procedures, antibody clones and concentrations, visualization methods and staining platforms on IHC assay performance based on circulation of unstained serial sections of carefully composed tissue micro array (TMA) blocks to the participating laboratories, which are required to stain the slides using their routine methods and return the stained slide for central assessment. In most instances an insufficient performance is because of poor sensitivity of the antibody (in terms of binding affinity and/or dilution) giving too weak or even false-negative results, but in some cases an antibody clone may show immunoreactivity in tumors that are negative with other clones. As an example, one core of breast cancer in run B15, 2013, found ER negative in reference laboratories and 215 participating laboratories, revealed a positive staining with clone 6F11 in 15 of 37 laboratories (Fig. 1).4 No certain methodological explanation was found but excessive retrieval in combination with insufficient washing was suspected. However, ER expression that only could be detected by clone 6F11 could not be entirely ruled out. Since there are no other commonly available methods for demonstration of proteins in situ, the evaluation is dependent on knowledge about IHC-based expression in control tissues, which was not helpful in this particular case. In lack of methods for detection of proteins in situ, surrogate markers of expression could be an appropriate solution. Messenger RNA (mRNA) coding for a protein would be expected in cells expressing the protein. In the case of ER there are studies confirming a correlation between mRNA and protein measured by quantitative reverse transcriptase polymerase chain reaction (qRT-PCR) and IHC respectively.5,6 However, the results of qRT-PCR does not contain any information about the distribution in the tissue and carries a risk of contamination by normal tissue, which limits its usefulness as a specificity control. Messenger RNA in situ hybridization is an alternative method to visualize gene expression in situ. The branched DNA signal amplification technique has formed the basis of currently used mRNA-ISH analyses. This technique utilizes multiple probe pairs that bind to unique sequences of the target transcript giving a high specificity in target detection.7 The method therefore allows to substantiate or validate protein expression at the cellular level. Only few studies have used mRNA-ISH as a reference when comparing the performance of different IHC assays for other proteins.8–10 The aim of the present study was to compare the specificity of IHC assays based on different antibody clones against ER, using mRNA-ISH as reference.
FIGURE 1.
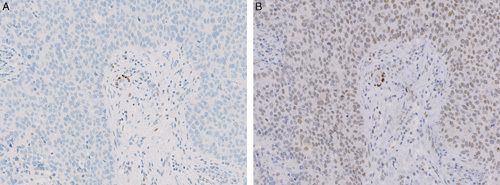
Different IHC ER expression in serial sections of breast cancer as found in the NordiQC assessment scheme, run B15/2013. A, ER negative tumor. No nuclear staining reaction of the tumor cells was found in any of 225 submitted stains based on the mAb clone 1D5 or the rmAb clones EP1 and SP1. B, Same tumor area as in A showing diffuse, weak to moderate nuclear ER staining reaction, considered to be false positive, which was confirmed by ESR1 mRNA-ISH, score=0. This staining pattern was obtained in 15 of 37 submitted stains based on the mAb clone 6F11.
MATERIALS AND METHODS
Tissue
Archived formalin-fixed paraffin embedded (FFPE) tumor material was selected from 56 ductal carcinomas NST diagnosed at our department in the period January 01, 2014 to July 01, 2015. All included tissue had been fixed for 24 to 72 hours in 10% neutral-buffered formalin and processed according to in-house standard procedure. On the basis of the original pathology reports, 20 ER-negative (<1% positive cells), 26 low to medium expressers (1% to 80% positive) and 10 high expressers (80% to 100% positive) were chosen. Large tumors were preferred in order to get sufficient tissue and to preserve tissue for eventual diagnostic purposes in the future. In random order, 2 neighboring cores (diameter 2.5 mm) from each tumor were placed separately, but with the same coordinates, in 2 sets of TMAs, each containing 28 tumor cores (4 TMAs in total). In addition to the tumor tissue, each TMA included two cores from non-neoplastic endometrium and tonsil for both orientation and control purposes. The TMAs were cut in serial sections of 4 μm thickness in series of 3. The first in each series were used for ER IHC, the second for PCK IHC and the last for ESR1 mRNA-ISH. At least 2 series were cut from each TMA. Additional sections (nonserial) were cut for positive and negative controls (mRNA-ISH) from each TMA.
Immunohistochemistry
Consecutive adjacent 4 μm sections were cut and mounted on coated slides (FLEX IHC slides K8020, Dako). The sections were dried overnight at room temperature and then stored at −20°C until staining. The slides were dried at 60°C for 1 hour. For ER, clone SP1, and PCK the slides were placed in the BenchMark Ultra instrument (Ventana). The slides were deparaffinized on-board and submitted to heat induced epitope retrieval (HIER) in Cell Conditioning 1 for 48 minutes at 99°C. Following endogenous peroxidase blocking, the primary antibodies for ER (rabbit monoclonal clone SP1, Thermo Scientific, RM-9101-S, diluted 1:100) and PCK (mouse monoclonal clone AE1/AE3, Dako M3515, diluted 1:150) were applied for 32 minutes at 36°C. After a wash in buffer the visualization system, OptiView DAB (HRP-labeled multimer, Ventana, 760-700) was then applied and after a wash in the buffer the slides were finally developed with DAB (Ventana, 760-700) and counterstained with hematoxylin II (Ventana, 790-2208).
For ER, clone 6F11, the slides were placed in the Omnis instrument (Dako). The slides were deparaffinized on-board and submitted to HIER in Target Retrieval Solution High pH for 30 minutes at 97°C. Following endogenous peroxidase blocking, the primary antibody for ER (mouse monoclonal clone 6F11, Leica, NCL-L-ER-6F11, diluted 1:25) was applied for 20 minutes at 32°C. After a wash in buffer the visualization system, FLEX+ mouse (HRP-labeled polymer, Dako, GV800/GV821/DM842) was applied and after a wash in the buffer the slides were finally developed with DAB (Dako, GV800/GV825) and counterstained with hematoxylin (Dako, GC808).
In Situ Hybridization
For mRNA ISH analyses, we prepared 4 µm paraffin sections from the TMA samples. RNAscope ISH was performed using the RNAscopeVS 2.5 Brown kit (ACD, Newark, CA) applied to a Ventana Discovery Ultra instrument (Roche, Basel, Switzerland), in which all steps in the RNAscope procedure was performed, including deparaffination, mRNA demasking, in situ hybridization, probe detection, DAB-chromogen development and hematoxylin counterstaining. Probes included ER mRNA (ESR1 transcript 4, target region 677-3065, Cat #310309), and the reference probes PPIB (positive control probe, Cat #313909) and dapB (negative control probe, Cat #310039). All steps in the Ventana instrument were performed according to the standard procedure.11 Here, both demasking steps was performed for 16 minutes and the AMP-5 step for 60 minutes for the positive and negative controls and 120 minutes for ESR1.
To test the impact of the fixation time on the mRNA-ISH signals we used a TMA that had been produced for another study. The TMA included 3 cores from each of 6 different non-neoplastic tissues that had been fixed in neutral-buffered 10% formalin for 6, 24, and 72 hours respectively. mRNA-ISH was performed with probes against the housekeeping gene PPIB and the bacterial gene dapB, which served as a negative control. By comparing the expression of PPIB mRNA we found almost equal results for 24 and 72 hours fixation with consistently stronger signals compared with the tissues fixed for 6 hours.
Digital Image Analysis (DIA)
All slides were scanned using a Hamamatsu Nanozoomer HT slide scanner. The IHC slides were scanned at ×200 magnification, whereas the mRNA-ISH slides were scanned at ×400 magnification. The scanned images were analyzed using the VIS software platform (Visiopharm). ER (IHC) expression in each core was measured using the commercial applications, PCK VDS and ER APP, from Visiopharm. Using a virtual double staining (VDS) application, the PCK positive areas was transferred to the image of the neighboring ER section, serving as a region of interest (ROI) for the image analysis. The data output of the ER APP are total number of nuclei, numbers of low, medium and high intensity nuclei and an calculated H-score (0 to 300; the sum of percentages of nuclei with low, medium and high staining intensity, multiplied by 1, 2, and 3, respectively). In addition, we developed a new ISH Application Protocol Package (APP) for VIS (named ISH APP), which was able to detect brown dots in the scanned images of the tumor cores. The PCK VDS app was used to define the ROI (epithelial cells). The output of the ISH APP was the total dot area in the ROIs of each core. The number of epithelial cells in each ROI was then estimated by using the total number of epithelial cells in the ROI that were detected by the ER APP on another slide in the same series. The average dot area per epithelial cell could then be calculated.
Tissue cores were excluded from analysis in case of missing tissue, folded tissue, too weak hematoxylin counterstain or too few epithelial cells in the tissue. In the case of failed PCK-stained core sections, the corresponding ER IHC and ISH cores in the series were excluded from DIA.
Manual Scoring of mRNA-ISH
In addition to DIA the ESR1 ISH stained slides were scored manually using a bright field microscope. We used a modified version of the scoring algorithm provided by the manufacturer (Advanced Cell Diagnostics).12 A subset of tumor cores were impossible to categorize with the original scoring algorithm and an additional category was included in the modified version (see Table 1). The ESR1 stained slides of the tumor TMAs were scored by a single observer (SHP), who was blinded to the results of ER IHC.
TABLE 1.
Manual ISH Scoring Algorithm
Statistical Analysis
Reported values are averages of the available results for each tumor. In most instances there was four of each observation per tumor (2 slides from 2 cores), but some tumors were only represented by 2 or 3 observations, because of excluded cores. Statistics was performed using Stata 15 (StataCorp). Correlation between H-score and average dot area per cell was determined by linear regression following a log-transformation of both datasets. A nonparametric trend-test was used to test the correlation between H-score and manual ISH score.
RESULTS
In the present study, one of the 56 tumors was not represented in the relevant cores and was excluded from analysis. All the remaining tumors showed a moderate to high expression of PPIB (housekeeping gene) in the epithelial cells, showing that the mRNA was sufficiently preserved for analysis. Examples of corresponding IHC and mRNA-ISH are shown in Figure 2.
FIGURE 2.
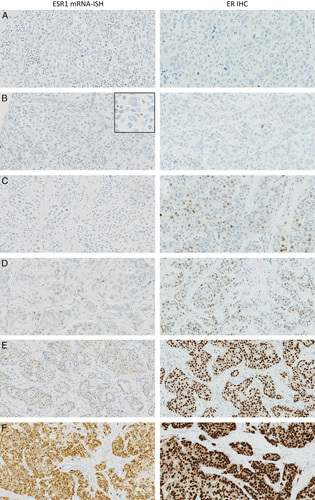
Corresponding pairs of photomicrographs with increasing ISH and IHC positivity. Left column: Examples of tissue cores with increasing manual ESR1 mRNA-ISH scores. A: 0, B: 1, C: 2, D: 3, E: 4, F: 5. Right column: ER IHC (clone SP1) staining of the same tissue cores assessed using H-score. A: 0, B: 4, C: 15, D: 57, E: 258, F: 292.
Digital Image Analysis: We found a nonlinear correlation between ESR1 average dot area per cell (mRNA-ISH) and H-score (ER IHC), with R2-values of 0.80 and 0.78 for the clones SP1 and 6F11 respectively (Fig. 3). For high values of average dot area per cell the curves reaches a plateau because of the upper limit of the H-score.
FIGURE 3.
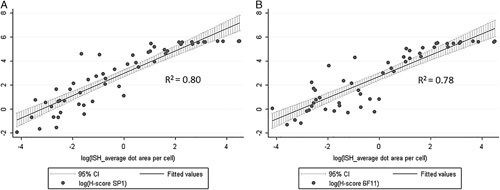
Digital image analysis of mRNA-ISH assay. Relationship between average dot area per cell (mRNA-ISH) and H-score (IHC). The data are log-transformed before linear regression. A, ER antibody clone SP1. B, ER antibody clone 6F11.
Manual ISH scoring: comparison of the manual ISH scores (ESR1 mRNA-ISH) and H-scores (ER IHC) resulted in significant correlation for both antibody clones, SP1 (P<0.001) and 6F11 (P<0.001). Comparisons of manual mRNA-ISH scoring categories and IHC H-scores are shown in Table 2 and Figure 4. After review of the slides, the outliers for the manual ISH scores of 1 and 2 was identified as borderline cases between score 1 and 2, and 2 and 3, respectively. Seven cases with 1% to 15% ER ICH positive nuclei, had a manual mRNA-ISH score of 2 or 3. The earlier mentioned case, with discordant positive IHC reaction with 6F11 and negative with the 3 other antibody clones applied, indicating a nonspecific 6F11 staining (Fig. 1), had a manual ISH score of 0, but an H-score of 96.
TABLE 2.
Comparison of the Results of mRNA-ISH and IHC
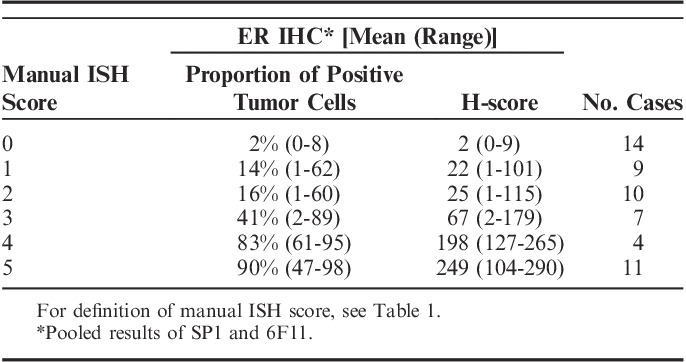
FIGURE 4.
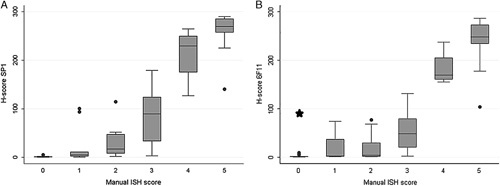
Manual scoring of mRNA-ISH assay. Relationship between manual ISH score (mRNA-ISH) and H-score (IHC). A, ER antibody clone SP1. B, ER antibody clone 6F11. For both clones a manual ISH score of 0 (<1 dot/10 cells) corresponds to an IHC H-score <10. *The case from Figure 1B (H-score=96) indicating a false-positive IHC staining by the clone 6F11.
DISCUSSION
For mRNA-ISH to be a useful reference marker in the sensitivity and specificity analysis of antibodies used in IHC, a certain level of correlation between the mRNA and protein should be demonstrated, which was the case in our study. Regarding the technical sensitivity of mRNA-ISH, we observed 7 cases with ESR1 mRNA-ISH dots in almost every tumor cell (manual ISH score 2-3), whereas the corresponding ER IHC only showed positive staining in a small proportion of the tumor cells (1% to 15%), regardless of the antibody clone. Simply, the ER expression in the other tumor cells was below the lower level of detection for IHC. This finding may help to explain why some patients respond to antiestrogen treatment despite low proportions of ER positive tumor cells.2 We did not find any cases with a higher proportion of positive cells by IHC than mRNA-ISH.
To our knowledge, only 2 other studies have compared ESR1 mRNA-ISH and ER IHC. Bordeaux and colleagues used the RNAscope technology and described ESR1 mRNA-ISH as a possible predictive marker of response to antiestrogen treatment. They reported a nonlinear correlation between ESR1 mRNA-ISH and ER IHC, both measured by quantitative digital image analysis (AQUA method).13 The authors reported large variations in ER protein content in the cases with low levels of mRNA, but did not specify the extent of protein positive, mRNA negative cases, and their cut-off value of mRNA positivity was defined as a certain level of fluorescence intensity, preventing a direct comparison of their results with ours. Yu et al14 investigated ESR1 mRNA-ISH also by RNAscope technology as a complementary method to IHC in the evaluation of ER status in breast cancers. They used the original mRNA-ISH manual scoring algorithm provided by ACD, considering a score ≥1 as positive. In agreement with our observations, they found mRNA-ISH to be more sensitive than IHC. Taken together, the ER mRNA ISH method is likely to be suitable for evaluation and specificity analysis in IHC.
In our study, we obtained the ER mRNA ISH expression levels by manual scoring, whereas the IHC scores were obtained by digital image analysis to provide H-scores. The choice of scoring systems gives some issues to consider. H-score has been used for decades as a semiquantitative measure of bright field IHC staining intensity, and provides information about the ratio of positive cells and staining intensity of the individual cells.15 In routine diagnostics a cut-off level of H-score ≥1 (1% weakly stained nuclei) is used, whereas the manual ISH score uses a cut-off value of ≥10% weakly stained cells. Thus, the terms positive and negative are not directly comparable between the methods. The manual ISH score is based on the average staining intensity (number of dots) and can be problematic with tumor heterogeneity, which is taken into account with the IHC H-score. For DIA of mRNA-ISH average dot area per cell was chosen as a measure of staining intensity. This provides a continuous scale and takes the dot clusters of the high expressing tumors into account. Unfortunately, this measure does not give information about the ratio of positive cells. More sophisticated software is needed to provide such measures.
Many biological factors can influence the relationship between measured mRNA and protein, including different stability and half-life of the respective molecules.16,17 Studies using imaging mass spectrometry and mRNA-ISH has shown both intratumoral and intertumoral variation of the mRNA/protein ratio of other biomarkers, and this is probably also the case with ER.18
Despite the mentioned sources of variability, our results support that mRNA-ISH can be used in the evaluation of the specificity of immunohistochemical assays against ER. We have shown an example with suspected nonspecific staining by assays based on the clone 6F11, which was confirmed by mRNA-ISH. If the method can be used in the evaluation of assays against other targets, it would be a valuable tool in the quality assurance of immunohistochemistry in general.
ACKNOWLEDGMENTS
The authors thank Rasmus Røge for his contribution with software development, and the staff at the immunohistochemical laboratories at the Institutes of Pathology in Aalborg and Hjoerring, Denmark, for their help with immunohistochemistry.
Footnotes
Supported by grants from Speciallæge Heinrich Kopps Legat, Stinne og Martinus Sørensen Fond and Fonden til Lægevidenskabens Fremme.
The authors declare no conflict of interest.
REFERENCES
- 1.True LD. Methodological requirements for valid tissue-based biomarker studies that can be used in clinical practice. Virchows Arch. 2014;464:257–263. [DOI] [PMC free article] [PubMed] [Google Scholar]
- 2.Viale G, Regan MM, Maiorano E, et al. Prognostic and predictive value of centrally reviewed expression of estrogen and progesterone receptors in a randomized trial comparing letrozole and tamoxifen adjuvant therapy for postmenopausal early breast cancer: BIG 1-98. J Clin Oncol. 2007;25:3846–3852. [DOI] [PubMed] [Google Scholar]
- 3.Hammond ME, Hayes DF, Dowsett M, et al. American society of clinical oncology/college of american pathologists guideline recommendations for immunohistochemical testing of estrogen and progesterone receptors in breast cancer. Arch Pathol Lab Med. 2010;134:907–922. [DOI] [PMC free article] [PubMed] [Google Scholar]
- 4.Assessment Run B15 2013 estrogen receptor (ER) [NordiQC website]. 2013. Available at: http://www.nordiqc.com/. Accessed May 15, 2018.
- 5.Muller BM, Kronenwett R, Hennig G, et al. Quantitative determination of estrogen receptor, progesterone receptor, and HER2 mRNA in formalin-fixed paraffin-embedded tissue--a new option for predictive biomarker assessment in breast cancer. Diagn Mol Pathol. 2011;20:1–10. [DOI] [PubMed] [Google Scholar]
- 6.Kraus JA, Dabbs DJ, Beriwal S, et al. Semi-quantitative immunohistochemical assay versus oncotype DX(R) qRT-PCR assay for estrogen and progesterone receptors: an independent quality assurance study. Mod Pathol. 2012;25:869–876. [DOI] [PubMed] [Google Scholar]
- 7.Wang F, Flanagan J, Su N, et al. RNAscope: a novel in situ RNA analysis platform for formalin-fixed, paraffin-embedded tissues. J Mol Diagn. 2012;14:22–29. [DOI] [PMC free article] [PubMed] [Google Scholar]
- 8.Sheffield BS, Fulton R, Kalloger SE, et al. Investigation of PD-L1 biomarker testing methods for PD-1 axis inhibition in non-squamous non-small cell lung cancer. J Histochem Cytochem. 2016;64:587–600. [DOI] [PMC free article] [PubMed] [Google Scholar]
- 9.Toriyama A, Mori T, Sekine S, et al. Utility of PAX8 mouse monoclonal antibody in the diagnosis of thyroid, thymic, pleural and lung tumours: a comparison with polyclonal PAX8 antibody. Histopathology. 2014;65:465–472. [DOI] [PubMed] [Google Scholar]
- 10.Baker AM, Van Noorden S, Rodriguez-Justo M, et al. Distribution of the c-MYC gene product in colorectal neoplasia. Histopathology. 2016;69:222–229. [DOI] [PMC free article] [PubMed] [Google Scholar]
- 11.Anderson CM, Zhang B, Miller M, et al. Fully automated RNAscope in situ hybridization assays for formalin-fixed paraffin-embedded cells and tissues. J Cell Biochem. 2016;117:2201–2208. [DOI] [PMC free article] [PubMed] [Google Scholar]
- 12.RNAscope® 2.5 VS reagent kit - BROWN user manual for DISCOVERY ULTRA SYSTEM [Advanced Cell Diagnostics website]. 2015. Available at: http://acdbio.com/system/files_force/322200-USM%20ULT-%20RNAscopeVS%20BRN%202%205%20Ultra%2012022015.pdf?download=1. Accessed May 15, 2018.
- 13.Bordeaux JM, Cheng H, Welsh AW, et al. Quantitative in situ measurement of estrogen receptor mRNA predicts response to tamoxifen. PLoS One. 2012;7:e36559. [DOI] [PMC free article] [PubMed] [Google Scholar]
- 14.Yu X, Guo S, Song W, et al. Estrogen receptor alpha (ERalpha) status evaluation using RNAscope in situ hybridization: a reliable and complementary method for IHC in breast cancer tissues. Hum Pathol. 2017;61:121–129. [DOI] [PubMed] [Google Scholar]
- 15.Budwit-Novotny DA, McCarty KS, Cox EB, et al. Immunohistochemical analyses of estrogen receptor in endometrial adenocarcinoma using a monoclonal antibody. Cancer Res. 1986;46:5419–5425. [PubMed] [Google Scholar]
- 16.Kenealy MR, Flouriot G, Sonntag-Buck V, et al. The 3’-untranslated region of the human estrogen receptor alpha gene mediates rapid messenger ribonucleic acid turnover. Endocrinology. 2000;141:2805–2813. [DOI] [PubMed] [Google Scholar]
- 17.Zhao H, Hart LL, Keller U, et al. Characterization of stably transfected fusion protein GFP-estrogen receptor-alpha in MCF-7 human breast cancer cells. J Cell Biochem. 2002;86:365–375. [DOI] [PubMed] [Google Scholar]
- 18.Schulz D, Zanotelli VRT, Fischer JR, et al. Simultaneous multiplexed imaging of mRNA and proteins with subcellular resolution in breast cancer tissue samples by mass cytometry. Cell Syst. 2018;6:25–36; e5. [DOI] [PMC free article] [PubMed] [Google Scholar]


