

Supplemental Digital Content is available in the text.
Keywords: animals, atherosclerosis, autophagy, caveolae, caveolin-1
Objective:
Endothelial Cav-1 (caveolin-1) expression plays a relevant role during atherogenesis by controlling NO production, vascular inflammation, LDL (low-density lipoprotein) transcytosis, and extracellular matrix remodeling. Additional studies have identified cholesterol-rich membrane domains as important regulators of autophagy by recruiting ATGs (autophagy-related proteins) to the plasma membrane. Here, we investigate how the expression of Cav-1 in the aortic endothelium influences autophagy and whether enhanced autophagy contributes to the atheroprotective phenotype observed in Cav-1–deficient mice.
Approach and Results:
To analyze the impact of Cav-1 deficiency on regulation of autophagy in the aortic endothelium during the progression of atherosclerosis, we fed Ldlr−/− and Cav-1−/−Ldlr−/− mice a Western diet and assessed autophagy in the vasculature. We observe that the absence of Cav-1 promotes autophagy activation in athero-prone areas of the aortic endothelium by enhancing autophagic flux. Mechanistically, we found that Cav-1 interacts with the ATG5-ATG12 complex and influences the cellular localization of autophagosome components in lipid rafts, which controls the autophagosome formation and autophagic flux. Pharmacological inhibition of autophagy attenuates the atheroprotection observed in Cav-1−/− mice by increasing endothelial inflammation and macrophage recruitment, identifying a novel molecular mechanism by which Cav-1 deficiency protects against the progression of atherosclerosis.
Conclusions:
These results identify Cav-1 as a relevant regulator of autophagy in the aortic endothelium and demonstrate that pharmacological suppression of autophagic flux in Cav-1–deficient mice attenuates the atheroprotection observed in Cav-1−/− mice. Additionally, these findings suggest that activation of endothelial autophagy by blocking Cav-1 might provide a potential therapeutic strategy for cardiovascular diseases including atherosclerosis.
Highlights.
Cav-1 (caveolin-1) deficiency promotes autophagy activation in vascular endothelial cells.
ATG (autophagy-related protein)-5–ATG12 complex colocalizes with caveolae, and silencing of Cav-1 influences the distribution of autophagosome components.
Increased autophagy in the endothelium mediates, in part, the atheroprotection observed in Cav-1−/− mice.
Cav-1 deficiency attenuates endothelial cell activation in response to proatherogenic cytokines by enhancing autophagic flux.
Atherosclerosis, whose complications represent the leading cause of cardiovascular mortality, develops in arterial bifurcations and at the inner part of curvatures where blood flow is disturbed and shear stress (SS) is low.1 The dysfunctional endothelium in these specific areas triggers the release of proinflammatory cytokines and chemokines, the entry of pro-athero lipoproteins, and the migration of circulating monocytes into the subendothelial space to initialize atherosclerosis.2 Caveolae are 50 to 100 nm flask-shaped invaginations of plasma membrane, and Cav-1 (caveolin-1) is essential for caveolae biogenesis in endothelium, thus orchestrating Cav-1–dependent cholesterol transport, endocytosis, transcytosis, and signal transduction.3 We and others have revealed a critical role of Cav-1 in the progression of atherosclerosis through regulation of vascular inflammation and LDL (low-density lipoprotein) transcytosis.4–6
Autophagy is an evolutionarily conserved subcellular process mediating the degradation of proteins and damaged organelles via lysosomes.7 The link between autophagy and vascular functions has been described in both in vitro and in vivo studies. High autophagy flux is observed in atheroprotective laminar SS-stimulated endothelial cells (ECs) of human and murine arteries, while ECs exposed to low SS are characterized by inefficient autophagy.8 Autophagy activation under laminar SS protects ECs from oxidative stress, upregulates endothelial NO synthase expression, and inhibits endothelial inflammation.9–11 Conversely, defective autophagy in ECs of hypercholesterolemic Apoe−/− mice develops larger atherosclerotic lesions, which is related to an inflammatory, apoptotic, and senescent phenotype, as well as defects in endothelial alignment and vascular lipid homeostasis.8,12 Similar to the colocalization of fluorescently labeled oxidized LDL and GFP (green fluorescent protein)-LC3 (light chain 3), electron micrographs identify gold-labeled native LDL within double membrane autophagosomes (APGs), which is LDLR (LDL receptor) independent.12 Knockdown of ATG (autophagy-related protein)-7 or treatment with chloroquine promotes oxidized LDL retention in retinal endothelium and lipid accumulation within the vessel wall, suggesting a requirement for intact endothelial autophagy for the maintenance of vascular lipid homeostasis and protection from atherosclerotic vascular diseases.12
Cav-1 has been recently shown to be involved in autophagy activation in adipocytes, cardiomyocytes, and cancer cells.13–15 Knocking down of Cav-1 in cultured bovine aortic ECs leads to a striking increase in the expression of the autophagic marker protein LC3BII, implying that Cav-1 is a critical determinant of autophagy.16 In this report, we identified the functional relationship of Cav-1 on autophagy activation in athero-prone areas characterized by disturbed flow and low SS and the effects of Cav-1 expression on the initiation of atherosclerosis through autophagy activation. We found that the absence of Cav-1 attenuates the initiation of atherosclerosis by promoting autophagic flux both in vascular ECs exposed to autophagy stimulation in vitro and in early atherosclerotic lesions in vivo. The effects of Cav-1 on autophagy activation were, in part, mediated by the interaction between Cav-1 and the ATG5-ATG12 complex and the alteration in the cellular localization of APG components, which impacts APG formation and autophagic flux. Notably, pharmaceutic inhibition of autophagy abrogated the atheroprotection observed in Cav-1−/− mice, which implies regulation of autophagy by Cav-1 during atherogenesis.
Materials and Methods
The data that support the findings of this study are available from the corresponding author upon reasonable request. For details of reagents used, please see the Major Resources Tables in the Data Supplement.
Animal Procedures
Cav-1−/− and Ldlr−/− mice were obtained from The Jackson Laboratory. Cav-1−/−Ldlr−/− mice were obtained by breeding Cav-1−/− and Ldlr−/− mice. All of these mice were on a C57BL/6J genetic background. Endothelial-specific Cav-1 transgenic mice (Cav-1ECTG) carrying a canine Cav-1 transgene under the preproendothelin-1 promoter were backcrossed 6 generations with F6-generation Cav-1−/− mice, as reported previously.17 Atherosclerosis was induced by feeding the mice a Western-type diet (No. D12108; Research Diets, Inc, New Brunswick, NJ) for 12 weeks. Mice used in all experiments were sex and age matched and kept in individually ventilated cages in a pathogen-free facility. For some experiments using PCSK9 (proprotein convertase subtilisin/kexin type 9) adeno-associated virus (AAV), AAV8-PCSK9 was injected intraperitoneally (1.0×10¹¹ vector genome copies) to WT (wild type), Cav-1−/−, or Cav-1Rec (Cav-1−/−Cav-1ECTG) mice to promote the degradation of LDLR and increase circulating cholesterol levels. Sex differences in atherosclerotic disease are known to be an important factor in mice.18 This study was primarily performed in male mice since the atheroprotection observed in mice lacking Cav-1 has been reported to be similar in male and female mice.4,19 We used male mice unless otherwise stated to compare the present findings with our previous studies, where male mice were primarily used.4,6 All of the experiments were approved by the Institutional Animal Care Use Committee of Yale University School of Medicine.
Histology, Immunohistochemistry, and Morphometric Analyses
Mice were euthanized using 100 mg/kg ketamine and 10 mg/kg xylazine. Following anesthesia, the thoracic cavity was exposed immediately, and in situ perfusion fixation through the left cardiac ventricle was performed by thorough perfusion with PBS and 4% paraformaldehyde. Mouse hearts, aortas, and aortic arches were isolated, fixed O/N in 4% paraformaldehyde, dehydrated with 30% sucrose O/N, embedded in Optimal Cutting Temperature compound, and frozen at −80°C. For morphometric analysis, serial sections were cut at 6-μm thickness using a cryostat. Every third slide from the serial sections was stained with hematoxylin and eosin, and each consecutive slide was stained with oil red O (ORO) for the quantification of the lesion area and lipid accumulation, respectively. Aortic lesion size was obtained by averaging the lesion areas in 4 slides (12 sections) from the same mouse. Snap-frozen 6-μm rip sections from the aorta were utilized for immunofluorescence. Briefly, frozen aortic sections were fixed in 4% paraformaldehyde for 15 minutes, blocked with blocker buffer (5% donkey serum, 0.5% BSA, 0.3% Triton X-100 in PBS) for 1 hour at room temperature, incubated at 4°C O/N with primary antibodies for VCAM1 (vascular cell adhesion molecule 1; No. ab19569; Abcam), CD68 (No. MCA1957; AbD Serotec), CD31 (No. ab28364; Abcam), LC3B (No. 2775; Cell Signaling), or SQSTM1/p62 (sequestosome 1; No. ab56416; Abcam), and incubated with Alexa Fluor secondary antibody (Invitrogen, Carlsbad, CA) for 1 hour at room temperature. The stained sections were captured using a Carl Zeiss scanning microscope Axiovert 200M imaging system, and images were digitized under constant exposure time, gain, and offset. Results were expressed as the positive staining area (µm2) per length of the EC layer (µm) measured with the Image J (National Institutes of Health) software.
ORO Staining
Neutral lipids in aortic frozen sections were detected by ORO staining as described previously.20 The frozen sections were thoroughly fixed in 78% methanol and stained with ORO solution (mixed with 35 mL of 0.2% ORO in methanol and 10 mL of 1M NaOH) for 50 minutes and then destained in 78% methanol for 5 minutes. The stained sections were captured with Olympus SZX16 stereo microscope and quantified with the Image J program.
Electron Microscopy Analysis
Mouse aortas were perfused and fixed by gravity monitoring a constant perfusion pressure of 40 cm H2O. For regular electron microscopy studies, mouse aortas were fixed with 2.5% glutaraldehyde and 2% paraformaldehyde in 0.1 M sodium cacodylate (pH 7.4) for 2 hours at room temperature. Tissues were postfixed in 1% OsO4 in the same buffer for 1 hour, then stained en bloc with 2% aqueous uranyl acetate for 30 minutes, dehydrated in a graded series of ethanol to 100%, and embedded in Poly/bed 812 for 24 hours. Thin sections (60 nm) were cut with a Leica ultramicrotome and poststained with uranyl acetate and lead citrate. Sample grids were examined with a FEI Tencai Biotwin transmission electron microscope at 80 kV. Digital images were taken using a Morada CCD camera fitted with iTEM imaging software (Olympus). Electron microscopy images were used to quantify APG compartments in the mouse aortic endothelium. Sampling and quantification was performed as described previously.21 The amount of APG compartment per endothelial area was calculated using Image J.
Proteolysis Measurements
Mouse fibroblast (NIH3T3 cells) transfected with nonsilencing control RNA or Cav-1 siRNA were labeled with 3H-leucine for 48 hours, washed extensively, and incubated in media supplemented with an excess of cold leucine in the presence of serum or native LDL (60 µg/mL). Contribution of lysosomes to total protein degradation was analyzed after adding 20 mmol/L NH4Cl and 100 mmol/L leupeptin to block protein degradation by lysosomes. Rate of proteolysis was calculated as the percentage of the initial acid precipitable radioactivity (proteins) transformed into acid soluble radioactivity (amino acids and small peptides) at the indicated times.
In Vivo Application of 3-Methyladenine
WT and Cav-1−/− mice injected with AAV8-PCSK9 virus were fed a Western-type diet diet for 4 weeks to induce early-stage atherosclerosis. Each animal received intraperitoneal injection of 3-methyladenine (3-MA; 30 mg/kg; Sigma-Aldrich) twice a week during the Western-type diet feeding period.22 3-MA was dissolved in PBS and kept at −20°C. The 3-MA solution was heated to 60°C immediately each time before injection. The heart was harvested after the last treatment for atherosclerotic plaque analysis.
In Vivo Autophagic Flux
To investigate the autophagic flux in vivo, Ldlr−/− and Ldlr−/−Cav-1−/− mice were subjected to intraperitoneal injection of 30 mg/kg chloroquine (Sigma-Aldrich) or PBS 48, 24, or 4 hours before euthanasia.8 The aortic arch was harvested for immunofluorescence staining of p62 and LC3B, and the descending aorta was harvested for Western blot analysis of p62.
Cell Culture, Treatment, and Transfection
Human aortic ECs (HAECs), human coronary aortic ECs, human umbilical vascular ECs and EA.hy926 cells were obtained from American Type Tissue Collection. EA.hy926 cells are a human immortalized cell line commonly used to study ECs functions, including angiogenesis, NO production, and inflammation. Human primary and immortalized ECs were tested for mycoplasma contamination before performing the experiments. ECs were cultured in M199 complete medium (20% fetal bovine serum+endothelial cell growth supplement+0.1% Heparin+1% Pen-strep) unless stated otherwise. Off-target-plus siRNAs (Smartpool) against human Cav-1 (Cav-1 siRNA) and control siRNA (nonsilencing control RNA) were obtained from Dharmacon (Lafayette, CO). HAECs, human umbilical vascular ECs, and EA.hy926 cells were transfected with 40 nmol/L siRNA utilizing RNAiMax (Invitrogen) and analyzed 72 hours after transfection. In some experiments, cells were treated with 100 nmol/L of rapamycin (LC Laboratories, Woburn, MA) 24 hours before the end of the transfection period.
Lipid Raft Isolation
Detergent-free lipid raft isolation was performed as described before.23 EA.hy926 cells were grown in 150-mm plates at confluence and washed 3× with ice-cold PBS. Cells were then scraped into 1 mL ice-cold sodium carbonate (500 mmol/L, pH 11.0) supplemented with a cocktail of protease inhibitors, homogenized using a Dounce homogenizer, and sonicated for 30 seconds at setting 2 on the Branson Sonifier 250. An aliquot was kept for protein quantification. Identical amount of protein from the different homogenates was then placed on the bottom of polycarbonate tubes and adjusted to 45% sucrose (w/v) by the addition of 2 mL of 90% sucrose prepared in 25 mmol/L MES (2-[N-morpholino]ethanesulfonic acid; pH 6.5, 0.5 M NaCl). A 5% to 35% discontinuous sucrose gradient was formed (4 mL of 35% sucrose and 4 mL of 5% sucrose, both in MES containing 250 mmol/L sodium carbonate) and centrifuged at 35 000 rpm for 18 hours in a SW40 rotor (Beckman Coulter). Twelve gradient fractions (1 mL) and a pellet were collected from the top and mixed with SDS-PAGE loading buffer. Equal volumes of each fraction were loaded, separated by SDS-PAGE, and assessed by Western blot.
Western Blot Analysis
Cells were lysed in ice-cold buffer containing 50 mmol/L Tris-HCl, pH 7.4, 0.1 mmol/L EDTA, 0.1 mmol/L EGTA, 1% NP-40, 0.1% sodium deoxycholate, 0.1% SDS, 100 mmol/L NaCl, 10 mmol/L NaF, 1 mmol/L sodium pyrophosphate, 1 mmol/L sodium orthovanadate, 1 mmol/L Pefabloc SC, and 2 mg/mL protease inhibitor cocktail (Roche Diagnostics Corp). Protein concentrations were determined using the DC Protein Assay Kit (Bio-Rad Laboratories). Cell lysates containing 12.5 to 25 μg of protein were analyzed by SDS-PAGE and immunoblotting. Primary antibodies used include the following: Cav-1 (No. 610058; BD Biosciences), LC3B (No. 2775; Cell Signaling), SQSTM1/p62 (No. ab56416; Abcam), and β-actin (No. sc-69879; Santa Cruz Biotechnology), PKB/AKT (protein kinase B, also known as Akt; No. 9272; Cell Signaling), p-AKT (No. 9277; Cell Signaling), pS6K (No. 9205; Cell Signaling), S6K (No. 9202; Cell Signaling), ATG5 (No. 2630; Cell Signaling), connexin-43 (Cx-43; No. ab11370; Abcam), vinculin (No. v9131; Sigma), and HSP90 (No. 610419; BD Biosciences). Secondary antibodies were fluorescence-labeled antibodies (LI-COR Biotechnology). Bands were visualized using the Odyssey Infrared Imaging System (LI-COR Biotechnology). Densitometry analysis was performed with ImageJ software (National Institutes of Health) or Image Studio Lite (LI-COR Biosciences).
In Vitro Autophagic Flux
The mCherry-GFP-LC3 plasmid was used to analyze the effect of Cav-1 on autophagic flux in vitro. mCherry-GFP-LC3 functions as an autophagy biosensor capitalizing on the pH difference between the acidic autolysosome and the neutral APG. By combining an acid-sensitive GFP with acid-insensitive mCherry, the acidic environment inside the lysosome quenches the fluorescent signal of GFP, while the mCherry signal is relatively stable. Yellow puncta (GFP positive/mCherry positive) indicate the formation of APGs, with these puncta turning red (GFP negative/mCherry positive) upon fusion of an APG with a lysosome. An increase in autophagy leads to more yellow and red puncta, while blocking fusion of APGs with lysosomes leads to an increase in yellow puncta but a decrease in red puncta. Briefly, EA.hy926 cells were infected with AAV2/2_mCherry-GFP-LC3 for 48 hours following transfection with nonsilencing control RNA or Cav-1 siRNA for 72 hours. After transfection, cells were cultured under basal conditions or in the absence of fetal bovine serum for 6 hours (starvation). Confocal images were analyzed to quantify the amount of green, red, and yellow puncta per cell. Data represent the average of 20 cells per treatment.
Confocal Microscopy
In some in vitro experiments, immunofluorescence staining was analyzed using a Leica SP5 confocal microscope (Wetzlar, Germany). All gains for the acquisition of comparable images were maintained at a constant level. Measurement of Cav-1–positive fluorescence in the plasma membrane versus intracellular was assessed manually and nonblinded method by using Image J software (National Institutes of Health). Fluorescence intensity values (AU) using Image J and corresponding to traced lines in cells cultured in basal conditions or in the absence of fetal bovine serum for 6 hours (starvation) from individual stacks were obtained from at least 3 independent experiments. Data from a representative experiment were exported to and represented using GraphPad Prism 7. Specificity of the positive immunofluorescent staining was corroborated by substituting the primary antibody by a matched immunoglobulin. In some experiments, Pearson correlation coefficient was used to assess colocalization analysis by Image J (Coloc2).
Statistical Analysis
Animal sample size for each study was chosen based on literature documentation of similar well-characterized experiments. The number of animals used in each study is listed in the figure legends. In vitro experiments were routinely repeated at least 3× unless otherwise noted. Data are expressed as mean±SEM unless otherwise indicated. Data analysis was performed using GraphPad Prism Software, version 7 (GraphPad, San Diego, CA). Normality (D′Agostino-Pearson omnibus or Shapiro-Wilk test) and equal variance (Brown-Forsythe) were analyzed using Prism 7 to determine whether the applied parametric test was appropriate. Statistical differences were measured using an unpaired 2-sided Student t test, 1-way ANOVA, or 2-way ANOVA with Bonferroni correction for multiple comparisons. A value of P<0.05 was considered statistically significant.
Results
Cav-1 Restrains Autophagy in the Aortic Endothelium
To assess in detail how Cav-1 influences EC morphology in athero-prone and athero-resistant areas, we analyzed the aortic endothelium in Ldlr−/− and Ldlr−/−Cav-1−/− mice by electron microscopy (Figure 1A). Interestingly, we found that Ldlr−/−Cav-1−/− mice show a 2- to 3-fold increase in vesicular compartments compatible with autophagic vacuoles compared with Ldlr−/− mice, suggesting that the absence of Cav-1 might enhance autophagy in vivo (Figure 1A). Injection with AAV-PCSK9 led to the degradation of hepatic LDLR and rapidly induced hypercholesterolemia.6,24 Immunostaining of athero-prone areas from the Cav-1−/− mice injected with AAV-PCSK9 (Cav-1−/−-AAV-PCSK9) also showed higher levels of LC3B (Figure 1B) and significantly decreased the autophagy substrate p62 (Figure 1C) compared with the WT-AAV-PCSK9 (control mice), suggesting an increase in autophagic flux. Conversely, the reexpression of Cav-1 in the aortic endothelium (Cav-1Rec mice) reduced LC3B expression (Figure 1B) and increased p62 positive staining to similar levels observed in WT mice (Figure 1C), indicating EC autonomy. To confirm that changes in LC3 and p62 levels were indeed a result of increased autophagy, we treated mice with chloroquine to block lysosomal proteolysis and directly measure autophagic flux. We observed an accumulation of LC3B (Figure 1D) and p62 (Figure IA and IB in the Data Supplement) in the aortic endothelium after chloroquine treatment that was significantly higher in Ldlr−/−Cav-1−/− than in the Ldlr−/− group, confirming an increase of autophagic flux in vivo in the absence of Cav-1.
Figure 1.
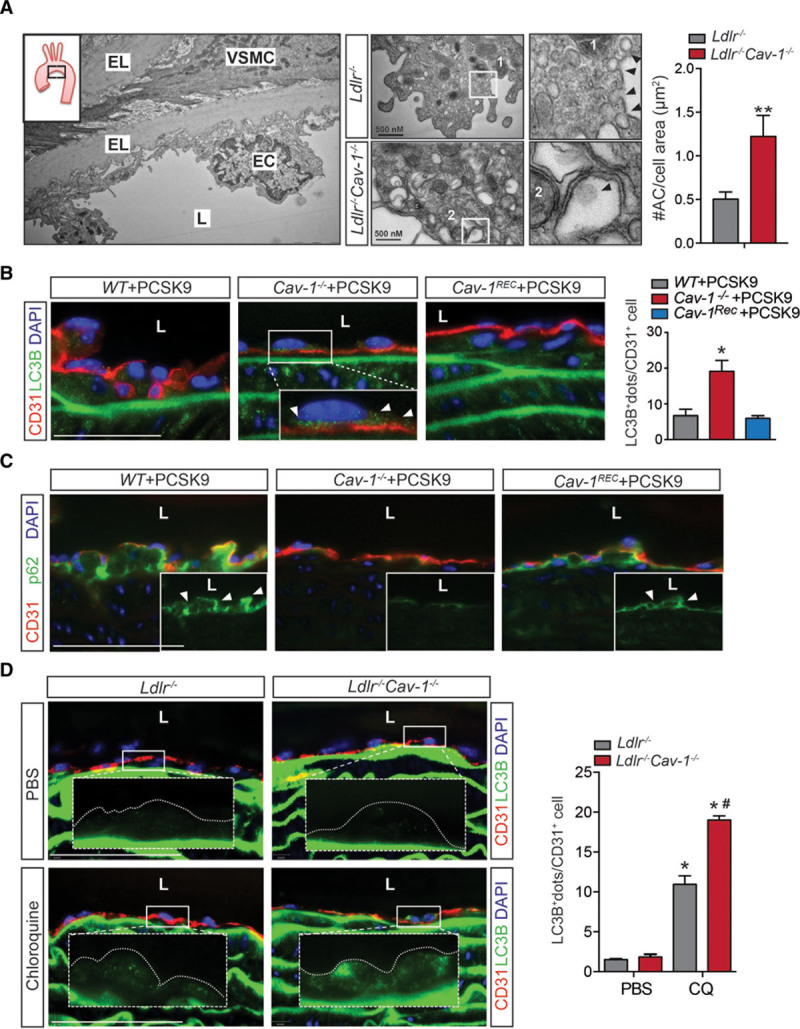
Lack of Cav-1 (caveolin-1) in endothelial cells (ECs) promotes autophagy in vivo. A, Representative electron microscopy (EM) image of the lesser curvature of Ldlr−/− mice (left). Middle, Representative EM images of aortic ECs from the lesser curvature of Ldlr−/− and Ldlr−/−Cav-1−/− mice. Quantification of autophagosomes in ECs from the athero-prone area of the aortic arch in Ldlr−/− and Ldlr−/−Cav-1−/− mice is shown in the right and is expressed as number of autophagosomes (#AC)/cell area (µm2). Data represent mean±SEM (**P<0.01; n=3, average of 20 images per mouse). B, Representative immunofluorescence images of LC3B (light chain 3B) and CD31 (cluster of differentiation 31) staining in the lesser curvature of WT, Cav-1−/−, and Cav-1Rec mice treated with adeno-associated virus (AAV)-PCSK9. White arrows in the magnified images indicate LC3B+ dots. Quantification is shown in right and represents the mean of LC3B+ dots per CD31+ cell (n=4 mice in each group and 15–30 ECs per mouse). Data represent the mean±SEM (*P<0.05). C, Representative immunofluorescence images of p62 and CD31 staining in the lesser curvature of WT, Cav-1−/−, and Cav-1Rec mice treated with AAV-PCSK9. D, Representative immunofluorescence images of LC3B and CD31 staining in the lesser curvature of Ldlr−/− and Ldlr−/−Cav-1−/− mice treated with PBS or Chloroquine. Quantification of LC3B+ staining is represented in right (n=4 mice in each group). Data represent the mean±SEM. *P<0.05 compared with Ldlr−/− mice treated with PBS; #P<0.05 compared with Ldlr−/− mice treated with chloroquine (CQ). Data were analyzed by an unpaired 2-sided Student t test (A), 1-way ANOVA (B), or 2-way ANOVA (D) with Bonferroni correction for multiple comparisons. Scale bar=100 μm. EL indicates elastic lamina; L, lumen; and VSMC, vascular smooth muscle cell.
Cav-1 Regulates Autophagy by Attenuating Autophagic Flux in Human ECs
We next assessed how Cav-1 expression influenced activation of autophagy in HAECs. Similar to the results observed in vivo, Cav-1 knockdown significantly increased LC3B puncta (Figure 2A) and reduced p62 levels (Figure 2B), suggesting that Cav-1–deficient ECs have an increased autophagic flux compared with control cells. Rapamycin treatment was used as a positive control for autophagy induction in HAECs (Figure 2A). To further demonstrate that Cav-1 expression influences the autophagic flux, we infected EA.hy926 cells with a construct encoding a mCherry-GFP-LC3 reporter gene.25 This approach facilitates the identification of APGs in both fluorescence colors and autolysosomes only in red fluorescence (GFP fluorescence is quenched at low pH as found in lysosomes). The ratio between the only red (autolysosomes) and dual color puncta indicates the measurement of the autophagic flux. Silencing of Cav-1 under starvation conditions (serum deprivation) significantly increased the total number of autophagic vacuoles as a result of higher content of both APGs and autolysosomes, thus suggesting that the higher autophagic flux observed in the Cav-1–deficient ECs was a combination of higher induction of autophagy and efficient APG clearance (Figure 2C). In agreement with these results, silencing Cav-1 in mouse fibroblast (NIH3T3 cells) resulted in significantly higher rates of lysosomal degradation of long-lived proteins compared with cells transfected with a nontargeting control sequence (nonsilencing control RNA; Figure II in the Data Supplement). This is consistent with results observed previously in ECs and adipocytes,13,16 indicating the important role of Cav-1 on autophagic flux in different cell types. Similarly, we observed a slight increase in autophagic flux under basal conditions in mouse fibroblasts (Figure II in the Data Supplement). Together, these results demonstrate that Cav-1/caveolae influence autophagic flux in ECs.
Figure 2.
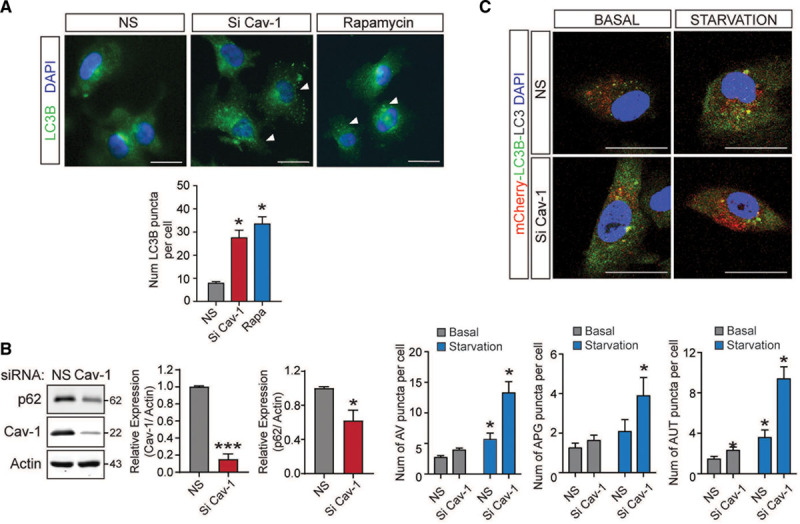
Inhibition of Cav-1 (caveolin-1) increases autophagy in endothelial cells (ECs) in vitro. A, Representative immunofluorescence images of LC3B (light chain 3B) expression in human aortic endothelial cells (HAECs) transfected with nonsilencing siRNA (NS) or Cav-1 siRNA (Si Cav-1) and incubated with rapamycin (100 nmol/L) to stimulate autophagy. Quantification is shown in the bottom and represents the number of LC3B puncta per cell (n=3 cells per field, 6 fields per experiment). Data represent the mean of 3 individual experiments±SEM (*P<0.05 compared with NS). B, Representative Western blot analysis of p62 and Cav-1 in HAECs transfected with NS or Cav-1 siRNA (Si Cav-1). Actin was used as a loading control. Quantification is shown in the right. Experiments were performed 3 independent times. Data represent the mean±SEM (*P<0.05 and ***P<0.001 compared with NS) and were analyzed by an unpaired 2-sided Student t test. C, Effect of Cav-1 silencing on regulation of macroautophagy. Representative fluorescence images from EA.hy926 cells transfected with NS or Si Cav-1, transduced with an mCherry-GFP (green fluorescent protein)-LC3 reporter construct, and incubated in the presence (basal) or absence (starvation) of serum. The number of autophagic vacuoles (AVs), autophagosomes (APGs), and autolysosomes (AUT) is shown in the bottom. Data represent the mean±SEM (*P<0.05 compared with NS under basal condition) from 20 cells per triplicate. Data were analyzed by 2-way ANOVA with Bonferroni correction for multiple comparisons. Scale bar=10 µm.
Autophagy Regulates Cav-1 Cellular Localization
To determine the potential mechanism of enhanced autophagy in Cav-1–deficient HAECs, we initially analyzed whether Cav-1 silencing influences mTOR (mammalian target of rapamycin) signaling, which has been associated to the regulation of autophagy.26,27 As seen in Figure III in the Data Supplement, Cav-1 inhibition does not affect mTOR signaling or LC3BII expression. Rapamycin was used as a positive control (Figure III in the Data Supplement). A previous report has identified the relevance of Cx-43—a lipid raft/caveolae associated protein, in regulating the initial steps during APG formation.28 Connexins constitutively attenuate autophagy via direct interaction with several ATGs involved in the APG formation such as ATG16 and components of the PI3K (phosphoinositide 3-kinase) autophagy initiation complex (Vps34 [vacuolar protein sorting 34], Beclin-1, and Vps15).28 Vps34-dependent phosphorylation of lipids in specific intracellular membrane regions marks the site from where the APG membranes emerge and elongate through covalent conjugation of ATG5/ATG12/ATG16. Based on these observations, we wondered whether Cav-1 inhibition might influence the cellular localization of some APG components. To this end, we first determined how Cav-1 expression influences the cellular distribution of ATG5 using discontinuous sucrose gradient fractionation. This method allows the separation of tightly embedded membrane proteins that are buoyant (fractions 4–5, contains lipid rafts and caveolae) and nonraft proteins at the bottom of the gradient (fractions 7-P; Figure IV in the Data Supplement). Our results showed a partial localization of ATG5 and LC3BII in the lipid raft fractions that cofractioned with Cav-1 (Figure 3A, quantified in right), while ATG5 levels in raft fractions were reduced by the inhibition of Cav-1 protein expression (Figure 3B). Interestingly, ATG5 levels decrease in lipid raft fractions in cells treated with the autophagy inducer rapamycin (Figure 3C, quantified in right). Indeed, densitometric analysis of concentrated lipid rafts showed a decreased ratio of ATG5/Cav-1 in cells treated with Rapamycin (Figure 3D). Together, our results suggest that release of ATG5 from the caveolae might promote APG formation and autophagic flux.
Figure 3.
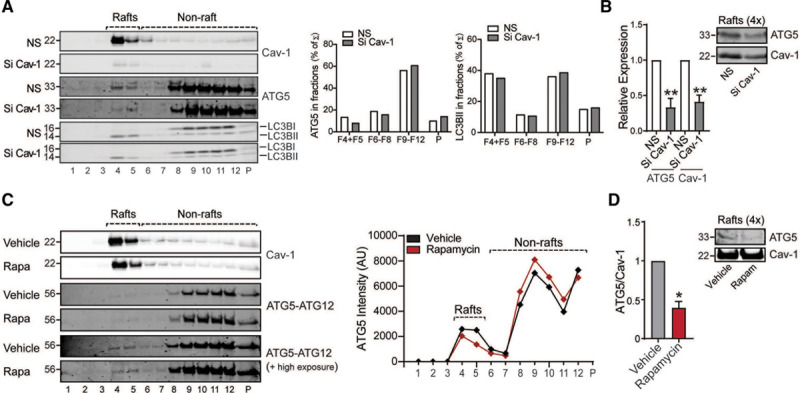
Cav-1 (caveolin-1) influences localization of autophagy components in lipid raft fraction from endothelial cells (ECs). A, Representative Western blot of lipid raft fractionation in EA.hy926 cells transfected with nonsilencing siRNA (NS) or Cav-1 siRNA (Si Cav-1) showing differential distribution of autophagy components in different fractions. Right represents densitometric analysis of autophagy components in the fractions. B, Western blot analysis of ATG (autophagy-related protein)-5 and Cav-1 in concentrated raft fractions showing a reduction of ATG5 levels in Cav-1 knockdown cells. Equivalent amounts of protein were loaded, and the densitometric analysis is represented as relative expression compared with nonsilencing cells (n=3 each group). C, Representative Western blots of ATG5-ATG12 in lipid raft fractions from EA.hy926 cells treated with rapamycin or vehicle. Graph on the right represents the densitometric analysis of ATG5 in the sucrose fractions showing the differential distribution in the lipid raft vs nonraft fractions from ECs upon rapamycin stimulation. D, Western blot analysis of ATG5 and Cav-1 in concentrated lipid raft fractions showing a reduction of ATG5 levels upon rapamycin stimulation and its densitometric analysis represented as the ATG5/Cav-1 ratio (n=3 each group). Data in B and D represent the mean±SEM. *P<0.05 compared with vehicle; **P<0.01 compared with NS. Data presented in B and D were analyzed by an unpaired 2-sided Student t test.
Next, we analyzed whether the induction of autophagy influences Cav-1 expression and cellular localization in ECs. To test this hypothesis, we induced autophagy in ECs by culturing the cells in the absence of serum (serum starvation). Under these conditions, ECs showed an increase in LC3B punctate, increased levels of LC3BII, and a decrease of p62 levels (Figure V in the Data Supplement). Notably, we observed that Cav-1 cellular localization was significantly altered upon autophagy induction. In basal conditions, Cav-1 is predominantly located in the plasma membrane, whereas during starvation, Cav-1 is internalized in intracellular vesicles (Figure 4A and 4B). In agreement with this finding, sucrose gradient fractionation analysis demonstrated a significant increase of Cav-1 expression in nonraft fractions upon starvation, indicating a translocation toward intracellular membrane compartments during autophagy activation (Figure 4C, quantified in bottom). Similarly, ATG5 and Cx-43 cellular distribution was also altered after autophagy induction (Figure 4C and 4D). We further characterized the intracellular localization of Cav-1 after autophagy induction. Interestingly, Cav-1 partially colocalized with LysoTracker in ECs, as well as with LC3B, under starvation conditions (Figure 4E and 4F; Figure VI in the Data Supplement). Our results are in agreement with previous reports that have shown the presence of Cav-1 in lysosomal compartments during serum deprivation.29 Overall, these findings suggest that Cav-1 might influence autophagy by regulating the cellular localization of APG components and that the induction of autophagy promotes Cav-1 cellular redistribution.
Figure 4.
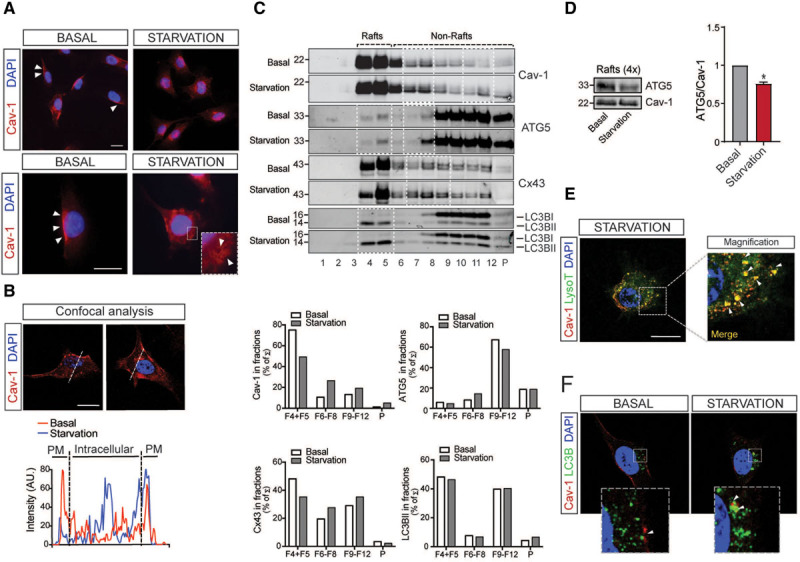
Starvation mediates changes in Cav-1 (caveolin-1) subcellular localization. A, Representative confocal images of Cav-1 expression (red) in EA.hy926 cells exposed to basal and starvation conditions. Scale bars=10 µm (top) and 5 µm (bottom). Nuclei were stained with DAPI (4′,6-diamidino-2-phenylindole dihydrochloride; blue). Experiments were performed 3 independent times. B, Representative analysis of Cav-1 expression by confocal microscopy in EA.hy926 cells. Fluorescence intensity plots for Cav-1 and signals along the arrow in the image during basal (red) and starvation conditions (blue) are shown in the bottom. Scale bars=5 µm. Similar fluorescence intensity plot was observed in EA.hy926 cells cultured under the same conditions in 3 independent experiments. C, Representative Western blot analysis of lipid raft fractionation in EA.hy926 cells cultured in basal conditions or fetal bovine serum starvation for 6 h showing differential distribution of Cav-1, ATG (autophagy-related protein)-5, Cx-43 (connexin-43), and LC3B (light chain 3B) along the sucrose fractions (highlighted in white squares). Densitometric analysis is shown in the bottom. D, Western blot analysis of ATG5 and Cav-1 in concentrated lipid raft fractions (F4+5) showing a reduction of ATG5 levels under starvation condition and its densitometric analysis represented as the ATG5/Cav-1 ratio (n=3 each group). Data represent the mean±SEM and were analyzed by an unpaired 2-sided Student t test. *P<0.05 compared with lipid rafts under basal condition. E, Representative confocal images of EA.hy926 cells stained with Cav-1 (red) and LysoTracker (green) during starvation. Scale bars=5 µm. Detailed magnification on the right shows colocalization of LysoTracker positive vesicles with Cav-1 (arrows). Similar Cav-1 intracellular localization was observed in 10 to 15 cells analyzed in 3 independent times. F, Representative confocal images of EA.hy926 cells stained with Cav-1 (red) and LC3B (green) in basal and starvation conditions. Magnifications in the bottom show increased colocalization of Cav-1 with LC3B during starvation (arrows). Experiments were performed 3 independent times. Scale bar=5 µm. PM indicates plasma membrane.
Silence ATG5 Abrogates the Anti-Inflammatory Effect of Cav-1 Knockdown in ECs
We previously reported that Cav-1 suppression attenuates proinflammatory cytokines (TNFα [tumor necrosis factor-α] and IL1β [interleukin-1β]) and oscillatory flow-induced inflammatory activation in ECs.6 Since autophagy has been associated with EC activation,8,30 we next analyzed whether suppression of autophagy attenuates the anti-inflammatory phenotype observed in Cav-1 silenced ECs. As expected, Cav-1 silencing reduces VCAM1 expression in ECs stimulated with TNFα or IL1β. This effect was abrogated in cells transfected with ATG5 siRNA, suggesting that Cav-1 might control EC activation through regulation of autophagy (Figure 5).
Figure 5.
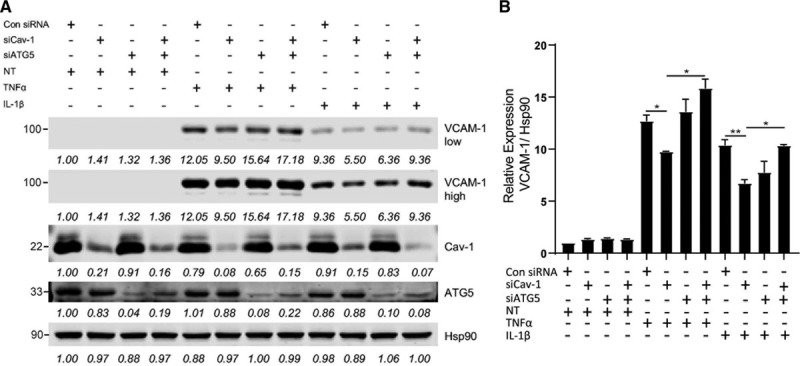
ATG (autophagy-related protein)-5 inhibition attenuates anti-inflammatory effect of Cav-1 (caveolin-1) knockdown in endothelial cell (EC). A, Representative Western blot analysis of VCAM1 (vascular cell adhesion molecule 1), Cav-1, ATG5, and HSP90 expression in human aortic endothelial cells (HAECs) transfected with nonsilencing siRNA, Cav-1 siRNA (Si Cav-1), or ATG5 siRNA (Si ATG5) and treated or not with TNFα (tumor necrosis factor-α) or IL1β (interleukin-1β). Densitometric analysis showing the intensity of the bands normalized by HSP90 (loading control) is shown below each band. B, Quantification of VCAM1 levels in ECs treated with TNFα or IL1β (n=3 independent experiments). Data represent the mean±SEM. *P<0.05 and **P<0.01 compared with Si Cav-1. Data were analyzed by 1-way ANOVA with Bonferroni correction for multiple comparisons.
Inhibition of Autophagy Attenuates the Atheroprotection Observed in Cav-1–Deficient Mice
Previous reports have shown that autophagy regulates EC inflammation, endothelial-to-mesenchymal transition, redox status, and LDL transcytosis.8,12,16,31 The physiological relevance of autophagy in ECs during atherogenesis has recently been revealed.12 Mice lacking ATG7 in the endothelium develop larger atherosclerotic plaques, suggesting that endothelial autophagic flux protects against the progression of atherosclerosis. Mechanistically, the authors found that impaired autophagic flux promotes lipid deposition in the artery wall and enhances vascular inflammation. To investigate the extent to which autophagy contributes to the atheroprotection observed in the absence of Cav-1, WT and Cav-1−/− mice were injected with AAV-PCSK9, treated with the autophagy inhibitor 3-MA and fed a Western-type diet for 4 weeks. Immunostaining and Western blot analysis of p62 in the aorta confirmed the effectiveness of the 3-MA treatment in both WT and Cav-1−/− mice (Figure 6A and 6B; Figure VII in the Data Supplement). 3-MA treatment did not influence Cav-1 expression in ECs (Figure VII in the Data Supplement), and circulating cholesterol and triglycerides levels were not altered compared with untreated WT and Cav-1−/− mice (Figure 6C; Figure VIII in the Data Supplement). Based on our previous findings, the deficiency of Cav-1 in ECs reduced atherosclerosis by inhibiting LDL transcytosis and vascular inflammation.4,6 In this study, we found that the absence of Cav-1 attenuated lipid accumulation in atherosclerotic lesions of mice treated with 3-MA, suggesting that the increased autophagic flux observed in Cav-1–deficient mice does not contribute to lipoprotein transport or retention in the artery wall (Figure 6D, quantified in right). However, Cav-1 deficiency no longer resulted in changes in atherosclerotic plaque size following treatment with 3-MA (Figure 6E, quantified in right). Mechanistically, we found that 3-MA impairs the anti-inflammatory effect (VCAM1 expression and CD68+ cells in atherosclerotic plaques) found in Cav-1−/− mice (Figure 6F and 6G, quantified in right). Together, these results identified autophagy as a relevant mechanistic component of the atheroprotective effects observed in the absence of Cav-1.
Figure 6.
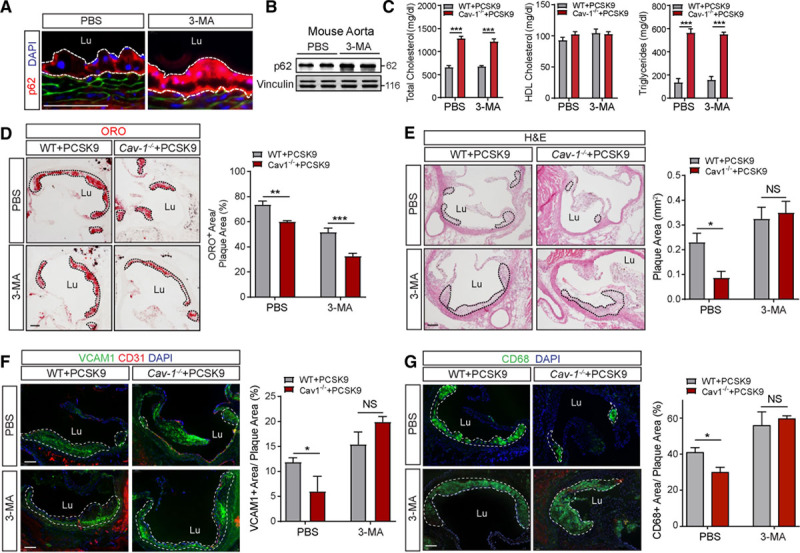
Inhibition of autophagy attenuates the atheroprotection observed in the absence of Cav-1 (caveolin-1). A, Representative immunofluorescence images of p62 staining in the lesser aortic curvature of WT mice injected with adeno-associated virus (AAV)-PCSK9, treated with 3-methyladenine (3-MA) or PBS, and fed a Western-type diet (WD) for 4 wk. B, Western blot analysis of p62 expression in aortas from WT (wild type) mice treated as indicated in A. Vinculin was used as loading control. C, Total cholesterol, HDL (high-density lipoprotein) cholesterol, and triglyceride levels in WT and Cav-1−/− mice injected with AAV-PCSK9, treated with 3-MA, and fed a WD for 4 wk. Data represent the mean±SEM (n=7 per group). ***P<0.001 compared with the PBS control group. Data were analyzed by 2-way ANOVA with Bonferroni correction for multiple comparisons. D–G, Representative histological analysis by hematoxylin and eosin (H&E) staining (D), oil red O (ORO; E), VCAM1 (vascular cell adhesion molecule 1; F), and CD68 (cluster of differentiation 68; G) of aortic roots isolated from WT and Cav-1−/− mice injected with AAV-PCSK9, treated or not with the autophagy inhibitor 3-MA, and fed a WD for 4 wk. Quantification of the lesion area is shown in the right and represents the mean±SEM (n=4 per group). *P<0.05, **P<0.01, and ***P<0.001 compared with the PBS control group. Data were analyzed by 2-way ANOVA with Bonferroni correction for multiple comparisons. Scale bar=100 µm. NS indicates nonsilencing RNA.
Discussion
In this study, we demonstrate that the absence of Cav-1 promotes autophagy activation in the aortic endothelium, which attenuates vascular inflammation and the initiation of atherosclerosis. These findings provide novel mechanistic insight into how endothelial Cav-1 expression might regulate the progression of atherosclerosis and suggest that increased autophagy might be involved in mediating some of the other atheroprotective effects observed in Cav-1–deficient mice, including the decrease of EC activation and LDL transport into the arterial wall.4,32 The autophagy pathway is considered an important regulator of both inflammation and lipid metabolism.33,34 Despite the presence of numerous autophagy-stimulating factors (oxidized lipids, proinflammatory cytokines, and reactive oxygen species) within atherosclerotic plaques, recent reports have identified the dysfunction of autophagy during atherogenesis.35,36 Most importantly, a number of studies using cell type–specific deletion of ATG5 or ATG7 in ECs, vascular smooth muscle cells, and macrophages have demonstrated that defective autophagy in vascular and inflammatory cells accelerates atherogenesis.12,37,38 In particular, defective autophagy in ECs accelerates atherogenesis in hypercholesterolemic mice by promoting endothelial inflammation, senescence, and lipid retention.8,12
Previous studies have shown that Cav-1 knockdown in ECs promotes mitochondrial reactive oxygen species production, metabolic switching, and autophagic flux.16 However, the pathways connecting mitochondrial oxidative metabolism, bioenergetics, and plasma membrane content with accelerated autophagy in Cav-1 deficient ECs remained poorly understood. More than 30 ATG proteins are involved in the APG formation and regulation, as components of several discrete functional units.39 Two ubiquitin-like systems are key to APG formation including ATG5-ATG12 conjugation and LC3 processing.40,41 Notably, the localization of ATG5 in Cav-1 enriched lipid rafts and their direct interaction observed in this study and other group suggests that Cav-1 might suppress the activation of autophagy by interacting with ATG5, ATG12, and the active ATG5-ATG12 complex in ECs.42 Moreover, we found that the absence of Cav-1 influenced the cellular distribution of ATG5 and enhanced the release of ATG5 from other lipid raft fractions in the plasma membrane, which might be attributed to increased APG formation and autophagic flux in Cav-1–deficient mice. Besides the ATG5-ATG12 complex, Cx-43—a major component of plasma membrane gap junctions—has been previously shown to interact directly with Cav-1 and translocate intracellularly upon starvation as a requirement for autophagy activation, demonstrating a novel role of raft-enriched membrane proteins in this cellular process.28,43,44 Cx-43 also associates with several ATGs that are involved in the initial steps of APG formation, such as ATG6 and components of the PI3K autophagy initiation complex (Vps34, Beclin-1, and Vps15), and downregulates APG formation and autophagy activation.28 Most Cav-1–interacting proteins are retained and kept inactive in the caveolae due to their interaction with the caveolin-binding domain. Therefore, it is conceivable that upon autophagy activation, the interaction of autophagy components with Cav-1 in the plasma membrane is disrupted as we observed during starvation, releasing components like ATG5 and Cx-43 interacting proteins from the plasma membrane to initiate the formation of APG vesicles. Notably, we found that after induction of autophagy, Cav-1 translocated from the plasma membrane to intracellular membrane compartments, which further regulated the cellular distribution of APG components that interact directly with Cav-1 including ATG5 and Cx-43. The effects of Cav-1 on the cellular distribution of APG components provide further evidence of the regulation of APG formation and autophagy activation by Cav-1.
Our previous studies demonstrated that the absence of Cav-1 protects against atherosclerosis by attenuating LDL transcytosis and vascular inflammation independently of endothelial NO activation.6 Here, we found that suppression of autophagy in vivo using 3-MA, in part, abrogates the beneficial effects of Cav-1 deficiency during the initiation of atherosclerosis. Mechanistically, we discovered that inhibition of autophagic flux attenuates the anti-inflammatory effects observed in Cav-1 silenced ECs and in the endothelium of Cav-1−/− mice. We also found that increased autophagic flux in Cav-1−/− mice does not influence neutral lipid accumulation. These results were unexpected based in previous studies by Finkel et al12 demonstrating that autophagy controls lipoprotein transcytosis in vivo. Together, these results suggest that the increased autophagy found in mice lacking Cav-1 might protect against the progression of atherosclerosis by lessening vascular inflammation and macrophage infiltration in the artery wall. These findings are in accordance with our previous observations showing that overexpression of Cav-1 in ECs promotes atherosclerosis by increasing the expression of VCAM1 in the aortic endothelium.32 While these results suggest that the absence of Cav-1 in ECs diminishes inflammation through increasing autophagy, 3-MA treatment might also influence vascular smooth muscle cell and macrophage functions influencing atherogenesis.22 In fact, previous studies have shown that 3-MA administration to mice impairs atherosclerotic plaque progression and improves lesion stability by modulating macrophage autophagy, suppressing foam cell formation, and altering the immune microenvironment.22 Furthermore, autophagy is involved in the mobilization of lipid droplet-associated cholesterol for efflux, thereby impairing macrophage foam cell formation, which may also contribute to the progression of atherosclerosis.45 In contrast, inhibition of autophagy by 3-MA enhances vascular smooth muscle cell death and necrosis,46 which might promote the development of atherosclerosis as observed with vascular smooth muscle cell–specific deletion of ATG7 in mice.47 These studies provide evidence of both antiatherosclerotic and proatherosclerotic effects of 3-MA in the vessel wall. Further studies using endothelial-specific autophagy-deficient mice will be important for dissecting the specific contribution of autophagy in mice lacking Cav-1 during atherogenesis.
In summary, this study reports that Cav-1 deficiency in vivo significantly increased the autophagy flux in the endothelium of large vessels. The increased autophagy provides a novel mechanism by which the absence of Cav-1 protects against the progression of atherosclerosis and provides novel insight into the mechanisms by which Cav-1 expression controls autophagy.
Sources of Funding
This work was supported by grants from the National Institutes of Health (R35HL135820 to C. Fernández-Hernando; R01HL105945 and R01HL135012 to Y. Suárez; R35HL139945 and P01HL1070205 to W.C. Sessa), the American Heart Association (16EIA27550005 to C. Fernández-Hernando; 16GRNT26420047 to Y. Suárez; 17POST33650088 to J. Madrigal-Matute, James and Donna Dickenson-Sublett Award for the Advancement of Cardiovascular Research, SDG23000025 to C.M. Ramírez, and American Heart Association Merit Award to W.C. Sessa), TALENTO Program from Madrid Government, Spain (2017-T1/BMD-5333 to C.M. Ramírez), the Foundation Leducq Transatlantic Network of Excellence in Cardiovascular Research MIRVAD (MicroRNA-based Therapeutic Strategies in Vascular Disease; to C. Fernández-Hernando and W.C. Sessa), and RA15CVD04 (to A.M. Cuervo and J. Madrigal-Matute).
Disclosures
None.
Supplementary Material
Nonstandard Abbreviations and Acronyms
- 3-MA
- 3-methyladenine
- AAV
- adeno-associated virus
- APG
- autophagosome
- ATG
- autophagy-related protein
- Cav-1
- caveolin-1
- Cx-43
- connexin-43
- EC
- endothelial cell
- HAEC
- human aortic endothelial cell
- IL1β
- interleukin-1β
- LDL
- low-density lipoprotein
- LDLR
- low-density lipoprotein receptor
- ORO
- oil red O
- PCKS9
- proprotein convertase subtilisin/kexin type 9
- SS
- shear stress
- TNFα
- tumor necrosis factor-α
- Vps34
- vacuolar protein sorting 34
- WT
- wild type
For Sources of Funding and Disclosures, see page 1521.
These authors contributed equally to this article.
The Data Supplement is available with this article at https://www.ahajournals.org/doi/suppl/10.1161/ATVBAHA.120.314291.
References
- 1.Caro CG, Fitz-Gerald JM, Schroter RC. Arterial wall shear and distribution of early atheroma in man. Nature. 1969;223:1159–1160. doi: 10.1038/2231159a0. doi: 10.1038/2231159a0. [DOI] [PubMed] [Google Scholar]
- 2.Gimbrone MA, Jr, García-Cardeña G. Endothelial cell dysfunction and the pathobiology of atherosclerosis. Circ Res. 2016;118:620–636. doi: 10.1161/CIRCRESAHA.115.306301. doi: 10.1161/CIRCRESAHA.115.306301. [DOI] [PMC free article] [PubMed] [Google Scholar]
- 3.Liu P, Rudick M, Anderson RG. Multiple functions of caveolin-1. J Biol Chem. 2002;277:41295–41298. doi: 10.1074/jbc.R200020200. doi: 10.1074/jbc.R200020200. [DOI] [PubMed] [Google Scholar]
- 4.Fernández-Hernando C, Yu J, Suárez Y, Rahner C, Dávalos A, Lasunción MA, Sessa WC. Genetic evidence supporting a critical role of endothelial caveolin-1 during the progression of atherosclerosis. Cell Metab. 2009;10:48–54. doi: 10.1016/j.cmet.2009.06.003. doi: 10.1016/j.cmet.2009.06.003. [DOI] [PMC free article] [PubMed] [Google Scholar]
- 5.Pavlides S, Gutierrez-Pajares JL, Iturrieta J, Lisanti MP, Frank PG. Endothelial caveolin-1 plays a major role in the development of atherosclerosis. Cell Tissue Res. 2014;356:147–157. doi: 10.1007/s00441-013-1767-7. doi: 10.1007/s00441-013-1767-7. [DOI] [PMC free article] [PubMed] [Google Scholar]
- 6.Ramírez CM, Zhang X, Bandyopadhyay C, Rotllan N, Sugiyama MG, Aryal B, Liu X, He S, Kraehling JR, Ulrich V, et al. Caveolin-1 regulates atherogenesis by attenuating low-density lipoprotein transcytosis and vascular inflammation independently of endothelial nitric oxide synthase activation. Circulation. 2019;140:225–239. doi: 10.1161/CIRCULATIONAHA.118.038571. doi: 10.1161/CIRCULATIONAHA.118.038571. [DOI] [PMC free article] [PubMed] [Google Scholar]
- 7.Mizushima N, Komatsu M. Autophagy: renovation of cells and tissues. Cell. 2011;147:728–741. doi: 10.1016/j.cell.2011.10.026. doi: 10.1016/j.cell.2011.10.026. [DOI] [PubMed] [Google Scholar]
- 8.Vion AC, Kheloufi M, Hammoutene A, Poisson J, Lasselin J, Devue C, Pic I, Dupont N, Busse J, Stark K, et al. Autophagy is required for endothelial cell alignment and atheroprotection under physiological blood flow. Proc Natl Acad Sci USA. 2017;114:E8675–E8684. doi: 10.1073/pnas.1702223114. doi: 10.1073/pnas.1702223114. [DOI] [PMC free article] [PubMed] [Google Scholar]
- 9.Guo F, Li X, Peng J, Tang Y, Yang Q, Liu L, Wang Z, Jiang Z, Xiao M, Ni C, et al. Autophagy regulates vascular endothelial cell eNOS and ET-1 expression induced by laminar shear stress in an ex vivo perfused system. Ann Biomed Eng. 2014;42:1978–1988. doi: 10.1007/s10439-014-1033-5. doi: 10.1007/s10439-014-1033-5. [DOI] [PubMed] [Google Scholar]
- 10.Liu J, Bi X, Chen T, Zhang Q, Wang SX, Chiu JJ, Liu GS, Zhang Y, Bu P, Jiang F. Shear stress regulates endothelial cell autophagy via redox regulation and Sirt1 expression. Cell Death Dis. 2015;6:e1827. doi: 10.1038/cddis.2015.193. doi: 10.1038/cddis.2015.193. [DOI] [PMC free article] [PubMed] [Google Scholar]
- 11.Yao P, Zhao H, Mo W, He P. Laminar shear stress promotes vascular endothelial cell autophagy through upregulation with Rab4. DNA Cell Biol. 2016;35:118–123. doi: 10.1089/dna.2015.3041. doi: 10.1089/dna.2015.3041. [DOI] [PubMed] [Google Scholar]
- 12.Torisu K, Singh KK, Torisu T, Lovren F, Liu J, Pan Y, Quan A, Ramadan A, Al-Omran M, Pankova N, et al. Intact endothelial autophagy is required to maintain vascular lipid homeostasis. Aging Cell. 2016;15:187–191. doi: 10.1111/acel.12423. doi: 10.1111/acel.12423. [DOI] [PMC free article] [PubMed] [Google Scholar]
- 13.Le Lay S, Briand N, Blouin CM, Chateau D, Prado C, Lasnier F, Le Liepvre X, Hajduch E, Dugail I. The lipoatrophic caveolin-1 deficient mouse model reveals autophagy in mature adipocytes. Autophagy. 2010;6:754–763. doi: 10.4161/auto.6.6.12574. doi: 10.4161/auto.6.6.12574. [DOI] [PubMed] [Google Scholar]
- 14.Wu D, Xie F, Xiao L, Feng F, Huang S, He L, Liu M, Zhou Q, Li L, Chen L. Caveolin-1-autophagy pathway mediated cardiomyocyte hypertrophy induced by apelin-13. DNA Cell Biol. 2017;36:611–618. doi: 10.1089/dna.2016.3574. doi: 10.1089/dna.2016.3574. [DOI] [PubMed] [Google Scholar]
- 15.Shi Y, Tan SH, Ng S, Zhou J, Yang ND, Koo GB, McMahon KA, Parton RG, Hill MM, Del Pozo MA, et al. Critical role of CAV1/caveolin-1 in cell stress responses in human breast cancer cells via modulation of lysosomal function and autophagy. Autophagy. 2015;11:769–784. doi: 10.1080/15548627.2015.1034411. doi: 10.1080/15548627.2015.1034411. [DOI] [PMC free article] [PubMed] [Google Scholar]
- 16.Shiroto T, Romero N, Sugiyama T, Sartoretto JL, Kalwa H, Yan Z, Shimokawa H, Michel T. Caveolin-1 is a critical determinant of autophagy, metabolic switching, and oxidative stress in vascular endothelium. PLoS One. 2014;9:e87871. doi: 10.1371/journal.pone.0087871. doi: 10.1371/journal.pone.0087871. [DOI] [PMC free article] [PubMed] [Google Scholar]
- 17.Murata T, Lin MI, Huang Y, Yu J, Bauer PM, Giordano FJ, Sessa WC. Reexpression of caveolin-1 in endothelium rescues the vascular, cardiac, and pulmonary defects in global caveolin-1 knockout mice. J Exp Med. 2007;204:2373–2382. doi: 10.1084/jem.20062340. doi: 10.1084/jem.20062340. [DOI] [PMC free article] [PubMed] [Google Scholar]
- 18.Robinet P, Milewicz DM, Cassis LA, Leeper NJ, Lu HS, Smith JD. Consideration of sex differences in design and reporting of experimental arterial pathology studies-statement from ATVB Council. Arterioscler Thromb Vasc Biol. 2018;38:292–303. doi: 10.1161/ATVBAHA.117.309524. doi: 10.1161/ATVBAHA.117.309524. [DOI] [PMC free article] [PubMed] [Google Scholar]
- 19.Frank PG, Lee H, Park DS, Tandon NN, Scherer PE, Lisanti MP. Genetic ablation of caveolin-1 confers protection against atherosclerosis. Arterioscler Thromb Vasc Biol. 2004;24:98–105. doi: 10.1161/01.ATV.0000101182.89118.E5. doi: 10.1161/01.ATV.0000101182.89118.E5. [DOI] [PubMed] [Google Scholar]
- 20.Guevara NV, Kim HS, Antonova EI, Chan L. The absence of p53 accelerates atherosclerosis by increasing cell proliferation in vivo. Nat Med. 1999;5:335–339. doi: 10.1038/6585. doi: 10.1038/6585. [DOI] [PubMed] [Google Scholar]
- 21.Ylä-Anttila P, Vihinen H, Jokitalo E, Eskelinen EL. Monitoring autophagy by electron microscopy in mammalian cells. Methods Enzymol. 2009;452:143–164. doi: 10.1016/S0076-6879(08)03610-0. doi: 10.1016/S0076-6879(08)03610-0. [DOI] [PubMed] [Google Scholar]
- 22.Dai S, Wang B, Li W, Wang L, Song X, Guo C, Li Y, Liu F, Zhu F, Wang Q, et al. Systemic application of 3-methyladenine markedly inhibited atherosclerotic lesion in ApoE-/- mice by modulating autophagy, foam cell formation and immune-negative molecules. Cell Death Dis. 2016;7:e2498. doi: 10.1038/cddis.2016.376. doi: 10.1038/cddis.2016.376. [DOI] [PMC free article] [PubMed] [Google Scholar]
- 23.Song KS, Shengwen Li, Okamoto T, Quilliam LA, Sargiacomo M, Lisanti MP. Co-purification and direct interaction of Ras with caveolin, an integral membrane protein of caveolae microdomains. Detergent-free purification of caveolae microdomains. J Biol Chem. 1996;271:9690–9697. doi: 10.1074/jbc.271.16.9690. doi: 10.1074/jbc.271.16.9690. [DOI] [PubMed] [Google Scholar]
- 24.Goettsch C, Hutcheson JD, Hagita S, Rogers MA, Creager MD, Pham T, Choi J, Mlynarchik AK, Pieper B, Kjolby M, et al. A single injection of gain-of-function mutant PCSK9 adeno-associated virus vector induces cardiovascular calcification in mice with no genetic modification. Atherosclerosis. 2016;251:109–118. doi: 10.1016/j.atherosclerosis.2016.06.011. doi: 10.1016/j.atherosclerosis.2016.06.011. [DOI] [PMC free article] [PubMed] [Google Scholar]
- 25.Kimura S, Noda T, Yoshimori T. Dissection of the autophagosome maturation process by a novel reporter protein, tandem fluorescent-tagged LC3. Autophagy. 2007;3:452–460. doi: 10.4161/auto.4451. doi: 10.4161/auto.4451. [DOI] [PubMed] [Google Scholar]
- 26.Kim YC, Guan KL. mTOR: a pharmacologic target for autophagy regulation. J Clin Invest. 2015;125:25–32. doi: 10.1172/JCI73939. doi: 10.1172/JCI73939. [DOI] [PMC free article] [PubMed] [Google Scholar]
- 27.Munson MJ, Ganley IG. mTOR. PIK3C3, and autophagy: signaling the beginning from the end. Autophagy. 2015;11:2375–2376. doi: 10.1080/15548627.2015.1106668. doi: 10.1080/15548627.2015.1106668. [DOI] [PMC free article] [PubMed] [Google Scholar]
- 28.Bejarano E, Yuste A, Patel B, Stout RF, Jr, Spray DC, Cuervo AM. Connexins modulate autophagosome biogenesis. Nat Cell Biol. 2014;16:401–414. doi: 10.1038/ncb2934. doi: 10.1038/ncb2934. [DOI] [PMC free article] [PubMed] [Google Scholar]
- 29.Mundy DI, Li WP, Luby-Phelps K, Anderson RG. Caveolin targeting to late endosome/lysosomal membranes is induced by perturbations of lysosomal pH and cholesterol content. Mol Biol Cell. 2012;23:864–880. doi: 10.1091/mbc.E11-07-0598. doi: 10.1091/mbc.E11-07-0598. [DOI] [PMC free article] [PubMed] [Google Scholar]
- 30.Guixé-Muntet S, de Mesquita FC, Vila S, Hernández-Gea V, Peralta C, García-Pagán JC, Bosch J, Gracia-Sancho J. Cross-talk between autophagy and KLF2 determines endothelial cell phenotype and microvascular function in acute liver injury. J Hepatol. 2017;66:86–94. doi: 10.1016/j.jhep.2016.07.051. doi: 10.1016/j.jhep.2016.07.051. [DOI] [PubMed] [Google Scholar]
- 31.Wang J, Feng Y, Wang Y, Xiang D, Zhang X, Yuan F. Autophagy regulates Endothelial-Mesenchymal transition by decreasing the phosphorylation level of Smad3. Biochem Biophys Res Commun. 2017;487:740–747. doi: 10.1016/j.bbrc.2017.04.130. doi: 10.1016/j.bbrc.2017.04.130. [DOI] [PubMed] [Google Scholar]
- 32.Fernández-Hernando C, Yu J, Dávalos A, Prendergast J, Sessa WC. Endothelial-specific overexpression of caveolin-1 accelerates atherosclerosis in apolipoprotein E-deficient mice. Am J Pathol. 2010;177:998–1003. doi: 10.2353/ajpath.2010.091287. doi: 10.2353/ajpath.2010.091287. [DOI] [PMC free article] [PubMed] [Google Scholar]
- 33.Zhang Y, Sowers JR, Ren J. Targeting autophagy in obesity: from pathophysiology to management. Nat Rev Endocrinol. 2018;14:356–376. doi: 10.1038/s41574-018-0009-1. doi: 10.1038/s41574-018-0009-1. [DOI] [PubMed] [Google Scholar]
- 34.Zhong Z, Sanchez-Lopez E, Karin M. Autophagy, inflammation, and immunity: a troika governing cancer and its treatment. Cell. 2016;166:288–298. doi: 10.1016/j.cell.2016.05.051. doi: 10.1016/j.cell.2016.05.051. [DOI] [PMC free article] [PubMed] [Google Scholar]
- 35.Martinet W, De Meyer GR. Autophagy in atherosclerosis: a cell survival and death phenomenon with therapeutic potential. Circ Res. 2009;104:304–317. doi: 10.1161/CIRCRESAHA.108.188318. doi: 10.1161/CIRCRESAHA.108.188318. [DOI] [PubMed] [Google Scholar]
- 36.Luo Y, Lu S, Zhou P, Ai QD, Sun GB, Sun XB. Autophagy: an exposing therapeutic target in atherosclerosis. J Cardiovasc Pharmacol. 2016;67:266–274. doi: 10.1097/FJC.0000000000000342. doi: 10.1097/FJC.0000000000000342. [DOI] [PubMed] [Google Scholar]
- 37.Grootaert MO, da Costa Martins PA, Bitsch N, Pintelon I, De Meyer GR, Martinet W, Schrijvers DM. Defective autophagy in vascular smooth muscle cells accelerates senescence and promotes neointima formation and atherogenesis. Autophagy. 2015;11:2014–2032. doi: 10.1080/15548627.2015.1096485. doi: 10.1080/15548627.2015.1096485. [DOI] [PMC free article] [PubMed] [Google Scholar]
- 38.Liao X, Sluimer JC, Wang Y, Subramanian M, Brown K, Pattison JS, Robbins J, Martinez J, Tabas I. Macrophage autophagy plays a protective role in advanced atherosclerosis. Cell Metab. 2012;15:545–553. doi: 10.1016/j.cmet.2012.01.022. doi: 10.1016/j.cmet.2012.01.022. [DOI] [PMC free article] [PubMed] [Google Scholar]
- 39.Mizushima N, Yoshimori T, Ohsumi Y. The role of Atg proteins in autophagosome formation. Annu Rev Cell Dev Biol. 2011;27:107–132. doi: 10.1146/annurev-cellbio-092910-154005. doi: 10.1146/annurev-cellbio-092910-154005. [DOI] [PubMed] [Google Scholar]
- 40.Hanada T, Noda NN, Satomi Y, Ichimura Y, Fujioka Y, Takao T, Inagaki F, Ohsumi Y. The Atg12-Atg5 conjugate has a novel E3-like activity for protein lipidation in autophagy. J Biol Chem. 2007;282:37298–37302. doi: 10.1074/jbc.C700195200. doi: 10.1074/jbc.C700195200. [DOI] [PubMed] [Google Scholar]
- 41.Klionsky DJ, Abdalla FC, Abeliovich H, Abraham RT, Acevedo-Arozena A, Adeli K, Agholme L, Agnello M, Agostinis P, Aguirre-Ghiso JA, et al. Guidelines for the use and interpretation of assays for monitoring autophagy. Autophagy. 2012;8:445–544. doi: 10.4161/auto.19496. doi: 10.4161/auto.19496. [DOI] [PMC free article] [PubMed] [Google Scholar]
- 42.Chen ZH, Cao JF, Zhou JS, Liu H, Che LQ, Mizumura K, Li W, Choi AM, Shen HH. Interaction of caveolin-1 with ATG12-ATG5 system suppresses autophagy in lung epithelial cells. Am J Physiol Lung Cell Mol Physiol. 2014;306:L1016–L1025. doi: 10.1152/ajplung.00268.2013. doi: 10.1152/ajplung.00268.2013. [DOI] [PMC free article] [PubMed] [Google Scholar]
- 43.Schubert AL, Schubert W, Spray DC, Lisanti MP. Connexin family members target to lipid raft domains and interact with caveolin-1. Biochemistry. 2002;41:5754–5764. doi: 10.1021/bi0121656. doi: 10.1021/bi0121656. [DOI] [PubMed] [Google Scholar]
- 44.Langlois S, Cowan KN, Shao Q, Cowan BJ, Laird DW. Caveolin-1 and -2 interact with connexin43 and regulate gap junctional intercellular communication in keratinocytes. Mol Biol Cell. 2008;19:912–928. doi: 10.1091/mbc.E07-06-0596. doi: 10.1091/mbc.e07-06-0596. [DOI] [PMC free article] [PubMed] [Google Scholar]
- 45.Ouimet M, Franklin V, Mak E, Liao X, Tabas I, Marcel YL. Autophagy regulates cholesterol efflux from macrophage foam cells via lysosomal acid lipase. Cell Metab. 2011;13:655–667. doi: 10.1016/j.cmet.2011.03.023. doi: 10.1016/j.cmet.2011.03.023. [DOI] [PMC free article] [PubMed] [Google Scholar]
- 46.Xu K, Yang Y, Yan M, Zhan J, Fu X, Zheng X. Autophagy plays a protective role in free cholesterol overload-induced death of smooth muscle cells. J Lipid Res. 2010;51:2581–2590. doi: 10.1194/jlr.M005702. doi: 10.1194/jlr.M005702. [DOI] [PMC free article] [PubMed] [Google Scholar]
- 47.Osonoi Y, Mita T, Azuma K, Nakajima K, Masuyama A, Goto H, Nishida Y, Miyatsuka T, Fujitani Y, Koike M, et al. Defective autophagy in vascular smooth muscle cells enhances cell death and atherosclerosis. Autophagy. 2018;14:1991–2006. doi: 10.1080/15548627.2018.1501132. doi: 10.1080/15548627.2018.1501132. [DOI] [PMC free article] [PubMed] [Google Scholar]
Associated Data
This section collects any data citations, data availability statements, or supplementary materials included in this article.