

Abstract
Age-associated chronic inflammation (inflammageing) is a central hallmark of ageing1, but its influence on specific cells remains largely unknown. Fibroblasts are present in most tissues and contribute to wound healing2,3. They are also the most widely used cell type for reprogramming to induced pluripotent stem (iPS) cells, a process that has implications for regenerative medicine and rejuvenation strategies4. Here we show that fibroblast cultures from old mice secrete inflammatory cytokines and exhibit increased variability in the efficiency of iPS cell reprogramming between mice. Variability between individuals is emerging as a feature of old age5-8, but the underlying mechanisms remain unknown. To identify drivers of this variability, we performed multi-omics profiling of fibroblast cultures from young and old mice that have different reprogramming efficiencies. This approach revealed that fibroblast cultures from old mice contain ‘activated fibroblasts’ that secrete inflammatory cytokines, and that the proportion of activated fibroblasts in a culture correlates with the reprogramming efficiency of that culture. Experiments in which conditioned medium was swapped between cultures showed that extrinsic factors secreted by activated fibroblasts underlie part of the variability between mice in reprogramming efficiency, and we have identified inflammatory cytokines, including TNF, as key contributors. Notably, old mice also exhibited variability in wound healing rate in vivo. Single-cell RNA-sequencing analysis identified distinct subpopulations of fibroblasts with different cytokine expression and signalling in the wounds of old mice with slow versus fast healing rates. Hence, a shift in fibroblast composition, and the ratio of inflammatory cytokines that they secrete, may drive the variability between mice in reprogramming in vitro and influence wound healing rate in vivo. This variability may reflect distinct stochastic ageing trajectories between individuals, and could help in developing personalized strategies to improve iPS cell generation and wound healing in elderly individuals. Several studies have investigated the effect of ageing and senescence on reprogramming9-12, but a systematic evaluation of how ageing influences reprogramming is lacking. We examined the influence of old age on the inflammatory profile of fibroblasts and their ability to reprogram to iPS cells (Fig. 1a). Using cytokine profiling, we compared the systemic milieu (plasma) and conditioned medium from primary fibroblast cultures from young (3 months) and old (28–29 months) mice (Fig. 1a). Plasma from old mice showed increased levels of pro-inflammatory cytokines (for example, IL-6 and TNF), anti-inflammatory cytokines (for example, IL-4), and chemokines and growth factors (for example, CSF1 (also known as MCSF)) compared to plasma from young mice (Fig. 1b, Extended Data Fig. 1a, b and Supplementary Table 1a). Conditioned medium from primary fibroblast cultures from the ears of old mice also showed enhanced levels of pro- and anti-inflammatory cytokines (for example, IL-6 and TNF, and IL-4, respectively; (Fig. 1b, Extended Data Fig. 1c, d and Supplementary Table 1b). Similarly, inflammatory cytokines increased with age in conditioned medium from lung fibroblasts and human primary fibroblasts (Extended Data Fig. 1e, f and Supplementary Table 1c, d). Thus, primary cultures of fibroblasts from old mice exhibit a secretory inflammatory profile that overlaps in part with that of the systemic milieu (Fig. 1b and Extended Data Fig. 1h).
To systematically test the effect of age on iPS cell reprogramming, we derived independent fibroblast cultures from a total of 108 young, middle-aged and old mice. We induced reprogramming by expressing human OCT4 (also known as POU5F1), KLF4, SOX2 and MYC13, and assessed reprogramming efficiency using alkaline phosphatase (AP) and stage-specific embryonic antigen 1 (SSEA1) staining10 (Fig. 1a and Extended Data Fig. 1i-l). We did not observe a significant change in mean reprogramming efficiency with age (Fig. 1c and Extended Data Fig. 1l). However, there was increased variability between mice in reprogramming efficiency with age, with cultures from some old mice reprogramming better and some worse than cultures from young mice (Fig. 1c and Extended Data Fig. 1l). A similar age-dependent increase in variability in reprogramming efficiency was observed in chest fibroblast cultures (Extended Data Fig. 1m). Reprogramming efficiency appeared to be inherent to each culture (derived from an individual mouse), as the same culture exhibited largely consistent reprogramming efficiency to iPS cells between independent experiments or to induced neurons (Extended Data Fig. 1n, o). This increased variability in reprogramming efficiency between fibroblast cultures from different old mice could reflect distinct stochastic ageing trajectories.
Fig. 1 ∣. Primary fibroblasts from old mice secrete inflammatory cytokines and show increased variability in reprogramming efficiency between mice.

a, Experimental schematic. Young mice, 3 months old; old mice, 28–29 months old. OSKM, OCT4, SOX2, KLF4 and MYC. b, Top, age-dependent changes in cytokine levels in plasma and conditioned medium from fibroblasts or iPS cells (Extended Data Fig. 1a, g, h). ND, not detected. Bottom, cytokine profiles of conditioned medium from primary cultures (passage 3) of ear fibroblasts from young (3 months, n = 24) and old (29 months, n = 24) male mice (3 independent experiments). Box-and-whisker plots of log2-transformed fold change in mean fluorescence intensity (MFI) compared to the median of young fibroblasts. Box plots depict median and interquartile range, with whiskers indicating minimum and maximum values. **P < 0.01, ***P < 0.001; two-tailed Wilcoxon rank-sum test with Benjamini–Hochberg correction. Exact P values can be found in Supplementary Table 1b. c, Reprogramming efficiency assessed by alkaline phosphatase (AP) staining of cultures of ear fibroblasts obtained from young (3 months, n = 44), middle-aged (12 months, n = 11) and old (28–29 months, n = 53) mice (7 independent experiments). The log2-transformed fold change over the median of young mice is shown. Each dot represents a fibroblast culture from one mouse. P values, Fligner–Killeen test to assess differences in variance between age groups with Benjamini–Hochberg correction.
Variability between old individuals has been observed for several biological features5-8. However, most studies were performed in humans, in which genetic and environmental differences also have a role. We used the controlled mouse system to understand the stochastic variability in reprogramming efficiency between cultures from old mice. Using a multi-omics approach, we profiled the transcriptomes, epigenomes and metabolomes of young fibroblasts as well as old fibroblasts that reprogrammed well (good old) or poorly (bad old) (Fig. 2a and Supplementary Table 2a). Principal component analysis and unsupervised hierarchical clustering showed a separation between young and old fibroblasts across datasets (Fig. 2b and Extended Data Fig. 2a-h). Principal component analysis also revealed some separation between the transcriptomes and metabolomes of good old and bad old cultures (Fig. 2b and Extended Data Fig. 2i, j).
Fig. 2 ∣. Old fibroblast cultures exhibit a signature of an inflammatory activated state, which is associated with variability in reprogramming efficiency.

a, Multi-omics characterization of fibroblast cultures. ChIP–seq, chromatin immunoprecipitation followed by sequencing; UHPLC–MS, ultra-high performance liquid chromatography–tandem mass spectrometry. b, Principal component (PC) analysis of transcriptomes cultures of ear fibroblasts from young (3 months, n = 8) and old (29 months, n = 10) (left) or only old (right) mice (3 independent experiments). Old cultures were either good (high reprogramming efficiency) or bad (low reprogramming efficiency) (Supplementary Table 2a). c, Heat map of significantly differentially expressed genes (determined by DESeq2) between young and old fibroblasts described in b and enriched Kyoto Encyclopedia of Genes and Genomes (KEGG) pathways. Pathways are colour coded according to significance (one-sided Fisher’s exact test with Benjamini–Hochberg correction; black, false-discovery rate (FDR)-adjusted P < 0.05; grey, FDR-adjusted P < 0.15; Supplementary Table 2b, c). ECM, extracellular matrix. d, Summary of the multi-omics profiling of young and old fibroblast cultures (Extended Data Fig. 2). e, Pathway enrichment analysis of KEGG pathways associated with good or bad reprogramming efficiency. Overlapping significant (FDR-adjusted P < 0.05) KEGG pathways identified in a regression analysis from bad to good reprogramming efficiencies (n = 18) and in a separate analysis comparing the five highest and five lowest reprogramming efficiency cultures (exact P values can be found in Supplementary Table 3b, d). *P < 0.05, ***P < 0.001; two-sided nominal P value with Benjamini–Hochberg correction. f, PAGODA of single-cell RNA-seq from young (n = 30 cells), good and bad old (n = 31 cells) fibroblasts. Top heat maps, PAGODA clustering of cells. For cell PC score, maroon and blue colours indicate increased and decreased expression of the associated gene sets, respectively. Middle heat map, expression of specific cytokine genes (Extended Data Fig. 4g). Bottom heat map, single cells from good and bad old fibroblast cultures. Gene expression is shown as VST-transformed (variance stabilizing transformation, implemented in DESeq2) read counts scaled row-wise.
Old fibroblasts showed transcriptional enrichment of pathways related to secreted factors (for example, cytokine signalling), extracellular matrix, contractility, inflammation and wound healing (Fig. 2c, d, Extended Data Fig. 2k, l and Supplementary Table 2b-e). These features are characteristic of activated fibroblasts (also known as myofibroblasts), which are normally involved in tissue repair2,3,14,15. Indeed, the ‘fibroblast activation’ gene set was enriched in the old fibroblast transcriptomes (Extended Data Fig. 2m and Supplementary Table 2f). Epigenomic and metabolomics changes supported this fibroblast activation signature (Fig. 2d, Extended Data Fig. 2n-t and Supplementary Table 2g-m). The transcription factor EBF2, which shows increased expression in old fibroblasts, was identified as a potential driver of this activated fibroblast signature (Fig. 2d, Extended Data Fig. 2q, u and Supplementary Table 2n). Primary fibroblast cultures from elderly humans also exhibited increased EBF2 and cytokine-related pathway expression (Extended Data Fig. 2v, Supplementary Table2o, p). Notably, fibroblast activation was a top feature associated with good reprogramming of old fibroblasts in both transcriptomic and epigenomic datasets (Fig. 2e, Extended Data Fig. 2w and Supplementary Table 3a-f). Hence, the fibroblast activation signature is enriched in old fibroblasts and correlates with the variability between mice in reprogramming.
We wondered whether age-dependent cellular heterogeneity8,16-19 could contribute to the variability between individual mice. To determine whether fibroblast cultures are heterogeneous, we performed single-cell RNA sequencing (RNA-seq) on young, good old and bad old cultures. Although the number of single cells profiled was low, the good old culture contained a higher proportion of activated cells compared to the two bad old cultures (Fig. 2f, Extended Data Fig. 4a-g and Supplementary Table 3g). Thus, the proportion of activated fibroblasts may be linked to the variability in reprogramming between individual cultures.
We validated that old fibroblast cultures were enriched in activated cells by staining for α-smooth muscle actin (αSMA), a marker of activated fibroblasts2,3,14,15 (Extended Data Fig. 5a). These activated fibroblasts were proliferating and did not exhibit senescence markers (for example, p16Ink4a) (Extended Data Fig. 5b-e). Fluorescence-activated cell sorting (FACS) analysis of the pan-fibroblast marker PDGFRα3,14,19 as well as THY120, which correlates with the activated fibroblast signature, confirmed that old fibroblast cultures contained higher proportions of THY1+PDGFRα+ cells (Fig. 3a and Supplementary Table 4a-c). THY1+PDGFRα+ cells expressed fibroblast activation markers, inflammatory cytokines and Ebf2 (Extended Data Fig. 5f). Ebf2 knockdown in these cells reduced expression of fibroblast activation genes (for example, Acta2 (which encodes αSMA), Il6 and Ccl11 (also known as Eotaxin)), whereas Ebf2 overexpression in young fibroblasts induced expression of cytokines (for example, Il6; Extended Data Fig. 5g, h). In vivo FACS analysis also revealed a higher proportion of THY1+PDGFRα+ fibroblasts in the ears of old mice (Fig. 3b), and these fibroblasts exhibited a fibroblast activation signature with expression of inflammatory cytokines (Fig. 3b, Extended Data Fig. 5i-k and Supplementary Table 4d-g). Thus, activated fibroblasts are enriched in old cultures and old tissues in vivo.
Fig. 3 ∣. Age-associated increase in activated fibroblasts and the cytokines that they secrete drive part of the variability in reprogramming between mice.

a, Top, PAGODA clustering of single-cell RNA-seq data from young and old fibroblasts as in Fig. 2f, showing Thy1 expression. Bottom, proportion of THY1+PDGFRα+ fibroblasts in fibroblast cultures of young (3 months, n = 21) and old (29 months, n = 23) mice measured by FACS (3 independent experiments). Fold changes were calculated relative to the median of young mice. P value, two-tailed Wilcoxon rank-sum test. Each dot represents a culture from one mouse. Lines depict median. b, Left, Percentage of THY1+PDGFRα+Lin− out of all PDGFRα+Lin− fibroblasts isolated from ears of young mice (3–4 months, n = 9 replicates, each with 2–3 mice) and old mice (24–26 months, n = 10 replicates, each with 2–3 mice) analysed by FACS (3 independent experiments). P value as in a. Each dot represents a replicate, with cells pooled from 2–3 mice. Lines depict median. Right, heat map of the expression of specific cytokine genes from population RNA-seq of fibroblasts. VST-transformed read counts are shown scaled row-wise. Young sig. and old sig. indicate the average expression of genes that are significantly downregulated and upregulated with age, respectively. c, Spearman’s correlation between the proportion of THY1+PDGFRα+ (THY1+) fibroblasts in a given culture (quantified by FACS) and the reprogramming efficiency (assessed as in Fig. 1c) of that culture (ages as in a; young, n = 21; old, n = 23; 3 independent experiments). Fold changes relative to the median of young mice. P values, two-sided algorithm AS 89 in R. Each dot represents a culture from one mouse, d, Reprogramming efficiency (RE) of FACS-sorted old THY1+PDGFRα+ (THY1+) and THY1−PDGFRα+ (THY1−) fibroblasts treated daily with conditioned medium (CM) from THY1−PDGFRα+ or THY1+PDGFRα+ fibroblasts from the same original culture. log2-transformed fold change relative to THY1−PDGFRα+ fibroblasts treated with conditioned medium from THY1−PDGFRα+ fibroblasts (n = 5 old mice, 4 independent experiments). P values, two-tailed Wilcoxon signed-rank test. Each dot represents a culture from one mouse. Lines depict median, e, Reprogramming efficiency of pairs of good old and bad old fibroblast cultures treated with their own conditioned medium (self conditioned medium) or conditioned medium from the other group (swapped conditioned medium). log2-transformed fold change relative to bad old self conditioned medium. n = 8 pairs of good and old bad cultures (5 independent experiments). P values, two-tailed Wilcoxon signed-rank test with Benjamini–Hochberg correction. Each dot represents a culture from one mouse. Lines depict median. f, Reprogramming efficiency of pairs of good old and bad old fibroblast cultures treated with their own conditioned medium, which was pretreated with blocking antibodies. log2-transformed fold change in reprogramming efficiency relative to bad old conditioned medium treated with IgG antibodies. n = 6 pairs of good old and bad old cultures (4 independent experiments). P values, two-tailed Wilcoxon signed-rank test with Benjamini–Hochberg correction. Each dot represents a culture from one mouse. Lines depict median. g, Spearman’s correlation between conditioned medium and the ratio of IL-6 and TNF levels in the conditioned medium (young, n = 19; old, n = 18; ages as in a; 2 independent experiments). Fold change relative to the median of young mice. P values, two-sided algorithm AS 89 in R. Each dot represents a culture from one mouse. h, Model for the increased variability in cellular reprogramming between mice in vitro.
Notably, FACS analysis of fibroblast cultures corroborated the positive correlation between the proportion of activated (THY1+PDGFRα+) fibroblasts in a culture and the ability of this culture to reprogram (Fig. 3c and Extended Data Fig. 5l-n). Reprogramming efficiency also correlated positively with proliferation and negatively with senescence (Extended Data Fig. 5o, p). Thus, the proportion of activated fibroblasts, though not more variable with age, correlates positively with reprogramming efficiency.
We next investigated how activated fibroblasts influence reprogramming efficiency. Activated THY1+PDGFRα+ fibroblasts intrinsically reprogrammed less efficiently than their non-activated THY1−PDGFRα+ counterparts (Extended Data Fig. 5q, r). By contrast, conditioned medium from activated fibroblasts enhanced reprogramming (of both activated and non-activated fibroblasts) compared to medium from non-activated fibroblasts (Fig. 3d, Extended Data Fig. 5s-u and Supplementary Table 4h). Therefore, activated fibroblasts have opposing intrinsic and extrinsic effects on reprogramming efficiency, and the relative proportions of activated and non-activated fibroblasts in cultures from old mice could underlie the variability in reprogramming efficiency.
To analyse whether extrinsic factors drive the variability in reprogramming efficiency between individual old cultures, we examined the difference in reprogramming efficiency between good and bad old fibroblast cultures, treated with their own conditioned medium or conditioned medium that was swapped between cultures (Fig. 3e and Extended Data Fig. 6a-c). Reprogramming pairs of good and bad old cultures with swapped conditioned medium reduced the difference between their reprogramming efficiencies (Fig. 3e) by more than 60% (Extended Data Fig. 6c). Extrinsic factors thus have a substantial role in the variability in reprogramming efficiency between old cultures, and intrinsic factors are likely to underlie the remainder of the effect.
We next tested whether cytokines contribute to the role of extrinsic factors on the variability between mice. IL-6, TNF and IL-1β, which are all secreted by old fibroblast cultures, affected reprogramming in opposing directions: IL-6 enhanced reprogramming efficiency (as previously reported21), whereas TNF and IL-1β impaired reprogramming efficiency in young and old fibroblasts (Extended Data Fig. 6d-i). Consistently, blocking IL-6 with an antibody reduced reprogramming efficiency, whereas blocking TNF improved it (Extended Data Fig. 6j, k). To determine whether IL-6 and TNF contributed to the variability between mice in reprogramming efficiency, we reprogrammed pairs of good old and bad old fibroblast cultures in their own conditioned medium, which was pretreated with IL-6- or TNF-blocking antibodies. While blocking IL-6 had a minor effect, blocking TNF reduced the difference in reprogramming efficiency between pairs of good old and bad old cultures (Fig. 3f) by more than 40% (Extended Data Fig. 6l-n). The IL-6:TNF ratio correlated with reprogramming efficiency (Fig. 3g and Extended Data Fig. 6o-q). Hence, the proportions of activated and non-activated fibroblasts, and the ratio of inflammatory cytokines that they secrete (for example, IL-6 and TNF), could drive the variability between fibroblast cultures of different old mice (Fig. 3h).
Fibroblasts are critical for wound healing in vivo2,3,14,15. Although the influence of ageing on wound healing has been examined2,15,22,23, the variability of this response is not known. We assessed the rate of healing in wounds on the ears of young and old mice (Fig. 4a). While the median wound healing rate was not significantly affected by age, there was an increased variability in wound healing rate between old mice, with some old mice healing faster and some slower than young mice (Fig. 4a and Extended Data Fig. 7a-g).
Fig. 4 ∣. Wound healing rate is variable between old mice and correlates with fibroblast subpopulations with distinct cytokine signatures.

a, Ear wound healing assays in young (3–4 months, n = 26) and old (24–26 months, n = 28) mice (2 independent experiments). Left, ear wound healing curves from young mice and the five fastest- and five slowest-healing old mice. Percentage of wound area that remains on the indicated day (mean ± s.d.) Right, day of ear wound closure in young and old mice. Each dot represents one mouse. Line marks median. P values, Fligner–Killeen test to assess difference in variance between age groups. b, Single-cell RNA-seq of FACS-sorted PDGFRα+Lin− cells from the ear wounds of young mice (3–4 months, cells pooled from n = 10 mice) or old mice (24–26 months, cells pooled from n = 10 mice), 7 days after induction of wounds. Left, t-distributed stochastic neighbour embedding (t-SNE) clustering of cells (3,036 total; 1,592 young, 1,444 old) coloured by Seurat clusters or age. Right, log2-transformed fold change in the subpopulations between wounds of young and old mice. c, Single-cell RNA-seq of live cells from entire wounds of old mice (24 months) with fast-healing (n = 2) and slow-healing (n = 2) trajectories, 7 days after induction of wounds. t-SNE clustering of cells (n = 10,797 total), coloured by Seurat clusters or mouse (slow old 1, n = 3,761; slow old 2, n = 2,127; fast old 1, n = 2,533; fast old 2, n = 2,376). Bottom, log2-transformed fold change in the cell types between wounds from fast-healing compared to slow-healing old mice. d, PAGODA clustering of cells (n = 2,678 total; slow old 1, n = 1,087; slow old 2, n = 551; fast old 1, n = 441; fast old 2, n = 599) identified as fibroblasts in c. Top heat map, single cells from wounds from old mice with fast- and slow-healing trajectories. Bottom heat map, separation of cells based on principal component scores for a subset of the top significantly overdispersed gene sets. For cell PC score, maroon and blue colours indicate generally increased and decreased expression of the associated gene sets, respectively. log2-transformed and normalized gene expression values calculated by Seurat and scaled row-wise. Bottom left, log2-normalized expression values of relevant genes. Each dot represents a single cell. Line marks median. Bottom right, log2-tranformed fold change in the number of cells in each of the three fibroblast subpopulations identified by PAGODA.
To determine the overall fibroblast composition in wounds from young and old mice, we performed single-cell RNA-seq on FACS-sorted fibroblasts pooled from the wounds of 10 young or 10 old mice, 7 days after the induction of wounds–irrespective of wound healing rates (Fig. 4b and Extended Data Fig. 7c, d). Fibroblast composition changed in wounds from old mice in vivo (Fig. 4b), with subpopulations of fibroblasts exhibiting signatures of fibroblast activation and increased cytokine signalling (Extended Data Fig. 8a-f).
We next performed single-cell RNA-seq on all cells from the wounds of old mice with slow- or fast-healing trajectories (Fig. 4c and Extended Data Fig. 8g-i). Although epithelial cells were not identified (perhaps owing to the isolation protocol or wound composition and as previously reported14), fibroblasts, endothelial cells and immune cells were identified (Fig. 4c and Extended Data Fig. 8j). Notably, fibroblasts were more abundant in wounds of slow-healing old mice, whereas immune cells were more abundant in wounds of fast-healing old mice (Fig. 4c and Supplementary Table 5e). Although the number of mice is low and differences in the composition of cells could also be influenced by wound stage and isolation properties, fibroblast populations may therefore be associated with distinct wound healing trajectories.
Clustering using both Seurat and pathway and gene set overdispersion analysis (PAGODA) on wound fibroblasts from slow-healing or fast-healing old mice identified three main subpopulations (A, B and C) that were enriched in different aspects of fibroblast activation (Fig. 4d and Extended Data Fig. 9d, e; for a combined analysis of both single-cell RNA-seq datasets, see Extended Data Fig. 9h-l). Whereas fibroblast subpopulation A was present in wounds of both slow- and fast-healing mice, fibroblast subpopulation B was more abundant in wounds of fast-healing old mice and exhibited increased cytokine expression and signalling (for example, Tnf; Fig. 4d, Extended Data Fig. 9d, f, k and Supplementary Table 5f, g). Thus, TNF is associated with fast wound healing in vivo and bad reprogramming in vitro (fast wound healing might lead to fibrosis, which is detrimental). By contrast, fibroblast subpopulation C was more abundant in wounds from slow-healing old mice and exhibited higher expression of other cytokines (for example, Ccl11) and the transcription factor Ebf2 (Fig. 4d, Extended Data Fig. 9d-g, k and Supplementary Table 5f, g). Activated fibroblast subpopulations with distinct cytokine profiles (for example, TNF compared to IL-6 or CCL11) may therefore be associated with increased variability in reprogramming in vitro and wound healing trajectories in old mice.
Our study shows that ageing is associated with an increased variability between mice in cellular reprogramming in vitro and in wound healing in vivo, perhaps reflecting different ageing trajectories. Increased variability is emerging as common feature of ageing5-8, and we identify inflammatory cytokines, including TNF, as key contributing factors to variability in reprogramming efficiency (although other intrinsic and extrinsic factors may also exist). Cytokine signalling may also regulate the variability in other ageing phenotypes, including wound healing. Dermal fibroblasts have been shown to lose cellular identity and acquire adipogenic traits during ageing19, and this increased cellular heterogeneity could also contribute to the differences between individual mice. As fibroblasts exhibit tissue-specific properties, variability in distinct tissues may differentially increase with age.
A subpopulation of activated fibroblasts could be a source of chronic inflammation in old individuals and contribute to immune cell recruitment3,14,15,20. Activated fibroblasts (which proliferate) and senescent fibroblasts (which show permanent cell cycle arrest) secrete overlapping yet distinct sets of cytokines24 and may interact in a complex manner to influence reprogramming and wound healing. Wound healing is a major issue for elderly individuals, with either deficient wound healing (which can lead to ulcers) or excessive wound healing (which can lead to fibrosis)2,3,15. Changes in fibroblast subpopulations and cytokines with age could contribute to these pathologies and constitute targets for personalized strategies to restore functional wound healing in elderly individuals.
Methods
Mice
All mice used in this study were male C57BL/6 mice. Mice of different ages (3–29 months) were obtained from the National Institute on Ageing (NIA) colony, and were acclimatized to the animal facility at Stanford University for at least 1 week before being processed. No live animals were censored. For most animal experiments, young and old mice were processed in an alternate manner rather than in two large groups, to minimize group effects, and no blinding was performed. All experimental procedures were approved by Stanford’s Administrative Panel on Laboratory Animal Care and were in accordance with institutional and national guidelines. At Stanford University, all mice were housed in the Comparative Medicine Pavilion, and their care was monitored by the Veterinary Service Center at Stanford University under IACUC protocol 8661.
Collection of blood and plasma from young and old mice
To assess the systemic changes associated with age, whole blood was collected from young and old mice by cardiac puncture into a tube containing EDTA (Thermo Fisher Scientific, AM9262) (for a final concentration of 5 mM EDTA per blood sample). Blood cell composition, including white and red blood cell, granulocyte, monocyte, lymphocyte and platelet counts were analysed with a Hemavet Multispecies Hematology Analyzer (CDC Technologies) according to the manufacturer’s instructions. Plasma was prepared from whole blood samples by two consecutive centrifugation steps at 500 r.c.f. and 13,000 r.c.f., respectively, each for 10 min at room temperature, and then aliquoted and stored at −80 °C for cytokine profiling (see ‘Cytokine profiling analysis on plasma and conditioned medium using Luminex multi-analyte’).
Generation of primary cultures of fibroblasts from young and old mice
To investigate the effect of ageing on tissue fibroblasts, primary fibroblast cultures were established from the ears and lungs of young and old mice. To this end, the ears and lungs were cut into small fragments (approximately 1 mm2) and digested in Dulbecco’s modified Eagle medium (DMEM, Invitrogen, 11965-092) supplemented with 0.14 Wunsch units ml−1 of Liberase TM (Roche, 05401127001) for 30–90 min. The fragments were washed with DMEM supplemented with 15% fetal bovine serum (FBS, Gibco, 16000-044, lots 551495 and 1551824) and plated on tissue culture plates with DMEM supplemented with 15% FBS and 1% penicillin–streptomycin–glutamine (PSQ) (Gibco, 10378). To isolate primary adult fibroblasts from the chest area, the skin on the chest was dissected from the animals, the subcutaneous fat and fascia were removed, and the tissues were incubated overnight at 4 °C with the epidermal layer of the skin facing down on top of a solution of 0.25% trypsin (Gibco, 25200-056). The following day, the epidermis was removed, tissues were cut into small fragments (approximately 1 mm2) and treated with 1,000 U ml−1 collagenase I (Gibco, 17100017) in DMEM for 60–90 min at 37 °C. Digested fragments were funnelled through a 70-μm nylon mesh (Fisher Scientific, 08-771-2), washed with fibroblast growth medium (DMEM supplemented with 10% FBS and 1% PSQ) and plated using the same medium. The cells were passaged once, before being aliquoted, frozen and stored in liquid nitrogen (passage 1.5). For all experiments, unless stated, fibroblasts were thawed (passage 2) and cultured at 37 °C in 5% CO2 and 95% humidity in fibroblast growth medium. All experiments, unless specifically noted, were performed at passage 3.
FACS analysis of primary fibroblasts
To determine the purity of the primary fibroblasts from young and old mice, FACS analysis was performed on fibroblast cultures at passage 3. FACS analysis was performed using an LSR II flow cytometer (BD Biosciences) and analysed using FlowJo v.10.0.7. For FACS analysis, fibroblasts were stained with phycoerythrin-conjugated CD140a (BioLegend, 135905), in combination with the following allophycocyanin-conjugated antibodies: B220 (eBioscience, 47-0452-82), CD3 (BD Pharmingen, 557597), Gr-1 (eBioscience, 17-5931-82), F4/80 (eBioscience, 17-4801-82), Siglec H (BioLegend, 129611), CD11c (eBioscience, 17-0114-82) and propidium iodide staining solution (BD Pharmingen).
Generation of primary cultures of fibroblasts from young and old human individuals
To determine whether primary fibroblasts from humans also exhibit an inflammatory profile, we collected biopsies from humans at different ages. Stanford Human Subjects approval and informed consent was obtained before all study procedures (under protocol ID 25269, IRB 350). Biopsies were collected from male participants of different ages with four biological grandparents of Ashkenazi Jewish descent, generally healthy without thyroid disease, diabetes, immunodeficiency, ongoing cancer or autoimmune disease, and no history of poor wound healing (Supplementary Table 1g). A 4-mm punch biopsy of pre-auricular skin was obtained after injection of 1% lidocaine with epinephrine (1:1,000,000). Skin biopsies were rinsed with PBS, cut into smaller fragments (around 1 mm2) and plated into a dry 6-well tissue-culture plate. Excess PBS was removed, and fibroblast growth medium (DMEM supplemented with 10% FBS and 1% PSQ) was added. Tissues were incubated at 37 °C in 5% CO2 and 95% humidity. After 24 h, tissues were supplemented with fibroblast growth medium, and the medium was changed every 3–4 days. The cells were passaged once, before being aliquoted, frozen and stored in liquid nitrogen (passage 1.5).
Cytokine profiling analysis on plasma and conditioned medium using Luminex multi-analyte
We examined the effect of ageing on the inflammatory profiles by performing cytokine profiling on plasma and conditioned medium from fibroblast and iPS cell cultures from young and old mice. Plasma was collected as described above (Supplementary Table 1a). Conditioned medium from young and old mouse (ear and lung) and human (skin) fibroblasts was collected 48 h after plating from 150,000–200,000 primary fibroblasts (passage 3 or 33) plated in a 6-cm dish with 2 ml of fibroblast growth medium (Supplementary Table 1b-d). Conditioned medium from iPS cells (passage 23; Extended Data Fig. 1g and Supplementary Table 1e) was collected 24 h after plating from 500,000 cells maintained in serum- and feeder-free culture conditions in 2i medium (see ‘Cytokine profiling analysis on plasma and conditioned medium using Luminex multi-analyte’ for more information). Conditioned medium from cultures of THY1+PDGFRα+ and THY1−PDGFRα+ FACS-sorted young and old fibroblasts (passages 4–6, see ‘FACS and analysis of primary fibroblasts’ for FACS sorting protocol) was collected 24 h after plating from 0.5–1 million cells plated in a 15-cm dish with 20 ml of medium (Supplementary Table 4h). Conditioned medium was collected, centrifuged at 10,000 r.c.f. for 10 min at room temperature, aliquoted and stored at −80 °C. For all of these conditions, cell numbers were determined for each plate by counting on haemocytometer for normalization purposes. In addition, cell-free medium was used to assess background fluorescence. All cytokine profiling was performed by the Stanford Human Immune Monitoring Center using a Luminex mouse 38-plex or a human 62-plex analyte platform (eBiosciences/Affymetrix) that detects 38 or 62 secreted proteins, respectively.
All plasma samples were measured in technical duplicates and all conditioned medium samples were measured in single technical replicates as per recommendation of the Human Immune Monitoring Center at Stanford University. All of our analyses were performed using mean fluorescence intensity (MFI) values, because converting MFI to clinically relevant measures (such as pg ml−1) can introduce a degree of error60. We report pg ml−1 conversions in Supplementary Table 1a-e to facilitate comparison with existing literature. To compare values across plates and independent experiments, the MFI values were normalized to the median of young (3 months) within each experiment, generating fold change values. In addition, the conditioned medium levels were normalized to the cell number of the same dish. Two plasma samples from old mice were discarded, as the coefficient of variation was >20% for most of the cytokines measured between the two technical replica for these two plasma samples. Ranked fold changes in cytokine levels were calculated by multiplying the log2-transformed fold median change (old/young) with the −log10(P) values. Similarly, ranked Spearman ρ correlations were calculated by multiplying the Spearman ρ values with −log10(P) values.
Lentiviral production for reprogramming
To induce reprogramming in fibroblasts and generate iPS cells, we used the lentiviral vector 4F STEMCAA–loxP, containing a floxed version of EF1α-STEMCCA enabling the expression of human OCT4, KLF4, SOX2 and MYC. Lentiviruses were produced in human embryonic kidney 293T (HEK293T, ATCC, CRL-11268) packaging cells. The HEK293T cell line was not authenticated in-house, but mycoplasma testing was conducted at regular intervals (every 2–3 months). The day before transfection, 9 × 10⁶ HEK293T cells were plated in a 10-cm dish in HEK293T medium (DMEM supplemented with 10% FBS, 1% PSQ). The next day, the cells were transfected as follows: 100 μl of 1 mg ml−1 polyethylenimine (PEI; Polysciences, 23966-2, linear 25 kDa) was added to 2 ml of DMEM and incubated for 10 min at room temperature. The lentiviral vector of interest (20 μg) was mixed with lentiviral packaging vectors (1 μg of pHDM-tat1b (PlasmID), 1 μg of pRC-CMV-rev1b (PlasmID), 1 μg of pHDM-Hgpm2 (PlasmID)) and envelope vector (2 μg of HDM-VSV-G (PlasmID), added to the PEI–DMEM mixture and incubated for 15 min at room temperature. The PEI–DMEM–DNA mixture was then added dropwise to the HEK293T cells, and 12 h after transfection the medium was replaced with 8 ml fresh HEK293T medium. Viral supernatants were collected at 24 and 36 h after transfection, centrifuged at 3,000 r.p.m. for 15 min, and carefully transferred into a fresh tube, after which 0.7 ml of the crude virus supernatant was used to reprogram primary fibroblasts (see ‘Reprogramming of young and old fibroblasts to iPS cells and characterization of the iPS cells’).
Reprogramming of young and old fibroblasts to iPS cells and characterization of the iPS cells
We generated iPS cell lines from three independent young fibroblast cultures and from three independent old fibroblast cultures (Supplementary Table 1f). Reprogramming of primary fibroblasts was induced as follows: 100,000 primary fibroblasts at passage 3 were plated in a well of a 6-well plate, and were infected 24 and 36 h after plating with 0.7 ml crude virus supernatant mixed with 8 μg ml−1 polybrene (Sigma-Aldrich, H9268-5G). Next, 48 h after plating (12 h after the last round of infection), the infected primary fibroblasts were plated at a density of cells on a 10-cm dish containing 1.5 × 10⁶ γ-irradiated feeder cells (mouse embryonic fibroblasts (MEFs)). Cells were maintained in fibroblast growth medium for 7 days, and then switched to mouse embryonic stem (mES) cell medium, consisting of DMEM, GlutaMax (Life Technologies, 10569-010), 15% FBS, 1% PSQ, 5 × 10⁵ units of leukaemia inhibitory factor (EMD Millipore, ESG10007), 1% MEM nonessential amino acids (Gibco, 11140-050) and 0.0008% β-mercaptoethanol (Sigma-Aldrich, M-7522). On days 13–15 after infection, colonies with a distinct mES cell morphology were manually picked from 10-cm dishes and each iPS cell clone was transferred into a well of a 96-well plate (primary plate) in the presence of γ-irradiated MEFs. A minimum of 24 iPS cell clones per parental fibroblast line were picked and replicates of each 96-well primary plate were created. These replicate plates were used to evaluate the number of viral integrations in each clone, whereas the primary plates were temporarily frozen and stored at −80 °C. To determine the number of viral integrations, on-plate genomic DNA extractions were performed as previously described25, and the Mouse TaqMan Copy Number Reference Assays from Thermo Fisher was used to estimate the number of viral integrations from the genomic DNA extracted. A TaqMan probe targeting the human KLF4 gene (FAM dye labelled) was used because the 4F STEMCAA–loxP vector contains the human version of the reprogramming factors (Life Technologies, 4331182). A TaqMan probe targeting the mouse transferrin receptor gene (Tfrc), which is known to be encoded by a single gene in the mouse genome, was used as the reference (VIC dye labelled) (Life Technologies, 4458366). Only iPS cell clones with an estimated viral integration number equal to or lower than 3 were chosen for further analysis.
For 13 of these lines, we generated transgene-free iPS cell lines by excising the reprogramming factor construct and performed long-term passaging (until passage 23), as this is known to improve the pluripotency state26. To this end, primary plates were quickly thawed and the iPS cell clones were transferred into a fresh 96-well plate in the presence of γ-irradiated MEFs, and subsequently expanded. At passage 10, the integrated 4F STEMCCA lentiviral construct was excised using Cre-recombinase expressed under the CAG promoter (pCAG-Cre)13. The pCAG-Cre construct was transfected using a Mouse ES Cell Nucleofector Kit (LONZA, V4XP-3012) according to the manufacturer’s instructions. Transfected cells were then resuspended in mES cell medium, plated on feeder cells at a very low density in a 10-cm dish (500 cells per dish) and cultured in mES cell medium until colonies appeared. For each iPS cell clone, multiple subclones were isolated and expanded. The efficiency of Cre-recombinase excision was assessed by PCR using the Mouse TaqMan Copy Number Reference Assays as described above. Only transgene-free iPS cell clones were further characterized. iPS cell lines were maintained on ES cell medium for 10 passages after excision, before being adapted to serum- and feeder-free culture conditions in 2i medium according to the CReM Boston University ES cell culture protocols (http://www.bu.edu/dbin/stemcells/protocols.php). All molecular characterizations of the iPS cell lines were performed at passage 23, including the inflammatory, transcriptomic and metabolomics profiling (Extended Data Fig. 3).
To assess whether the derived iPS cell lines could give rise to cell types from all three germ layers after formation of embryoid bodies, we induced the formation of embryoid bodies. In brief, iPS cells at passage 23 were incubated with accutase (EMD Millipore) for 5 min at 37 °C to obtain a single-cell suspension and 10 ml of the iPS cell suspension at a density of 103 cells per ml was plated on ultralow attachment plates (Corning). Cells were allowed to form embryoid bodies. After 4 days, embryoid bodies were transferred into regular tissue-culture-grade plates in DMEM high glucose supplemented with 10% FBS, 100 U ml−1 penicillin and 100 μg ml−1 streptomycin (Gibco), and embryoid bodies were allowed to differentiate. At day 14 after embryoid body differentiation, differentiated cells were collected and analysed by qRT–PCR for the expression of endodermal, mesodermal and ectodermal markers (primer sequences are listed in Supplementary Table 6a).
RT–qPCR on iPS cells and differentiated cells from embryoid bodies
To assess the expression of specific genes in iPS cells and in differentiated cells from embryoid bodies, RNA purification and cDNA synthesis was performed. To this end, total RNA was isolated using the RNeasy RNA Purification Kit (QIAGEN) and 0.5–1 μg of RNA was reverse-transcribed using the High Capacity cDNA Reverse Transcription Kit (Applied Biosystems) according to the manufacturer’s instructions. cDNA was used for RT–qPCR on the BioRad iCycler using iQ SYBR Green Mix (BioRad). Hprt1 was used as housekeeping gene for normalization. All primer sequences are listed in Supplementary Table 6a.
Assessment of reprogramming efficiency
To determine the impact of ageing on iPS cell generation, reprogramming efficiency was quantified using a 96-well assay as previously described27. In brief, reprogramming was induced as described above. Then, 48 h after plating (12 h after the last round of lentiviral infection), the infected primary fibroblasts were plated at a density of 20–40 cells per well into 96-well plates containing 1,000 γ-irradiated feeder MEFs per well. In experiments using cytokines and conditioned medium, 0.1% gelatin-coated plates (Tribec Science, TBS8004) without feeder cells were used to avoid confounding factors from the feeder cells.
Infected primary fibroblasts were maintained on fibroblast growth medium until day 7 after plating and then switched to mES cell medium until day 13–15. For experiments assessing the effect of conditioned medium on reprogramming efficiency, fresh conditioned medium was collected from 10–25-cm dishes in which cells were grown in parallel, centrifuged 10,000 r.c.f. for 10 min at room temperature and added every day, starting from day 1 of replating into 96-well plates until the end of experiment. For experiments testing the influence of specific cytokines on reprogramming efficiency, fresh medium with the indicated cytokine was added every day until the switch to iPS cell medium.
To assess reprogramming efficiency, staining with AP (an early marker of pluripotency10) was performed by fixing the cells in 4% paraformaldehyde (Santa Cruz Biotechnology, sc-281692) for 15 min at room temperature, washing with citrate solution (Sigma-Aldrich, 3861) and subsequent staining with prepared diazonium salt solution (Sigma-Aldrich, 851) with napthol (Sigma-Aldrich, 855) overnight. Quantification was performed by counting the number of wells containing at least one AP+ colony. To complement AP staining, we also used staining with stage-specific embryonic antigen 1 (SSEA1) (a later marker of pluripotency10). SSEA1 staining was performed using StainAlive mouse anti-mouse antibody (Stemgent, 09-0067) according to the manufacturer’s recommendations. Quantification was performed by counting the number of wells containing at least one SSEA1+ colony using a Zeiss inverted microscope (Zeiss AxioVision A10).
Reprogramming efficiency was calculated as the number of AP+ or SSEA1+ clones, divided by the number of cells plated, and multiplied by the efficiency of viral infection (see ‘Immunofluorescence staining of reprogramming factors and pluripotency markers’). To compare reprogramming efficiencies across plates (and independent experiments), the reprogramming efficiencies of all individual cultures were normalized to the median reprogramming efficiency of young cultures within a given experiment. Statistical differences in variance in reprogramming efficiency between the age groups were calculated using the non-parametric Fligner–Killeen test using R v.3.3.0. To assess whether the increased variability in reprogramming efficiency with age was introduced by pooling multiple cohorts, we performed a permutation test in which the null distribution was estimated by randomly assigning the age groups to the observed reprogramming efficiencies for individual cultures within each cohort, and the mean difference in standard deviation between young and old cells was calculated across the cohorts. This was repeated 1,000 times, and the P value was calculated as the percentage of differences greater than or equal to the actual observed difference in standard deviation. This approach indicated that the increased variability in reprogramming efficiency with age is not simply caused by the pooling of multiple cohorts (P < 0.001).
Immunofluorescence staining of reprogramming factors and pluripotency markers
For immunofluorescence staining of pluripotency markers, cells were fixed in 4% paraformaldehyde for 15 min at room temperature, then permeabilized with 0.5% Triton X-100 for 10 min, blocked in blocking solution (2% bovine serum albumin (BSA), 5% glycerol, 0.2% Tween-20, 0.1% sodium azide in PBS) for 1 h, followed by incubation with primary antibodies. The following antibodies were used for immunofluorescence: rabbit anti-OCT3/4 (Santa Cruz Biotechnology, sc9081), SSEA1 StainAlive mouse anti-mouse antibody (Stemgent, 09-0067) and rabbit anti-SOX2 (Santa Cruz Biotechnology, sc17320). The nuclei were stained with DAPI (Life Technologies). Cells were imaged using a Zeiss inverted microscope (Zeiss AxioVision A10) with AxioVision v.4.7.2 software. For calculations of the infection efficiency, 5–10 images were randomly taken per sample and uploaded in ImageJ (v.1.46r), and the infection efficiency was calculated by dividing the number of OCT4+ cells by the total number of cells (as determined by DAPI staining).
Reprogramming of young and old fibroblasts to induced neurons
To determine the ability of young and old primary fibroblasts to reprogram to induced neurons, induced neuron reprogramming was induced as previously described28. In brief, young and old fibroblast cultures (passage 3) were plated at a density of 60,000 cells per well in a 12-well plate. The following day, the fibroblasts were infected as described above with lentiviruses carrying TetO-FUW-ASCL1 (Addgene, 27150), TetO-FUW-BRN2 (Addgene, 27151), TetO-FUW-MYT1L (Addgene, 27152) and FUW-rtTA (Addgene, 20342). The next day, doxycycline (2 μg ml−1, Sigma-Aldrich) in fibroblast growth medium was added to the wells. Medium was changed to neuronal medium (N2, B27, DMEM/F12 (Invitrogen), 1.6 ml insulin (6.25 mg ml−1, Sigma-Aldrich)) and doxycycline (2 μg ml−1) two days after the first doxycycline induction. Subsequently, neuronal medium was changed every three days. To determine the number of induced neurons at day 7 for each fibroblast culture, the cells were digested using 0.25% trypsin (Invitrogen) at 37 °C for 5 min, and all cells were subjected to magnetic activated cell sorting (MACS) to select for APC-conjugated PSA-NCAM+ cells (Miltenyi, 130-093-273), according to the manufacturer’s instructions. The number of PSA-NCAM+ cells for each fibroblast culture was counted manually using a haemocytometer. The reprogramming efficiency for each line was obtained by dividing the total number of PSA-NCAM+ cells obtained at day 7 by the number of fibroblasts plated. The ability of the primary fibroblast cultures to undergo induced neuron and iPS cell reprogramming was assessed in parallel. Note that in this comparison, infection efficiency was not assessed and hence not included in the calculation of reprogramming efficiency.
RNA-seq analysis
To profile transcriptomic changes in primary fibroblast cultures with age and after iPS cell reprogramming, total RNA was isolated from passage 3 fibroblasts and passage 23 iPS cells using the RNeasy kit (QIAGEN) according to the manufacturer’s instructions. Total RNA (150 ng) was used to prepare RNA-seq libraries using the Encore Complete RNA-seq library kit (Nugen Technology, 0333), according to the manufacturer’s instructions. Libraries were sequenced on HiSeq 2000 (2 × 10 bp paired-end reads, Illumina).
Quality and adaptor trimming of the Fastq files was performed using TrimGalore v.0.2.8, retaining reads with a minimum Phred score of 15. The trimmed reads were mapped to the mouse genome (mm9 build) using TopHat (v.2.0.8b). Reads per genes were counted using HTSeq (v.0.6.1). As annotation file, we used the genes.gtf downloaded from UCSC on 6 March 2013. Gene expression was analysed using DESeq2 (v.1.20.0). For differential expression analysis of fibroblasts, batch effect was accounted for by including a batch variable into the DESeq2 model (see Supplementary Table 2a). Genes with >0.3 fragments per kb of transcript per million mapped reads in at least one sample within a particular analysis, were considered expressed and included in the analysis. Heat maps, hierarchical clustering and principal component analysis (PCA) were performed on VST-transformed values (implemented in DESeq2). Genes were considered significantly differentially expressed if they had FDR-adjusted values of P < 0.05 and an absolute fold change >1.5, unless stated otherwise. Publicly available datasets were downloaded from the GEO database (Supplementary Table 6b) and processed as described above. Note these following RNA-seq samples were excluded from further analyses: (1) two old and three middle-aged RNA-seq libraries as they lacked any young samples, and hence batch-effects could not be corrected for; (2) RNA-seq libraries from one good old and one bad old fibroblast cultures as their reprogramming efficiency could not be confirmed across several independent experiments; (3) RNA-seq libraries from 2 iPS cell lines (out of 13 total) failed at the quality-control stage because they showed large differences (for example, in number of reads mapped) from the rest of the samples (Supplementary Table 1f).
Pathway enrichment analysis was performed using one-sided Fisher’s exact tests, testing for the overrepresentation of significantly differentially expressed genes in a given gene list. As background, all of the genes that were considered expressed (see above) were used. P values adjusted for multiple hypothesis testing using Benjamini–Hochberg correction, and FDR-adjusted P = 0.05 was set as upper threshold. In Extended Data Fig. 2m, analysis of gene set enrichment was conducted using the gene set enrichment analysis (v.2.2.2) tool. For this analysis, the VST-transformed values (derived from DESeq2) were used, and enrichment statistics were calculated using the ‘classic’ method parameter. Nominal P values were calculated based on 10,000 permutations. In Fig. 2e and Extended Data Figs. 2m, 5j, 7e, analysis of gene set enrichment was conducted by calculating the arithmetic mean of gene-wise test statistics (Wald test statistic from differential expression analysis using DESeq2) per gene set. To calculate a P value for each gene set, we constructed a null distribution of test statistics by sampling 10,000 times n genes (n indicates the number of genes in the respective gene set) and calculating the mean of the test statistics for these genes. A gene set-wise P value was then calculated as the percentage of absolute (sampled) mean test statistics that were equal or greater than the absolute (observed) mean test statistic for that pathway. P values were corrected for multiple hypothesis testing using the Benjamini–Hochberg algorithm using FDR-adjusted P = 0.05 as threshold. This method for gene set enrichment analysis has been shown to outperform many commonly used methods29. KEGG, Gene Ontology (GO) terms were acquired from http://amp.pharm.mssm.edu/Enrichr/#stats.
Upstream regulator analysis was performed using ingenuity pathway analysis (IPA; QIAGEN) software, using the genes that passed the filter in our dataset as reference genome.
Motif analysis of promoter regions (−1,000 to +50 bp relative to the transcription start sites) of differentially expressed genes was performed using the Homer software (v.4.8)30, using the genes that passed the filter in our dataset as background.
Chromatin immunoprecipitation followed by sequencing and analysis of the epigenomic landscape
To profile changes in the epigenomic landscape of primary fibroblasts with age, we performed ChIP experiments using anti-H3K4me3 (Active Motif, 39159) and anti-H3K27me3 (Active Motif, 39536) antibodies. In brief, 1-2 × 10⁶ fibroblasts were crosslinked with 1% formaldehyde for 10 min at room temperature, and formaldehyde was quenched by addition of glycine to a final concentration of 0.125 M. Chromatin was sonicated to an average size of 0.5–2 kb, using Bioruptor (Diagenode). A total of 5 μg of antibody was added to the sonicated chromatin and incubated overnight at 4 °C on a rotating platform. Subsequently, 10% of chromatin used for each ChIP reaction was retained as input DNA. Then, 100 μl of protein G Dynal magnetic beads were added to the ChIP reactions and incubated for an additional 4 h at 4 °C. Magnetic beads were washed, followed by reversal of crosslinks and DNA purification. Resultant ChIP DNA was dissolved in water. ChIP and input libraries were generated according to the Illumina protocol and sequenced as single-end 50 bp reads using the Illumina HiSeq 2000 platform.
For analysis, Fastq reads were quality-trimmed using the trim-galore software (v.0.2.1), with a Phred score threshold of 15 and a minimum remaining read length of 36 bp. Trimmed reads were mapped to the mm9 genome assembly using Bowtie v.0.12.731. Duplicate reads were eliminated using the FIXSEQ software with default parameters32. ChIP–seq peaks were called in all samples using the MACS (v.2.08) software with default settings and the --broad option33,34. Input datasets were used as baseline.
To identify H3K4me3 and H3K27me3 ChIP–seq peaks with differential intensity in young compared to old or good old compared to bad old samples, we used the DiffBind R package (v.1.12.3)35. Reads were quantified in each sample over ‘meta-peaks’, that is, peaks called using pooled reads from one specific mark (H3K4me3 reads and H3K27me3 reads) over all samples. Meta-peaks help to best determine peak boundaries36. ChIP–seq read counts normalized to input reads counts by DiffBind were then analysed using the DESeq2 package (v.1.6.3)37 to identify peaks with significantly different intensity. Hierarchical clustering and PCA were performed on VST-transformed values (implemented in DESeq2). The differential peak intensity and pathway analyses were restricted to the peaks that extended at least 100 bp into the promoter regions of the nearest genes (defined as transcriptional start site ±2,000 bp), and were performed as mentioned above (see ‘RNA-seq analysis’).
Broad H3K4me3 domains are genomic regions coated with H3K4me3 and are enriched at genes involved in cell identity and/or function38. To compare H3K4me3 breadth of samples across young and old samples, we used the approach described previously38. In brief, we used the H3K4me3 meta-peaks to compare the signal-to-noise ratio across samples. This revealed that sample number 2 for H3K4me3 from 3-month-old fibroblasts was the noisiest sample of the 5 samples. We therefore downsampled all other samples to match the coverage histogram of that specific sample. We then called peaks as described above using the calibrated files in MACS (v.2.08) and isolated the top 5% broadest H3K4me3 domains (broad H3K4me3 domains) from each peak file. We identified reproducible broad H3K4me3 domains by retaining only those that were present in all young or all old samples, and we restricted the analysis to those.
Bivalent domains are genomic regions coated with both H3K4me3 and H3K27me339,40. To identify differential bivalent regions between young and old samples, the H3K4me3 and H3K27me3 peaks that are consistently present in young samples were compared to the ones that are consistently present in old samples. To define robust bivalently marked regions in each age group, we called H3K4me3 and H3K27me3 meta-peaks separately at each age. Then, at each age and for each mark, we identified peaks that were supported by all of the individual experimental samples (that is, reproducible peaks). Bivalent peaks were obtained by the intersection of H3K4me3 and H3K27me3 reproducible peaks in all young or old samples. Note that the pathway enrichment analysis was restricted to the bivalent domains in young that lose H3K27me3 in old and to the H3K4me3 peaks in young that gain H3K27me3 in old, as these domains are likely to exhibit altered expression of their associated genes.
Together, the epigenomic profiling identifies age-dependent changes in the epigenomic landscape (for example, H3K4me3 intensity and breadth) and reveals enrichment of pathways involved in activated fibroblasts, such as cytokines, extracellular matrix components and contractility-related features (Fig. 2d, Extended Data Fig. 2n-q, x and Supplementary Table 2g-l), corroborating the transcriptomic findings.
Metabolomics analysis
To profile changes in metabolomics features in cultured fibroblasts with age, frozen cell pellets were mixed with 80% methanol (mass-spectrometry-grade) in a ratio of 10 μl per mg cell pellet (a million cells weighs roughly 13 mg). The suspension was then processed by three rounds of 1 min vortex at maximum speed, chilled briefly on ice. The mixture was incubated at 4 °C for 20 min before centrifuging at 20,000g for 20 min at 4 °C. The supernatants were used as metabolite extracts for liquid chromatography–mass spectrometry analysis. For liquid chromatography–mass spectrometry analysis, the metabolite extracts were transferred to 150 μl deactivated glass insert housed in 2-ml brown mass-spectrometry vials (Waters). A chemical standard solution (for quality control) was prepared from a synthetic complete mixture from Sigma-Aldrich (Y1501) at a concentration of 19 μg ml−1 in 80% mass-spectrometry-grade methanol (Fisher Scientific). Metabolite extracts were analysed in a platform that consisted of a Waters UPLC-coupled Exactive Orbitrap mass spectrometer (Thermo), using an OPD2 HP-4B column (4.6 mm × 50 mm) and an OPD2HP-4A guard column (Shodex). The column temperature was maintained at 45 °C. In brief, 5 μl of each sample maintained at 4 °C was loaded by the autosampler in partial loop mode 3 times in the positive mode and 3 times in the negative mode. The binary mobile phase solvents were: A, 10 mM NH4OAc in 10:90 acetonitrile:water; B, 10 mM NH4OAc in 90:10 acetonitrile:water. Both solvents were modified with 10 mM HOAc for positive-mode acquisition or 10 mM NH4OH for negative mode. The 30-min gradient for both modes was set as: flow rate, 0.1 ml min−1; 0–15 min, 99% A; 15–20.5 min, 99% to 1% A; 20.5–25 min, 1% A; 25–25.5 min, 1% to 99% A; 25.5–30 min, 99% A. The mass-spectrometry acquisition was in profile mode and performed with an electrospray ionization probe, operating with capillary temperature at 275 °C, sheath gas at 40 units, spray voltage at 3.5 kV for positive mode and 3.1 kV for negative mode, capillary voltage at 30 V, tube lens voltage at 120 V and skimmer voltage at 20 V. The mass scanning used 100,000 mass resolution, high dynamic range for AGC target, 500 ms as maximum inject time, and 75–1,200 m/z as the scan range. The system was operated by Thermo Xcalibur v.2.1 software. The raw data files generated from liquid chromatography–mass spectrometry were centroided with PAVA program41 and converted to mzXML format. Mass feature extraction was performed with XCMS v.1.30.342. Differential analysis was performed on signal intensity values derived from XCMS using the nonparametric Wilcoxon rank-sum test for positive and negative mode separately and adjusted for multiple hypothesis testing using q value correction using the R package q value (v.2.0.0). The mass features that were found significantly different were manually searched against the Metlin metabolite database (29381867) using 5 ppm mass accuracy. Retention time matching with compounds in the standard mixture was also performed for a subset of the metabolite hits. Before PCA and hierarchical clustering analysis, signal intensity values derived from XCMS were range-scaled43. Pathway analysis was performed using the integrated pathway analysis tool in the Metabo-Analyst 3.0 software44, using all putatively identified metabolites that were found significantly different (FDR-adjusted P < 0.05, absolute fold change >1.5) together with all differentially expressed genes from the transcriptomic analysis (see above).
Collectively, this metabolomics profiling uncovers changes in arginine and proline metabolism (Extended Data Fig. 2r-t and Supplementary Table 2m), which has been implicated in the regulation of inflammatory cytokines and extracellular matrix synthesis45-47 (Extended Data Fig. 2t), consistent with the characteristics of activated fibroblasts.
Single-cell RNA-seq analysis of primary cultures of fibroblasts
To assess the cell composition and heterogeneity of primary fibroblast cultures, single cells were isolated from three young and three old fibroblast cultures at passage 3 (see Supplementary Table 3g). In brief, 20 single cells per culture were isolated manually by picking isolated cells under a Zeiss inverted microscope (Zeiss AxioVision A10). Single-cell RNA-seq libraries were generated using SMARTer Ultra Low Input RNA Kit for Sequencing v.3 (Clontech, 634853), according to the manufacturer’s instructions. Single cells were directly lysed in 2.5 μl of Clontech reaction buffer and the volume was brought up to 10 μl with sterile water. First-strand cDNA synthesis was carried out in 96-well PCR plates as follows: 1 μl of 3′ SMART CDS Primer II A (24 μM) was added and the resulting mix was incubated in a preheated thermocycler at 72 °C for 3 min and then held at 4 °C. Next, 7.5 μl of first-strand master mix was added (SMARTScribe Reverse Transcriptase, 5× First-Strand Buffer, dNTP Mix and SMARTer IIA Oligonucleotides), mixed and incubated at 42 °C for 90 min and 70 °C for 10 min. Finally, the first-strand cDNA was purified with SPRI Ampure XP beads; 36 μl of the SPRI beads was added to each 20-μl single-stranded cDNA sample, mixed and incubated for 8 min at room temperature. The samples were placed on a Promega MagnaBot II magnetic separation device, the supernatant was discarded, and the single-stranded cDNA sample bound to the beads was directly used for double-stranded cDNA generation. Next, 50 μl of PCR master mix was added to each sample and mixed. Plates were placed in a preheated thermal cycler with a heated lid using the following program: 95 °C for 1 min, 18 cycles of 95 °C for 30 s, 65 °C for 30 s, 68 °C for 6 min, followed by 72 °C for 10 min and hold on 4 °C. Amplified double-stranded cDNA was purified using SPRI Ampure Beads (Beckam Coulter), eluted in 12 μl of purification buffer and kept in −20 °C. The quantity and quality of 1 μl of the amplified purified double-stranded cDNA were measured using the Agilent 2100 BioAnalyzer and Agilent’s High Sensitivity DNA Kit (Agilent, 5067-4626). Double-stranded cDNA libraries for which the BioAnalyzer results showed no contamination, a distinct peak at around bp and with approximately 2–7 ng of cDNA were selected. This resulted in 8–12 single-cell cDNA samples from each culture. To generate RNA-seq libraries, we next used Nextera XT DNA Library Preparation kit and Nextera XT Index kit (Illumina, FC-131-1096 and FC-131-1002, respectively). In brief, 5 μl purified double-stranded cDNA (around ng total) from the previous step was added into each sample well of a 96-well plate, and 10 μl Tagmentation (TD) buffer was added into each sample and mixed gently. Next, 5 μl amplicon tagmentation mix was added to the wells and mixed gently. The 96-well plate was sealed and placed in a thermal cycler and incubated at 55 °C for 5 min and held at 10 °C. The Tn5 transposase was inactivated by adding 5 μl of Neutralization buffer. The tagmented DNA was then amplified by adding 15 μl of Nextera PCR Master Mix, 5 μl index 1 primers (i7) and 5 μl index primers (i5) to each sample. The final PCR was performed using the following program on a thermal cycler: 72 °C for 3 min, 95 °C for 30 s, 12 cycles of: 95 °C for 10 s, 55 °C for 30 s, 72 °C or 30 s and 72 °C for 10 min. The PCR products were then purified with Ampure beads. The final libraries were assessed using the Agilent 2100 BioAnalyzer and Agilent’s High Sensitivity DNA Kit. We generated three pooled libraries and sequenced them on three lanes of Illumina HiSeq 2000 paired-end 2 × 101-bp sequencing reads. Quality and adaptor trimming of the Fastq files was performed using TrimGalore v.0.2.8, retaining reads with a minimum Phred score of 15. The trimmed reads were mapped to the mouse genome (mm9 build) using TopHat (v.2.0.8b). Reads per genes were counted using HTSeq (v.0.6.1). As annotation file, we used the genes.gtf downloaded from UCSC on 6 March 2013. On average, 7,000 genes were expressed per cell. Genes with at least 10 reads in 3 single cells were considered expressed. Heat maps, hierarchical clustering and PCA were performed on VST values (implemented in DESeq2).
t-SNE and PAGODA analysis of single-cell RNA-seq data from cultured cells
To analyse the single-cell RNA-seq data, we performed t-SNE clustering using the Rtsne R package (v.0.14). Single-cell RNA-seq data were analysed using PAGODA48. PAGODA identifies pathways and sets of genes that are overdispersed in the data and separates the cells based on their expression patterns. We applied PAGODA to the raw counts of all genes that were considered to be expressed48. For gene sets, we used all KEGG pathways as well as an ‘in vitro fibroblast ageing’ gene set that we defined from comparing the population RNA-seq data from young and old fibroblast cultures (Supplementary Table 2b). In addition, we used the list of ‘fibroblast activation’ genes, which are genes that have previously been associated with fibroblast activation (Supplementary Table 2f). We used the PAGODA pipeline with default parameters, unless stated otherwise, and used the SCDE package v.0.99.1 in R v.3.2.2. PAGODA revealed a relatively strong cell clustering by KEGG cell cycle as well as two de novo gene sets (clusters 37 and 119; Extended Data Fig. 4b), consisting of many cell-cycle-related genes. We accounted for this cell cycle aspect of heterogeneity using the pagoda.subtract.aspect() method (see Supplementary Table 3h for the lists of genes in these gene sets). After accounting for cell cycle phases, PAGODA identified 74 KEGG pathways, 8 de novo gene sets and the in vitro fibroblast ageing and fibroblast activation signatures as significantly overdispersed in the dataset (Extended Data Fig. 4c).
Immunofluorescence staining of fibroblast activation markers and EdU incorporation
Immunofluorescence staining was performed as described in ‘Immunofluorescence staining of reprogramming factors and pluripotency markers’. The following antibody was used for immunofluorescence: mouse anti-αSMA (Abcam, ab7817). The nuclei were stained with DAPI (Life Technologies). Cells were imaged using a Zeiss inverted microscope (Zeiss AxioVision A10) with AxioVision v.4.7.2 software.
EdU (5-ethynyl-2′-deoxyuridine) incorporation in fibroblast cultures was visualized using the Click-iT EdU Plus Alexa Fluor 594 Imaging Kit (Invitrogen, C10639). Fibroblasts were plated onto glass coverslips (Bellco Glass, 194310012A) in wells of 24-well plates at a density of 20,000 cells per well. After allowing the cells to attach overnight, fibroblasts were incubated in medium containing EdU (10 μM) for 4 h. Cells were then fixed (4% paraformaldehyde in PBS) and permeabilized (0.1% Triton X-100 in PBS). EdU was detected by click reaction according to the manufacturer’s instructions. Cells were incubated in blocking buffer (2% BSA, 5% glycerol, 0.2% Tween-20, 0.1% sodium azide in MilliQ water) and stained with Alexa Fluor 488-conjugated anti-αSMA (Abcam, ab184675). Coverslips were mounted onto slides using ProLong Gold with DAPI (Invitrogen, P36931) and imaged on a Nikon Eclipse Ti/Andor CSU-W1 spinning disk confocal microscope using Andor Zyla and NIS Elements AR software (v.4.30.02).
Senescence in young and old fibroblast cultures
We assessed senescence-associated β-galactosidase activity (SA-β-gal) in fibroblast cultures using a histochemical staining kit (Sigma-Aldrich, CS0030) according to the manufacturer’s recommendations. The nuclei were stained with DAPI (Life Technologies). For determining the proportion of senescent cells, 5–10 images were randomly taken per sample and uploaded on ImageJ (v.1.46r). Senescence rate was calculated by dividing the number of SA-β-gal+ cells with the total number of cells (DAPI stain).
FACS and analysis of primary fibroblasts
We performed FACS analysis and sorting of THY1+PDGFRα+ and THY1−PDGFRα+ cells from primary fibroblast cultures at passage 3. FACS analysis was performed on an LSR II flow cytometer (BD Biosciences), and FACS sorting was performed on a BD FACS Aria II sorter, using a 100 μm nozzle. FACS data were analysed using FlowJo v.10.0.7. Gating was determined using fluorescence-minus-one controls for each colour used in each FACS experiment to ensure that positive populations were solely associated with the antibody for that specific marker (Extended Data Fig. 10). For FACS analysis of cultured cells, fibroblasts were stained with phycoerythrin-conjugated CD140a (BioLegend, 135905) and FITC (fluorescein isothiocyanate)-conjugated CD90.2 (BioLegend, 105305).
EdU incorporation in fibroblast cultures was assessed by FACS using the Click-iT EdU Plus FACS PacBlue Kit (Invitrogen, C10636) in accordance with the manufacturer’s instructions. In brief, fibroblasts were incubated in medium containing EdU (10 μM) for 4 h. Cells were then dissociated and resuspended in FACS buffer (1% BSA in PBS). Cell surface markers were stained with phycoerythrin-conjugated CD140a (BioLegend, 135905) and FITC-conjugated CD90.2 (BioLegend, 105305). Cells were then fixed (4% paraformaldehyde in PBS) and permeabilized, followed by click reaction to detect EdU, according to the manufacturer’s instructions.
RT–qPCR on cultured fibroblasts
To assess expression of fibroblast subpopulation-specific genes, young and old fibroblast cultures at passage 3 were FACS-sorted into THY1+PDGFRα+ and THY1−PDGFRα+ fibroblasts (see above for details) and purified fibroblast subpopulations were expanded until passage 5–9. THY1+PDGFRα+ and THY1−PDGFRα+ cells were then plated at a density of 50,000 cells per well in a well of a 6-well plate. After 4 days, RNA was isolated from these fibroblast cultures and cDNA synthesis was performed as described in ‘RT–qPCR on iPS cells and differentiated cells from embryoid bodies’. Comparisons were made between pairs from the same original culture. Hprt1 was used as housekeeping gene for normalization. All primer sequences are listed in Supplementary Table 6a.
Knockdown of the transcription factor EBF2
To test the functional implication of specific transcriptional regulators, we performed shRNA knockdown experiments. FACS-purified THY1+PDGFRα+ and THY1−PDGFRα+ fibroblasts at passages 4–9 were plated at a density of 50,000 cells per well in a 6-well plate. One day after plating, cells were infected by lentiviruses expressing shRNAs. Two independent lentiviral shRNA vectors against Ebf2 were used (Sigma-Aldrich, TRCN0000081515 and TRCN0000081514). As control, a lentiviral shRNA vector against luciferase was used (Sigma-Aldrich, SHC007V). To produce lentiviruses, we followed the protocol described above (see ‘Lentiviral production for reprogramming’). Viral supernatant was collected at 24 h after transfection, centrifuged at 3,000 r.p.m. for 15 min and transferred into a fresh tube. Next, 0.7 ml of the crude virus supernatant was added to THY1+PDGFRα+ and THY1−PDGFRα+ fibroblasts. The medium was changed 24 h after infection, and the cells were maintained in fibroblast growth medium for another 48 h before RNA collection. RNA collection and purification, and RT–qPCR, were performed as described above (see ‘RT–qPCR on cultured fibroblasts’).
Overexpression of the transcription factor EBF2
Fibroblasts from young mice at passage 3 were plated at a density of 20,000 cells per well in a 12-well plate. One day after plating, cells were infected by lentiviruses expressing Ebf2 or a vector control. To produce lentiviruses (see ‘Lentiviral production for reprogramming’), the following vectors were used: 20 μg of pLenti-Ebf2-Myc-DDK (OriGene, MR224591L3) or 20 μg of pLenti-C-Myc-DDK (OriGene, PS100064), 12.6 μg of psPAX2 (Addgene 12260) and 3.7 μg of VSV-G. After 6 h of transfection, the medium was replaced by 7 ml fresh growth medium. At 24 and 48 h after transfection, viral supernatants were collected and centrifuged at 3,000 r.p.m. for 15 min and subsequently transferred into fresh tubes. Viral supernatant, collected from two 10-cm dishes of HEK293T cells at both time points, was concentrated by centrifugation at 16,500 r.p.m. for 1.5 h at 4 °C. The pellet was then resuspended in 2.5 ml fibroblast growth medium with polybrene (8 μg ml−1, MilliporeSigma, TR1003G). Next, 0.35 ml of the concentrated virus was added to each well of fibroblasts. The medium was changed 24 h after infection, and the cells were maintained in fibroblast growth medium for another 24 h before RNA collection. RNA collection and purification, and RT–qPCR, were performed as described above (see ‘RT–qPCR on cultured fibroblasts’).
Proliferation rate of young and old fibroblast cultures
Proliferation rate was assessed by plating young and old fibroblasts at a density of 50,000 cells per well of a 6-well plate in fibroblast growth medium. Every second day for up to 6 days, independent cultures were trypsinized and the number of cells in the cell suspension was counted manually using a haemocytometer. A growth slope was determined as the slope of the regression line based on the data points (cell numbers).
FACS and analysis of fibroblasts in vivo in tissues
We isolated fibroblasts from the ears of young and old mice for FACS, quantification and transcriptomic analysis. In brief, ears were dissected from animals, cut into small fragments (around 1 mm2) and digested in DMEM (Invitrogen, 11965-092) supplemented with 0.14 Wunsch units ml−1 of Liberase DL (Roche, 5401160001) for 30 min at 37°C. The fragments were washed with DMEM supplemented with 20% FBS (Gibco, 16000-044), funnelled through a 100-μm nylon mesh (Fisher Scientific, 08-771-19) and washed with fibroblast growth medium (DMEM supplemented with 10% FBS and 1% PSQ). A second filtering was performed using a 40-μm nylon mesh (Fisher Scientific, 08-771-1), followed by a washing step with fibroblast growth medium. Finally, cells were washed with FACS buffer (PBS, 1% BSA, 500 nM EDTA) and resuspended in FACS buffer to be stained for FACS analysis. FACS analysis and sorting was performed on a BD FACS Aria II sorter, using a 100-μm nozzle. FACS data were analysed using FlowJo v.10.0.7. Gating was determined using fluorescence-minus-one controls for each colour used in each FACS experiment to ensure that positive populations were solely associated with the antibody for that specific marker (Extended Data Fig. 10). For in vivo FACS analysis and sorting the following antibodies were used: CD140a (BioLegend, 135905), CD90.2 (BioLegend, 105305), TER119 (Biolegend, 116234), CD326 (Thermo Fisher Scientific, 50-163-76), CD45 (Biolegend, 103126), CD31 (Biolegend, 102422), CD202b (Thermo Fisher Scientific, 15-5987-82), brilliant violet 421 streptavidin (Biolegend, 405226) and DAPI staining solution (Thermo Fisher Scientific, 62248).
Bulk RNA-seq of THY1−PDGFRα+ and THY1+PDGFRα+ cells from the ears of young and old mice, before and after wounding
To determine whether cells could express cytokines in vivo, we profiled changes in transcriptomic features in fibroblast subpopulations in tissues from young and old mice, before and after wounding (see ‘Wounding and wound healing experiments’ for details on wounding experiments). RNA-seq was performed on freshly isolated THY1+PDGFRα+Lin− or THY1−PDGFRα+Lin− (defined as PDGFRα+CD45−CD31−EpCAM−TER119−TIE2−) (see above for isolation). Cells from 2–3 young or old mice were pooled together to obtain 500 cells of each population for each biological replicate. RNA isolation and generation of RNA-seq libraries were performed using the Clontech SmartSeq v.4 Ultra-Low Input RNA kit (Clontech). Cells were FACS-sorted directly into lysis buffer and cDNA was prepared as described by the manufacturer. Each cDNA library was analysed using a High Sensitivity chip on an Agilent 2100 Bioanalyzer. To generate sequencing libraries, 0.15 ng of each cDNA library was used as input for the Nextera XT kit, following the manufacturer’s recommendations. Cells were indexed using the Nextera XT Index kit v.2 set A, and were subsequently multiplexed and sequenced on Illumina NextSeq-500 High Output Flow Cell (400 M), using 75-bp paired-end reads.
Assessment of reprogramming efficiency of THY1+PDGFRα+ and THY1−PDGFRα+ fibroblasts
To determine the intrinsic reprogramming efficiency of THY1+PDGFRα+ and THY1−PDGFRα+ fibroblasts, cells were FACS-purified (see above) and plated at a density of 100,000 cells per well of a 6-well plate. Reprogramming was induced as described above (see ‘Reprogramming of young and old fibroblasts to iPS cells and characterization of the iPS cells’). In these experiments, 0.1% gelatin-coated plates (Tribec Science, TBS8004) without feeders were used to avoid confounding factors from the feeder cells. Fibroblasts infected with lentiviruses expressing the OSKM factors were maintained on fibroblast growth medium until day 7 after replating and then switched to ES cell medium until days 12–13. Reprogramming efficiency was assessed by AP staining as described above (see ‘Assessment of reprogramming efficiency’). This analysis revealed that activated THY1+PDGFRα+ fibroblasts intrinsically reprogram less efficiently compared to THY1−PDGFRα+ non-activated fibroblasts, and that old non-activated fibroblasts (THY1−PDGFRα+) also reprogrammed less efficiently than young THY1−PDGFRα+ fibroblasts (Extended Data Fig. 5q).
Assessment of reprogramming efficiency of fibroblasts with swapped conditioned medium
To assess the contribution of extrinsic factors for reprogramming efficiency, we performed experiments swapping conditioned medium. For the conditioned medium experiments THY1+PDGFRα+ or THY1−PDGFRα+ fibroblasts (passages 5–9), or good or bad old fibroblasts (passage 3) were plated at a density of 350–400,000 cells per 10-cm plate or at a density of 0.5–1 million cells per 15-cm plate in fibroblast growth medium. In parallel, cells were plated at a density of 100,000 cells per well of a 6-well plate to induce reprogramming as described above (see ‘Reprogramming of young and old fibroblasts to iPS cells and characterization of the iPS cells’). Starting from day 1 after infection with OSKM factors, conditioned medium was collected from 10-cm or 15-cm dishes from the indicated cultures that were growing in parallel, centrifuged at r.c.f. for 10 min at room temperature and added every day to the recipient cells by replacing the medium. From day 7 after replating onwards, ES cell medium was made using the conditioned medium from fibroblast cultures as a base. Owing to the positive effect of conditioned medium on cellular reprogramming, reprogramming efficiency was assessed earlier than in other experiments, at days 9–10 after infection. Reprogramming efficiency was assessed by AP staining as described above (see ‘Assessment of reprogramming efficiency’). For experiments using THY1+PDGFRα+ or THY1−PDGFRα+ fibroblasts, comparisons were made between pairs of THY1−PDGFRα+ and THY1+PDGFRα+ from the same original culture. For experiments using conditioned medium from THY1+PDGFRα+ or THY1−PDGFRα+ fibroblasts, conditioned medium was collected from the THY1−PDGFRα+ or THY1+PDGFRα+ fibroblasts from the same original culture, and comparisons were made between the effect of the different conditioned media on the specific populations.
Non-viral reprogramming
To test whether variation in reprogramming efficiency could be owing to lentiviral infection, we used a non-viral reprogramming protocol. Non-viral reprogramming was induced using the piggyback transposon system containing the OSKM factors49. In brief, FACS-purified THY1+PDGFRα+ or THY1−PDGFRα+ cells (passages 4–6) were plated in a well of a 6-well plate at a density of 100,000 cells per well and transfected by the piggyback transposon vector using Lipofectamine 3000 (Life Technologies, 11668027), according to the manufacturer’s instructions. Transfected fibroblasts were maintained on fibroblast growth medium until day 7, and then switched to ES cell medium until days 16–19. Reprogramming efficiency was calculated by counting the number of AP+ colonies in the well.
Effect of cytokines and blocking antibodies on reprogramming efficiency
To test how cytokines impact reprogramming efficiency, the following recombinant cytokines and blocking antibodies were purchased from R&D systems and used according to the manufacturer’s recommendations: recombinant mouse IL-6 (R&D systems, 406-ML-025), recombinant mouse IL-1β (R&D systems, 401-ML-025), recombinant mouse IL-4 (R&D systems, 404-ML-050), recombinant mouse TNF (R&D systems, 410-NT-050), recombinant mouse VEGF (R&D systems, 493-MV-025), and normal polyclonal goat IgG (R&D systems, AB-108-C), goat polyclonal mouse anti-IL-6 blocking antibody (R&D systems, AB-406-NA) and goat polyclonal mouse anti-TNF blocking antibody (R&D systems, AB-410-NA). For all experiments, the recombinant cytokines were resuspended according to the manufacturer’s instructions and used in culture medium at a final concentration of 10 ng ml−1. For the blocking antibody experiments, the blocking antibodies were pre-incubated with the corresponding cytokine or conditioned medium for 60–90 min before treatment. The blocking antibodies (or control IgG) were used at a concentration of 8 μg ml−1. For these experiments, young and old fibroblasts at passage 3 were plated at a density of 100,000 cells per well of a 6-well plate. To avoid confounding factors from the feeder cells, cells were plated on 0.1% gelatin-coated plates (Tribec Science, TBS8004). Reprogramming was induced as described above (see ‘Reprogramming of young and old fibroblasts to iPS cells and characterization of the iPS cells’). Starting from day 1 after infection with OSKM factors, cells were treated with specific cytokines or with conditioned medium together with blocking antibodies. Reprogramming efficiency was calculated by counting the number of AP+ or SSEA1+ colonies in the wells as described above (see ‘Assessment of reprogramming efficiency’). For the cytokine experiments, comparisons were made between treated and untreated cells originating from the same infected pool of cells and thus infection efficiency was not taken into account.
Western blot analyses
To test whether the cytokines used in this study induce their cognate pathways in fibroblasts, we performed western blot analyses. Young and old fibroblasts at passage 3 were plated at a density of 100,000–150,000 cells in a 6-cm dish in fibroblast growth medium. After plating for 24 h, cells were treated with the indicated cytokines or antibodies for 30 min. Cells were then lysed directly in the culture plates using ice-cold RIPA buffer (50 mM Tris-HCL pH 7.5, 150 mM NaCl, 2 mM EDTA, 1% NP-40, 0.1% SDS supplemented with 1 mM aprotinin, PMSF and PhosphoStop (Pierce)), scraped and transferred to Eppendorf tubes. Following addition of sample buffer (0.0945 M Tris-HCl pH 6.8, 9.43% glycerol, 2.36% w/v SDS and 5% β-mercaptomethanol), samples were resolved on 10% SDS–PAGE gels, transferred onto nitrocellulose membranes and blotted, according to the following protocol50, using the following antibodies: phosphorylated STAT3 (Tyr705) (Cell Signaling Technology, 9145), STAT3 (Invitrogen, 44-364G), phosphorylated STAT6 (Tyr641) (Cell Signaling Technology, 9361), STAT6 (Cell Signaling Technology, 5397), phosphorylated AKT (Ser473) (Cell Signaling Technology, 4060), AKT (Cell Signaling Technology, 4691), phosphorylated NF-κB (Ser536) (Cell Signaling Technology, 3033), NFκB (Cell Signaling Technology, 8242), phosphorylated JNK1 and JNK2 (Thr183 and Tyr185) (Invitrogen, 44-682G), JNK1 (Invitrogen, 44-690G) and β-actin (Novus Biologicals, NB600-501). Membranes were incubated with HRP-conjugated anti-mouse (Calbiochem, 401215) or anti-rabbit secondary (Calbiochem, 401393) antibodies and visualized using enhanced chemiluminescence detection reagent (Amersham ECL, GE Healthcare).
Wounding and wound healing experiments
To assess the change in the wound healing ability of mice with ageing, young (3–4 months) and old (24–26 months) C57BL/6 male mice from the NIA colony were anaesthetized in standard fashion by inhalation of 1–4% of isoflurane51. The hair on the dorsal aspect of both ears was shaved and cleaned with a 70% ethanol solution. Symmetric full-thickness skin wounds were induced on both ears by first gently pressing a 4-mm punch biopsy onto the dorsum of the ear at its cartilaginous base. Sharp scissors were then used to dissect away the wheel of skin while leaving the underlying connective tissue, cartilage and anterior skin. No dressing was applied post-operatively, and the wounds were allowed to heal without further intervention. Wound healing was assessed by imaging (using a standard iPhone 8S camera) every other day for 20 days. Wound closure was analysed by comparing the relative wound size at a given time to the original size immediately after the operation, performed as previously described51. A wound was considered closed when it was re-epithelialized for more than 95% of its original size52. The rate of individual wound healing was determined using the average of the resultant measurements from both ears per mouse. FACS analysis assessing the percentage of activated THY1+PDGFRα+Lin− cells in ears of young and old mice, before and after wounding, revealed that the fibroblasts in the wounds were predominantly activated (THY1+PDGFRα+) fibroblasts (Extended Data Fig. 7d). In line with this finding, all three populations identified in the single-cell RNA-seq analysis of all live cells in the old wounds exhibited enrichment for different aspects of the activated fibroblast state (Extended Data Fig. 9e).
Single-cell RNA-seq of fibroblasts from young versus old wounds using 10x Genomics Chromium
To evaluate changes in the fibroblast composition of wounds with age, we performed single-cell RNA-seq of all live PDGFRα+Lin− cells in the wounded area from young and old mice, 7 days after wounding. We pooled cells from 10 young (3–4 months) or 10 old (24–26 months) male C57BL/6 mice from the NIA aged colony. FACS sorting was performed as described above. Cells were sorted into chilled fibroblast growth medium. Cells were then spun down at 300g· for 5 min at 4 °C and resuspended in fibroblast growth medium at a concentration of 263 cells per μl. Young and old cells were loaded onto a 10x Genomics Chromium chip as per the manufacturer’s recommendations. Reverse transcription and library preparation was performed using the 10x Genomics Single Cell v.2 kit following the 10x Genomics protocol. One library from young mice and one library from old mice were multiplexed and sequenced on one lane of Illumina NextSeq-500 High Output Flow Cell (400 M), using 75-bp paired-end reads.
Single-cell RNA-seq of the entire wounds of fast- versus slow-healing old mice using 10x Genomics Chromium
To determine the differences in the composition of cells from old mice with different wound healing trajectories, we performed single-cell RNA-seq of all live cells in the entire wounds of two old mice with slow-healing trajectories and two old mice with fast-healing trajectories, 7 days after wounding. Mice were sedated and mice were perfused with 20 ml of PBS with heparin sodium salt (50 U ml−1) (Sigma Aldrich) to remove the blood, and ears were immediately harvested. Wounds were dissected and processed as described above. Live/dead staining was performed using 1 μg ml−1 propidium iodide (Biolegend). FACS sorting was performed on a BD FACS Aria Fusion sorter using a 100-μm nozzle. Cells were sorted into chilled fibroblast growth medium. Cells were then spun down at 300g for 5 min at 4 °C and resuspended in fibroblast growth medium at a concentration of 1,000–1,500 cells per μl. Cells were loaded onto a 10x Genomics Chromium chip as described above. Two libraries from 2 fast old mice and two libraries from 2 slow old mice were multiplexed and sequenced on one lane of Illumina Novaseq 6000 S2, using 101bp paired-end reads.
Quality control of 10x Genomics single-cell RNA-seq
For mapping, sequences obtained from sequencing using the 10x Genomics single-cell RNA-seq platform were de-multiplexed using the Cell Ranger package from 10x Genomics and mapped to the mm10 transcriptome using the Cell Ranger package (10x Genomics). Cells were removed from subsequent analysis if they were expressing fewer than 500 unique genes or expressed more than 10% mitochondrial reads. Levels of mitochondrial reads and numbers of Unique molecular identifiers were similar between the young and old mice (Extended Data Fig. 8a) and between the old mice with different wound healing capacities (Extended Data Fig. 8i), indicating that there was no systematic bias in the libraries between the conditions tested. Average gene detection in each library was also similar between the conditions tested (Extended Data Fig. 8a, i). Our study includes 13,833 total cells, with 3,036 PDGFRα+Lin− cells from wounds of pooled young and old mice (1,592 young cells and 1,444 old cells) and 10,797 cells from individual wounds from old mice with different wound healing capacities (fast old 1, 2,533 cells; fast old 2, 2,376 cells; slow old 1, 3,761 cells; slow old 2, 2,127 cells).
t-SNE analysis of single-cell RNA-seq datasets and identification of cell clusters
To analyse the single-cell RNA-seq data, we performed t-SNE clustering using the Seurat R Package (v.2.3.4) with the first 30 principal components53,54. Identification of significant clusters was performed using the FindClusters() algorithm in the Seurat package, which uses a shared nearest neighbour (SNN) modularity optimization-based clustering algorithm53,54. Marker genes for each significant cluster were found using the Seurat function FindAllMarkers(). This analysis identified two main clusters of fibroblasts between young and old wounds and seven main clusters of cells between the old mice with different wound healing trajectories (Fig. 4b, c and Extended Data Fig. 8b, j). Cell types were determined using a combination of marker genes identified from the literature, PAGODA analysis and GO for cell types using the web-based tool Enrichr (http://amp.pharm.mssm.edu/Enrichr/). We note that some known components of the skin (for example, keratinocytes and epithelial cells) were not identified in these wounds, similar to a recent single-cell RNA-seq study on dorsal skin after wounding in young animals14. This could be owing to wound composition, dissociation properties and survival during the FACS sorting protocol, as previous single-cell RNA-seq studies that identified epithelial cells in skin, have either specifically isolated epithelial cells using FACS55 or used a different isolation protocol on unwounded skin56-58.
PAGODA on single-cell RNA-seq data from wounds of young and old mice or of old mice with different wound healing trajectories
We performed PAGODA analyses using raw counts for all genes that were considered expressed for analyses of individual datasets (Fig. 4d and Extended Data Figs. 8c, 9d) and using Seurat normalized counts for the combined analysis (Extended Data Fig. 9k). We performed three separate analyses: (1) young compared to old PDGFRα+Lin− cells (Extended Data Fig. 8c); (2) cells identified as fibroblasts by Seurat from wounds of fast-compared to slow-healing old mice (Extended Data Fig. 9d); and (3) combined fibroblasts from both datasets (all PDGFRα+Lin− cells together with the cell cluster identified as fibroblasts by Seurat) (Extended Data Fig. 9k). For gene sets, we used all KEGG pathways as well as the in vitro fibroblast ageing and fibroblast activation genes sets described above (see Supplementary Table 2b, f). We used the PAGODA pipeline with default parameters, unless stated otherwise, and used the SCDE package v.1.99.1 in R v.3.3. We did not account for cell cycle in these analyses. We noted that fibroblast subpopulation B did not contain cells from old/young in the combined analysis. This is probably owing to the fact that this subpopulation of fibroblast has some markers of the haematopoietic lineage (Extended Data Fig. 9d, k), and is probably depleted of the PFGDRα+Lin− FACS-sorting technique that we used to isolate fibroblasts from the wounds of young and old mice.
Violin plots for gene expression of single cells
To visualize the expression of individual genes, cells were grouped by cell type (as determined by PAGODA). The log-transformed and normalized gene expression values as calculated by Seurat were plotted for each cell as a violin plot with an overlying dot plot in R.
Statistical analysis
For most experiments, young and old mice or samples were processed in an alternate manner rather than in two large groups, to minimize group effects. Although we did not do a bona fide power analysis, we took into account previous experiments to estimate the number of animals needed in each experiment. The exception is the wound healing experiment in Fig. 4, in which a power analysis was performed based on an initial experiment to determine the sample size required to detect a difference in variability with a 95% confidence interval. For all quantifications that were done with FACS or automated image quantification, no blinding was performed, including Fig. 3a, b and Extended Data Figs. 5b, 7d. The other experiments were blinded, with the exception of Fig. 1c and Extended Data Figs. 1l, m, 5e, 6e-h, k. Statistical analysis of the differences between age groups was performed using a unpaired two-tailed nonparametric Wilcoxon rank-sum test or a paired two-tailed or a one-tailed nonparametric Wilcoxon signed-rank test, unless otherwise stated. The statistical test applied was determined before performing the experiments. In cases in which the same recipient fibroblast culture was used in two independent experiments (Extended Data Figs. 5d, q, u, 6g), an average of the resultant measurements was determined. The nonparametric Fligner–Killeen test was used to test for differences in variance in reprogramming efficiency. P values were corrected for multiple hypothesis testing using Benjamini–Hochberg correction, unless otherwise stated, and were considered significant when P < 0.05.
Reporting summary
Further information on research design is available in the Nature Research Reporting Summary linked to this paper.
Extended Data
Extended Data Fig. 1 ∣. Primary old fibroblasts from mouse ear, mouse lungs and human skin secrete high levels of inflammatory cytokines, and the ability of individual cultures from ear fibroblasts to reprogram is stereotypical.

a, Cytokine profiling of plasma from young (3 months, n = 21) and old (29 months, n = 19) mice using Luminex multiplex cytokine assay (2 independent experiments). Box-and-whisker plot of log2-transformed fold change in MFI over median of young fibroblasts. Box plots depict the median and interquartile range, with whiskers indicating minimum and maximum values. *P < 0.05, **P < 0.01, ***P < 0.001, n.s., not significant; two-tailed Wilcoxon rank-sum test with Benjamini–Hochberg correction. Exact P values are in Supplementary Table 1a. b, Blood cell composition analysis of plasma from young (3 months, n = 9) and old (29 months, n = 9) mice using the Hemavet Multispecies Hematology Analyzer (2 independent experiments). Data are cell numbers per μl in whole-blood samples. Each dot represents cells from one mouse. Lines depict median. P values, two-tailed Wilcoxon rank-sum test with Benjamini–Hochberg correction. c, Percentage of fibroblasts (PDGFRα+) and immune cells in young (3 months, n = 8) and old (29 months, n = 8) fibroblast cultures at passage 3 (1 experiment), as determined by FACS using the indicated cell-type-specific surface markers. Data are mean ± s.e.m. Primary splenocytes from an 8-week-old mouse were used as a positive control (right). d, Comparison between cytokine profiles of plasma (red triangles) and conditioned medium from cultured ear fibroblasts at passage 3 (orange squares). Results are the mean log2-transformed concentrations (pg μl−1) of cytokines detected. For exact concentrations, see Supplementary Table 1a, b. n.d., not detected. e, Cytokine profiles of conditioned medium from primary cultures (passage 3) of lung fibroblasts from young (3 months, n = 8) and old (20–24 months, n = 9) mice (2 independent experiments). Box-and-whisker plot of log2-transformed fold change in MFI over median of young fibroblasts. *P < 0.05, **P < 0.01; two-tailed Wilcoxon rank-sum test with Benjamini–Hochberg correction. Box plots as in a. Exact P values are in Supplementary Table 1c. f, Cytokine profiles of conditioned medium from primary fibroblast cultures isolated from punch biopsy of pre-auricular skin of healthy human subjects of different ages. Results are shown as Spearman’s rank correlation coefficient (ρ) between donor age (years) and cytokine levels (MFI) in human fibroblast cultures (n = 8) at passage 3 (1 experiment). Each dot represents cells from one individual. P values, two-sided algorithm AS 89 in R. For multiple hypothesis testing, see Supplementary Table 1d. g, Cytokine profiles of conditioned medium collected from passage 23 cultures of iPS cell lines derived from young (3 months, n = 4) and old (29 months, n = 6) fibroblasts (1 experiment). Box-and-whisker plot of log2-transformed fold change in MFI over median of young iPS cells. Only cytokines that were detected at significantly different levels in young and old fibroblasts are shown (for a complete cytokine list and more details, see Supplementary Table 1e, f). Each dot represents an individual iPS cell line. P values, one-tailed Wilcoxon rank-sum test with Benjamini–Hochberg correction. Exact P values are in Supplementary Table 1e. Box plots as in a. h, Comparison of age-dependent changes in cytokine levels between plasma-incubated (described in a) and conditioned-medium-incubated mouse fibroblasts (described in Fig. 1b), their derived iPS cells (described in g) and from human fibroblasts (described in f) (Supplementary Table 1a, b, d, e) based on cytokines that are significantly different in conditioned medium from fibroblasts (Fig. 1b, bottom). Top (also presented in Fig. 1b), ranked fold change (old/young) in levels of the indicated cytokines in plasma, conditioned medium from mouse primary fibroblasts and iPS cells. Bottom, ranked Spearman ρ correlations for the indicated cytokines in conditioned medium from human primary fibroblasts (see f for individual ρ values). i,j, iPS cell lines derived from young and old mice show typical morphologies of mouse iPS cells, express similar levels of pluripotency markers and can give rise to cell types from all three germ layers upon embryoid body formation. i, Representative immunofluorescence images of iPS cell lines derived from young and old mice at passage 23, stained with the indicated antibodies (1 experiment). j, RT–qPCR on the indicated genes in embryoid bodies differentiated in vitro from iPS cell lines from young (n = 5) and old (n = 8) mice at passage 23 (1 experiment). Expression is presented as expression relative to the housekeeping gene Hprt1. Each bar represents one iPS cell line. k, Cytokine profiles of conditioned medium collected from cultures of young (n = 7) and old (n = 7) ear fibroblasts at passage 33 (1 experiment). Box-and-whisker plot of log2-transformed fold change in MFI over median of young fibroblasts. Only the cytokines that exhibited a significant difference in expression levels in conditioned medium from young and old fibroblasts at passage 3 are shown. P values, one-tailed Wilcoxon rank-sum test with Benjamini–Hochberg correction. For a complete cytokine list and exact P values, see Supplementary Table 2r. Box plots as in a. Note that the experiments in fibroblasts at passage 3 and 33 were conducted independently, and therefore statistical comparisons were restricted to within experiments. However, a direct comparison between the levels of secreted factors at passage 3 to 33 revealed that the levels of most cytokines decrease upon passaging. l, Reprogramming efficiency, assessed by SSEA1 staining, of young (n = 14) and old (n = 24) ear fibroblast cultures at passage 3 (3 independent experiments), as log2-transformed fold change over the median of young mice. Each dot represents a fibroblast culture from one mouse. P value, Fligner–Killeen test to assess differences in variance between age groups. m, Reprogramming efficiency assessed by AP staining of young (3 months, n = 7), middle-aged (12–13 months, n = 7) and old (28–30 months, n = 8) chest fibroblast cultures at passage 3 (2 independent experiments), as log2-transformed fold change over the median of young mice. Dots as in l. P values, Fligner-Killeen test to assess differences in variance between age groups with Benjamini–Hochberg correction. n, Reprogramming efficiency of fibroblast cultures are mainly stereotypical to fibroblast cultures from an individual mouse. Correlation plot depicting the reprogramming efficiency (assessed by AP staining) of fibroblast cultures reprogrammed in two experiments (separated by more than one month), with data from experiment 1 on the x axis and data from experiment 2 on the y axis. Data shown are from young (3 months, n = 14), middle-aged (12 months, n = 6) and old (29 months, n = 18) mice. Dots as in l. P values, two-sided algorithm AS 89 in R. There was a positive correlation (Spearman rank correlation, ρ = 0.63, P = 2.1 × 10⁻⁵) between reprogramming efficiencies of fibroblast cultures from the same mouse. o, Correlation plot depicting the ability of young (n = 4) and old (n = 5) fibroblast cultures at passage 3 to reprogram into neurons (iN, assessed by PSA-NCAM) or to iPS cells (iPSC, assessed by AP) (1 experiment). Dots as in l. P values, two-sided algorithm AS 89 in R. There was a significant positive correlation (Spearman rank correlation, ρ = 0.84, P = 0.003) between these two features. For individual experiments in a, b, e, l-n, see Supplementary Table 7.
Extended Data Fig. 2 ∣. Old fibroblasts exhibit distinct transcriptomic, epigenomic and metabolomics profiles compared to young fibroblasts.

a, b, PCA of H3K4me3 (a) and H3K27me3 (b) peak intensities from young ear fibroblast cultures (3 months, n = 2), old cultures that reprogram well (good old, 29 months, n = 2) and old cultures that reprogram poorly (bad old, 29 months, n = 1) (1 experiment). Principal components (PCs) 1 and 2 are shown. c, PCA of metabolomes of young (n = 8), good old (n = 4) and bad old (n = 4) ear fibroblast cultures (1 experiment). Principal components 1 and 2 are shown. d, PCA of metabolomes of young (n = 8), good old (n = 4) and bad old (n = 4) ear fibroblast cultures (1 experiment). Principal components 1 and 3 are shown. e, Unsupervised hierarchical clustering of transcriptomes (RNA-seq) of young (n = 8), good old (n=5) and bad old (n = 5) ear fibroblast cultures (3 independent experiments). Hierarchical clustering was performed using correlation-based dissimilarity (Pearson’s) as distance measure and average for linkage analysis. The y axis indicates the similarity between samples. b-e, Mice were the same ages as in a. f-h, Unsupervised hierarchical clustering of H3K4me3 (f) and H3K27me3 (g) peaks and metabolomes (h) described in a, b and c, respectively. Hierarchical clustering was performed as in e. i, PCA of transcriptomes (RNA-seq) of good and bad old ear fibroblast cultures. Principal components 1 and 2 are shown. j, PCA of metabolomes of good old (n = 4) and bad old (n = 4) ear fibroblast cultures. Principal components 2 and 3 are shown. k, Selected GO terms enriched in the old transcriptomes (young, n = 8; old, n = 10), with corresponding FDR-adjusted P values (one-sided Fisher’s exact test with Benjamini–Hochberg correction). For a complete list, see Supplementary Table 2d. l, Heat map showing expression (VST-transformed read counts, scaled row-wise) of selected cytokine genes. The scale for expression fold changes is indicated on the left. m, Gene set enrichment analysis (GSEA) plot depicting the transcriptomes of young (n = 8) and old (n = 10) fibroblasts. Top, genes associated with fibroblast activation (see Supplementary Table 2f) are enriched in the old fibroblasts (P < 1.0 × 10⁻¹⁰, two-sided nominal P value). Bottom, heat map shows expression of fibroblast activation genes (VST-transformed read counts, scaled row-wise). The scale for expression fold changes is indicated on the left. n-q, Analysis of the epigenomic data as described in a, b. In line with the transcriptomic data, age-dependent changes in epigenomic landscape also revealed enrichment of pathways involved in fibroblast activation, such as cytokines, extracellular matrix components and contractility-related features. n, Left, heat map shows the H3K4me3 peaks within promoter regions that exhibit a significant difference in intensity with age, assessed by Diffbind. Peak intensity is shown as VST-transformed read counts, scaled row-wise. The scale for peak intensity fold changes is indicated on the left. Right, selected enriched KEGG pathways colour coded according to significance (one-sided Fisher’s exact test with Benjamini–Hochberg correction; black, FDR-adjusted P < 0.05; grey, FDR-adjusted P < 0.15). For a complete list of significant KEGG terms, see Supplementary Table 2h. o, Top Venn diagram depicts the overlap of bivalent domains within promoters regions of young and old fibroblasts. For details, see ‘Chromatin immunoprecipitation followed by sequencing and analysis of the epigenomic landscape’. Middle, pie charts show how the unique bivalent domains in young fibroblasts change in old fibroblasts (left pie chart) and vice versa (right pie chart). Bottom, selected enriched KEGG pathways colour coded according to significance. For a complete list of KEGG terms, see Supplementary Table 2l. p, Top, Venn diagram depicting the overlap of broad H3K4me3 domains within promoters regions of young and old fibroblasts. For details see ‘Chromatin immunoprecipitation followed by sequencing and analysis of the epigenomic landscape’). Bottom, selected enriched KEGG pathways colour coded according to significance. For a complete list of significant KEGG terms, see Supplementary Table 2j. q, The relationship between changes in H3K4me3 peak intensity (as described in a) and gene expression for H3K4me3 peaks that are significantly different between the age groups (as described in Fig. 2b). The analysis was restricted to H3K4me3 peaks that are within promoter regions, defined as the transcriptional start site ±2 kb. The y axis denotes the log2-transformed fold change in gene expression between young and old fibroblasts for the gene, and x axis denotes the log2-transformed fold change of H3K4me3 peak intensity assigned to the gene. Genes of interest are labelled. r–t, Pathway analysis of all putatively identified metabolites that were significantly different between young and old fibroblasts (described in c), as well as the differentially expressed genes (described in Fig. 2b; FDR-adjusted P < 0.05, absolute fold change >1.5), using the MetaboAnalyst tool44. Note that the MetaboAnalyst tool does not provide multiple-hypothesis-corrected P values (one-sided Fisher’s exact test). s, Box plots showing the log2-transformed signal intensities of selected metabolites in the arginine and proline pathway from the metabolic profiling of young and old fibroblasts cultures at passage 3 (as described in c), for which the identity was confirmed using commercially available standards. Box plots depict the median and interquartile range, with whiskers indicating minimum and maximum values. *P < 0.05, **P < 0.01; two-tailed Wilcoxon rank-sum test with q value correction; l-arginine, P = 0.069; l-ornithine, P = 0.690; l-glutamate, P = 0.055; creatine, P = 0.022; creatinine, P = 0.002; putrescine, P = 0.081; spermidine P = 0.094; spermine, P = 0.016. t, Schematic representation of the biological functions of key metabolites and genes in the arginine and proline metabolic pathway, and how they relate to regulation of inflammatory cytokines and extracellular matrix synthesis45-47. Abundance of putative metabolites (oval) and gene transcripts (squares) in old fibroblasts is colour coded (red, higher in old; blue, lower in old; grey, not significantly different or not detected). Epigenomic changes are indicated with black asterisks. u, Top, top 3 motifs found in promoters of differentially expressed genes between young and old fibroblasts described in Fig. 2b, using HOMER motif analysis. Bottom, top 10 putative upstream regulators identified by the IPA database that are differentially expressed between young and old fibroblasts (FDR-adjusted P < 0.05, absolute fold change >1.5). Heat map depicts log2-transformed fold change in expression (old/young) calculated using DESeq2. The transcription factor identified across both analyses (EBF2) is in red. *P < 0.05, **P < 0.01, ***P < 0.001; cumulative hypergeometric distribution (Homer motif analysis), activation z‐score in IPA (upstream regulator analysis). For a complete list of significant motifs and upstream regulators, and exact P values, see Supplementary Table 2n. v, Top, heat map of differentially expressed genes in a regression analysis from young to old healthy human primary fibroblasts59 (n = 13, FDR-adjusted P < 0.05). Expression is shown as VST-transformed read counts, scaled row-wise. The depicted KEGG pathways are FDR-adjusted P < 0.15 (one-sided Fisher’s exact test with Benjamini–Hochberg correction) (Supplementary Table 2o, p). Bottom, VST-transformed expression of EBF2 across human samples as a function of age (years). Each square represents transcripts from a patient. NB, newborn. w, Pathway enrichment analysis of KEGG pathways associated with enhanced (up) or reduced (down) reprogramming, comparing H3K4me3 peak intensities between the top (n = 1) and the bottom (n = 1) old reprogramming cultures in our datasets (see Supplementary Table 2a). All depicted KEGG pathways were significantly enriched (FDR-adjusted P < 0.05). *P < 0.05; two-sided nominal P value with Benjamini–Hochberg correction. For a complete list of KEGG terms and exact P values, see Supplementary Table 3f.
Extended Data Fig. 3 ∣. Reprogramming erases features of inflammageing and variability between mice.

a–l, To test whether transcriptomic and metabolomics features of inflammageing could be erased by reprogramming, iPS cell lines from young and old fibroblasts at passage 23 were profiled for their transcriptome (RNA-seq) and metabolome. a, All iPS cell lines (n = 11) cluster with previously established bona fide iPS cell lines (n = 3) and ES cells (n = 4)61. Unsupervised hierarchical clustering based on overall transcriptomes of the indicated cell types. The hierarchical clustering was performed using correlation-based dissimilarity (Pearson’s) as distance measure and average for linkage analysis. The y axis indicates the similarity between samples. b, PCA of whole transcriptomes from RNA-seq data of iPS cell lines derived from young (3 months, n = 5) and old (29 months, n = 6) mice at passage 23. Principal components (PCs) 1 and 2 are shown. c, Unsupervised hierarchical clustering of transcriptomes described in b. Hierarchical clustering was performed as in a. d, Strip plot illustrating the log2-transformed fold expression changes of all genes with age for fibroblasts (left; described in Fig. 2b) and iPS cells (right; described in b). Genes detected as significantly upregulated or downregulated (DESeq2, FDR-adjusted P < 0.05, absolute fold change >1.5) with age, are shown in blue and yellow, respectively (see Supplementary Table 2q). e, PCA of metabolomes of iPS cell lines derived from young (n = 5) and old (n = 8) mice at passage 23. Ages as in b. Untargeted metabolomics profiles were generated using ultra-high performance liquid chromatography-mass spectrometry. Principal components 1 and 2 are shown. f, Unsupervised hierarchical clustering of metabolomics profiles described in e. Hierarchical clustering was performed as in a. g, Strip plot illustrating the log2-transformed fold change in signal intensity of all metabolic features with age for fibroblasts (left; described in Extended Data Fig. 2c) and iPS cells (right; described in e). Metabolic features detected as significantly up or down (using a two-tailed Wilcoxon rank-sum test with q value correction) with age are shown in blue and yellow, respectively. h, i, PCA (h) and unsupervised clustering (i) of iPS cell lines derived from young (n = 5) and old (n = 6) mice at passage 23, based on solely the genes that were significantly differentially expressed between young and old at fibroblast level. Ages as in b. Principal components 1 and 2 are shown. Hierarchical clustering was performed as in a.j–l, RT–qPCR of the indicated genes in fibroblasts cultures at passage 3 (j) and 33 (k), and iPS cell cultures at passage 23 (l). The genes shown represent the three major groups of features associated with fibroblast activation that change with age in fibroblasts. Box-and-whisker plot of log2-transformed fold change in MFI over median of young fibroblasts. Box plots depict the median and interquartile range, with whiskers indicating minimum and maximum values. Data are from young (n = 6) and old (n = 6) fibroblast cultures at passage 3, young (n = 5) and old (n = 6) fibroblast cultures at passage 33, young (n = 6) and old (n = 7) iPS cell cultures at passage 23. Ages as in b. *P < 0.05, **P < 0.01; one-tailed Wilcoxon rank-sum test with Benjamini–Hochberg correction. For j: Ccl7 (also known as Mcp3), P = 0.004; Ccl2 (also known as Mcp1), P = 0.004; Acvr2a (which encodes ACVR2α), P = 0.006; Ccl11 (also known as Eotaxin), P = 0.004; Pak6, P = 0.004; Thsb2, P = 0.004; Actn3, P = 0.006; Col1a1 (which encodes COL1α1), P = 0.004; Acta2 (which encodes αSMA), P = 0.004; Lama2, P = 0.004; Dmd, P = 0.008; F2r, P = 0.008. For k: Ccl7, P = 0.027; Ccl2, P = 0.027; Acvr2a, P = 0.027; Ccl11, P = 0.049; Pak6, P = 0.027; Thsb2, P = 0.026; Actn3, P = 0.026; Col1a1, P = 0.035; Acta2, P = 0.027; Lama2, P = 0.027; Dmd2, P = 0.027; F2r, P = 0.229. For l: Ccl7, P = 0.800; Ccl2, P = 0.800; Acvr2a, P = 0.800; Ccl11, P = 1.000; Pak6, P = 0.800; Thsb2, P = 1.000; Actn3, P = 0.800; Col1a1, P = 1.000; Acta2, P = 1.000; Lama2, P = 1.000; Dmd, P = 1.000; F2r, P = 1.000. Note that the experiments were conducted independently in fibroblasts at passage 3, 33 and iPS cells, and therefore the statistical comparisons indicated were restricted to each independent experiment. However, a comparison between the expression of secreted factors at passage 3 to 33 shows that expression of Ccl11, but not Ccl2 and Ccl7, significantly decreases upon passaging.
Extended Data Fig. 4 ∣. Correlation between the fibroblast activation signature and reprogramming efficiency in single-cell RNA-seq data.

a, Single-cell RNA-seq of young (n = 30 cells), good and bad old (n = 31 cells) fibroblast cultures. t-SNE was performed on the VST-transformed read counts of all detected genes (analysed using DESeq2). Each dot represents a single fibroblast transcriptome. b, PAGODA of single-cell RNA-seq data from young and old fibroblasts at passage 3 performed using raw expression counts and all KEGG pathways, the in vitro fibroblast ageing, the fibroblast activation and de novo gene sets. Hierarchical clustering is based on 97 significantly overdispersed gene sets and the 405 genes driving the significantly overdispersed gene sets. Top, heat map of single cells from young and old fibroblast cultures. Middle, heat map of the separation of cells based on their principal component scores for the significantly overdispersed gene sets. Top heat map, PAGODA clustering of cells. Maroon and blue colours indicate increased and decreased expression of the associated gene sets, respectively. c, PAGODA as described in Extended Data Fig. 4c. Top, heat map of single cells from young and old fibroblast cultures. Middle, heat map of separation of cells based on their principal component scores for the significantly overdispersed gene sets. Top heat map, PAGODA clustering of cells. Maroon and blue colours indicate increased and decreased expression of the associated gene sets, respectively. d, PAGODA as described in c. Middle, heat map of separation of cells based on their principal component scores for the in vitro fibroblast ageing signature. Bottom, heat map of the expression of the genes that are part of the in vitro fibroblast ageing signature, and decrease with age; expression is shown as VST-transformed read counts, scaled row-wise. The scale for expression fold changes is indicated on the right. The bottom heat map indicates the cells that originate from good and bad old cultures. e, PAGODA as described in c. Middle, heat map of separation of cells based on their principal component scores for the in vitro fibroblast ageing signature. Bottom, heat map of expression of the genes that are part of the in vitro fibroblast ageing signature, and increase with age; expression is shown as VST-transformed read counts, scaled row-wise. The scale for expression fold changes is indicated on the right. The bottom heat map indicates the cells that originate from good and bad old cultures. f, PAGODA as described in c. Middle, heat map of the separation of cells based on their principal component scores for the fibroblast activation signature. Bottom, heat map of the expression of the genes that are part of the fibroblast activation gene set; expression is shown as VST-transformed read counts, scaled row-wise. The scale for expression fold changes is indicated on the right. The bottom heat map indicates the cells that originate from good and bad old cultures. g, PAGODA as described in c. Middle, heat map of the separation of cells based on their principal component scores for the KEGG cytokine–cytokine receptor interaction gene set. The heat map shows expression of the top 30 overdispersed genes in the KEGG cytokine–cytokine receptor interaction pathway; expression is shown as VST-transformed read counts, scaled row-wise. The scale for expression fold changes is indicated on the right. The bottom heat map indicates the cells that originate from good and bad old cultures.
Extended Data Fig. 5 ∣. Old fibroblast cultures are enriched for activated (THY1+PDGFRα+) fibroblasts, which are intrinsically poor at reprogramming but facilitate reprogramming extrinsically via secretion of cytokines.

a, Left, representative immunofluorescence images of young and old fibroblasts at passage 3 stained for αSMA (which is encoded by the Acta2 gene). Right, quantification of the percentage of αSMA+ cells in young (3 months, n = 8) and old (29 months, n = 8) fibroblasts at passage 3 (1 experiment). Based on reprogramming efficiency, old cultures are shown as good old, bad old or old. Each dot represents cells from one mouse. Lines depict median. P value, two-tailed Wilcoxon rank-sum test. b, Left, representative immunofluorescence images of young and old fibroblasts at passage 3 incubated with EdU for 4 h, then stained for αSMA (red), EdU (green) and DAPI (blue). White arrows indicate an EdU-positive activated and a non-activated cell. Right, FACS quantification of the percentage of EdU-positive THY1−PDGFRα+ (THY1−) and THY1+PDGFRα+ (THY1+) cells in young (3 months, n = 5; 3 independent experiments) and old (29 months, n = 5; 1 experiment) cultures at passage 3. Dots and lines as in a. P values, two-tailed Wilcoxon rank-sum test. c, PAGODA of single-cell RNA-seq from young and old fibroblasts described in Extended Data Fig. 4c. Top heat map, PAGODA clustering of cells. Maroon and blue colours indicate increased and decreased expression of the associated gene sets, respectively. Middle heat map, expression of genes in the GO cellular senescence gene set, for which expression is shown as VST-transformed read counts, scaled row-wise. Bottom heat map, cells that originate from good and bad old cultures. The scale for expression fold changes is indicated on the right. d, RT–qPCR of p16Ink4a expression in cultures of THY1−PDGFRα+ (THY1−) and THY1+PDGFRα+ (THY1+) young and old cells at passages 4–6. Results are shown as fold change in expression over THY1−PDGFRα+ cells. Data are from young (3 months, n = 5) and old (29 months, n = 5) cultures (6 independent experiments). One young and three old cultures were used in 2–3 independent experiments. In this case, an average of the measurements was determined. Dots and lines as in a. P values, two-tailed Wilcoxon signed-rank test. e, Percentage of SA-β-galactosidase-positive cells in young (3 months, n = 11) and old (28–29 months, n = 22) fibroblast cultures at passage 3 (3 independent experiments). log2-transformed fold change in SA-β-galactosidase-positive cells over median of young fibroblasts. Line indicates median. P values, two-tailed Wilcoxon ranked sum test. f, g, RT–qPCR of old THY1−PDGFRα+ (THY1−) and THY1+PDGFRα+ (THY1+) cells at passage 4–6 (3 independent experiments) untreated (f) (n = 6, 3 independent experiments) or treated with the indicated shRNA constructs for 72h (g) (n = 5, 4 independent experiments). Box-and-whisker plot of fold change in expression over THY1−PDGFRα+ populations originating from the same culture (f) or over shLuciferase (shLuc) treated cells (g). Box plots depict the median and interquartile range, with whiskers indicating minimum and maximum values. *P < 0.06, one-tailed Wilcoxon signed-rank test with Benjamini–Hochberg correction. h, RT–qPCR on young (3 months, n = 5) fibroblasts after overexpression of Ebf2 for 48 h (2 independent experiments). Box-and-whisker plot of fold change in expression over cells treated with empty vector. Box plots as in f. *P < 0.06, one-tailed Wilcoxon signed-rank test with Benjamini–Hochberg correction. i, Heat map of significantly differentially expressed genes (determined by DESeq2) between freshly FACS-sorted THY1−PDGFRα+Lin− (THY1−) and THY1+PDGFRα+Lin− (THY1+) cells described in Fig. 3b and enriched KEGG pathways. Expression is shown as VST-transformed read counts, scaled row-wise. The scale for expression fold changes is indicated on the left. All depicted KEGG pathways were significantly enriched (one-sided Fisher’s exact test with Benjamini–Hochberg correction, FDR-adjusted P < 0.05). For a complete list of KEGG terms, see Supplementary Table 4e. j, Pathway enrichment analysis of KEGG pathways associated with ageing in dataset described in Fig. 3b. For a complete list of KEGG terms, see Supplementary Table 4g. **P = 0.01, ***P = 0.001; two-sided nominal P value with Benjamini–Hochberg correction. k, Top, ranked fold change (old/young) in levels of the indicated cytokines in plasma (see Extended Data Fig. 1a). Bottom, ranked fold change (old/young) in expression for the indicated cytokines in freshly FACS-sorted THY1−PDGFRα+Lin− (THY1−) and THY1+PDGFRα+Lin− (THY1+) cells from young and old ears. See ‘Cytokine profiling analysis on plasma and conditioned medium using Luminex multi-analyte’ for calculation of ranked fold changes. Gene expression related to wounded fibroblasts is from datasets described in Extended Data Fig. 7e-g. l–n, Correlation between the proportion of THY1+PDGFRα+ (THY1+) fibroblasts in old cultures (29 months, n = 23) (l), young (3 months, n = 21) and bad old (29 months, n = 6) cultures (m), and young (3 months, n = 21) and good old (29 months, n = 6) cultures (n), and the reprogramming efficiency of the culture (3 independent experiments). Dots as in a. P values, two-sided algorithm AS 89 in R. The y axis denotes the fold change in the proportion of THY1+PDGFRα+ fibroblasts relative to the median of young mice, and x axis denotes the fold change in reprogramming efficiency of the culture relative to the median of young mice. o, p, Correlation between the proliferation rate (o) or the percentage of SA-β-galactosidase-positive cells (p) of a given fibroblast culture and reprogramming efficiency of the culture. Proliferation rate was determined by calculating the growth slope of young (3 months, n = 15), middle-aged (12 months, n = 10) and old (28–29 months, n = 27) ear fibroblast cultures at passage 3 (4 independent experiments). Senescence was assessed by SA-β-galactosidase staining of young (3 months, n = 11), middle-aged (12 months, n = 11) and old (28–29 months, n = 22) ear fibroblast cultures at passage 3 (3 independent experiments). Dots as in a. P values, two-sided algorithm AS 89 in R. The y axis denotes the fold change in the proliferation rate or percentage of SA-β-galactosidase-positive cells relative to the median of young mice, and x axis denotes the fold change in reprogramming efficiency of the culture relative to the median of young mice. q, Reprogramming efficiency of FACS-sorted young (3 months, n = 8) and old (29 months, n = 7) THY1−PDGFRα+ (THY1−) and THY1+PDGFRα+ (THY1+) fibroblasts at passages 4–6, assessed using AP staining (3 independent experiments). log2-transformed fold change in reprogramming efficiency of the cells relative to the median of young THY1−PDGFRα+ fibroblasts. One old culture was used in two independent experiments. In this case, an average of the measurements was determined. Dots and lines as in a. P values, two-tailed Wilcoxon signed-rank test. r, Reprogramming efficiency of FACS-sorted young (3 months, n = 5) THY1−PDGFRα+ (THY1−) and THY1+PDGFRα+ (THY1+) fibroblasts at passages 4–6, assessed as in q (3 independent experiments). Reprogramming was induced using a non-lentiviral piggyBac transposon system. Results are shown as number of AP+ colonies. Dots and lines as in a. P values, one-tailed Wilcoxon rank-sum test. s, t, Cytokine profiles of conditioned medium collected from cultures of old (s) (29 months, n = 6, 3 independent experiments) and young (t) (3 months, n = 6, 2 independent experiments) THY1−PDGFRα+ (THY1−) and THY1+PDGFRα+ (THY1+) fibroblasts at passages 4–6. Comparisons were made between THY1−PDGFRα+ and THY1+PDGFRα+ from the same original culture. Based on cytokines that are significantly different in conditioned medium from fibroblasts (Fig. 1b). Box-and-whisker plot of log2-transformed fold change in mean fluorescence intensity (MFI) over THY1−PDGFRα+ fibroblasts. Box plots as in f. *P < 0.05, one-tailed Wilcoxon rank-sum test with Benjamini–Hochberg correction. Exact P values are in Supplementary Table 4h. u, Reprogramming efficiency, assessed as in q, of FACS-sorted young (3 months, n = 6) THY1−PDGFRα+ (THY1−) and THY1+PDGFRα+ (THY1+) fibroblasts at passages 4–6 treated with fresh conditioned medium daily starting from day 1 after infection (3 independent experiments). Conditioned medium was collected daily from the THY1−PDGFRα+ or THY1+PDGFRα+ fibroblasts from the same original culture. log2-transformed fold change in reprogramming efficiency relative to the reprogramming efficiency of THY1−PDGFRα+ fibroblasts treated with conditioned medium from THY1−PDGFRα+ fibroblasts. One young culture was used in two independent experiments. In this case, an average of the measurements was determined. Dots and lines as in a. P values, two-tailed Wilcoxon signed-rank test. For individual experiments in b, d–h, l_u and exact P values, see Supplementary Table 7.
Extended Data Fig. 6 ∣. Old fibroblasts secrete cytokines, including IL-6 and TNF, that induce inflammatory signalling pathways and modulate reprogramming efficiency.

a, Reprogramming efficiency, assessed using AP staining, of FACS-sorted young (3 months, n = 8) fibroblast cultures at passage 3 that were treated with conditioned medium from day 1 after infection (4 independent experiments). Conditioned medium was collected from young, good old or bad old fibroblast cultures. Results are shown as fold change in reprogramming efficiency relative to young fibroblasts treated with young conditioned medium. Each dot represents cells from one mouse. Lines depict median. P values, two-tailed Wilcoxon signed-rank test with Benjamini–Hochberg correction. b, Reprogramming efficiency, assessed as in a, of bad old (left, n = 7) or good old (right, n = 6) fibroblast cultures at passage 3 treated with conditioned medium from day 1 after infection (5 independent experiments). Conditioned medium was collected from good or bad old fibroblast cultures. Results are shown as fold change in reprogramming efficiency over old fibroblasts treated with bad old conditioned medium. Dots and lines as in a. P values, two-tailed Wilcoxon signed-rank test. c, Different representation of the data from Fig. 3e; each diamond represents the fold difference in reprogramming efficiency between a unique pair of good and bad old cultures (n = 8 pairs of good and bad old cultures, 5 independent experiments). Dots and lines as in a. P values, two-tailed Wilcoxon signed-rank test with Benjamini–Hochberg correction. d, Western blot analysis of young fibroblasts at passage 3 treated with the indicated cytokines at the concentration of 10 ng ml−1 for 30 min. Representative of 3 independent experiments. e, Reprogramming efficiency, assessed as in a, of young fibroblast cultures (3 months, n = 10) at passage 3 (3 independent experiments). Cells were treated with the indicated cytokines from day 1 after infection at the concentration of 10 ng ml−1. Results are shown as log2-transformed fold change in reprogramming efficiency over untreated cells. Dots and lines as in a. P values, two-tailed Wilcoxon signed-rank test with Benjamini–Hochberg correction. f, Reprogramming efficiency, assessed by SSEA1 staining, of young fibroblast cultures (3 months, n = 4) at passage 3 treated with the indicated cytokines from day 1 after infection at the concentration of 10 ng ml−1 (2 independent experiments). Results are shown as log2-transformed fold change in reprogramming efficiency over untreated cells. Dots and lines as in a. P values, one-tailed Wilcoxon signed-rank test with Benjamini–Hochberg correction. g, Reprogramming efficiency, assessed as in a, of old fibroblast cultures (29 months, n = 7) at passage 3 treated with the indicated cytokines from day 1 after infection at the concentration of 10 ng ml−1 (3 independent experiments). Results are shown as log2-transformed fold change in the reprogramming efficiency over untreated cells. Note that 1 old culture was used in 2 independent experiments. In this case, an average of the resultant measurements was determined. Dots and lines as in a. P values, two-tailed Wilcoxon signed-rank test with Benjamini–Hochberg correction. h, Reprogramming efficiency, assessed as in f, of old fibroblast cultures (29 months, n = 3) at passage 3 treated with the indicated cytokines from day 1 after infection at the concentration of 10 ng ml−1 (2 independent experiments). Results are shown as log2-transformed fold change in the reprogramming efficiency over untreated cells. Dots and lines as in a. P values, one-tailed Wilcoxon signed-rank test with Benjamini–Hochberg correction. i, Western blot analysis using the indicated antibodies of young fibroblasts at passage 3 treated with the indicated cytokines (10 ng ml−1) and blocking antibodies (8 μg ml−1) for 30 min. Cytokines were pretreated with either IgG or their corresponding blocking antibodies for 1 h before treatment. Representative of 2 independent experiments. j, Western blot analysis of old fibroblasts at passage 3 treated with the indicated cytokines at a concentration of 10 ng ml−1 for 30 min. k, Reprogramming efficiency, assessed as in a, of young fibroblast cultures (3 months, n = 4) at passage 3 treated with the indicated conditions from day 1 after infection (2 independent experiments). Cytokines (10 ng ml−1) were pretreated with either IgG or their corresponding blocking antibody (8 μg ml−1) for 1 h before treatment. Results are shown as log2-transformed fold change in reprogramming efficiency over untreated cells. Dots and lines as in a. P values, one-tailed Wilcoxon signed-rank test with Benjamini–Hochberg correction. l, m, Reprogramming efficiency, assessed as in a, of young fibroblast cultures (3 months, n = 6) at passage 3 treated with the indicated conditions from day 1 after infection (3 independent experiments). Conditioned medium was pretreated for 1 h with the indicated blocking antibody before administration. Results are shown as log2-transformed fold change relative to conditioned medium treated with IgG. Dots and lines as in a. P values, one-tailed Wilcoxon signed-rank test with Benjamini–Hochberg correction. n, Different representation of the data from Fig. 3f; each diamond represents the fold difference in reprogramming efficiency between a unique pair of good and bad old cultures (n = 6 pairs of good and bad old cultures, 4 independent experiments). Line marks median. P values, two-tailed Wilcoxon signed-rank test with Benjamini–Hochberg correction. o, Heat map showing the Spearman rank correlation coefficients between the levels of individual cytokines (top row), the ratio of the levels of TNF to other cytokines (middle row), the ratio of the levels of IL-6 to other cytokines (bottom row), and reprogramming efficiency in young (3 months, n = 19) and old (29 months, n = 18) cells (2 independent experiments). *P < 0.05, **P < 0.01; two-sided algorithm AS 89 in R; TNF:IL-6, P = 0.040; IL-6:IFNγ, P = 0.010; IL-6:IL-18, P = 0.040; IL-6:TNF, P = 0.040; IL-6:IL-10, P = 0.040; IL-6:CSF2, P = 0.005. The remaining P values can be found in Supplementary Table 7. p, q, The levels of IL-6 (p) or TNF (q) are not correlated with reprogramming efficiency. The y axis denotes the fold change in the levels of the indicated cytokine relative to the median of young mice and the x axis denotes the fold change in reprogramming efficiency of the culture relative to the median of young mice. Data are from young (3 months, n = 19) and old (29 months, n = 18) mice (2 independent experiments). P values, two-sided algorithm AS 89 in R. For individual experiments in a–c, e–h, k–q, see Supplementary Table 7.
Extended Data Fig. 7 ∣. Ageing is associated with an increased variability in wound healing between old mice, and old fibroblasts in wounds are distinct from primary fibroblasts derived from healthy ear skin.

a, Example images of ear wounds of young mice, fast-healing old mice (fast old) and slow-healing old mice (slow old) at the indicated time points (2 independent experiments). Ink circles depict initial size of wounds. b, Ear wound healing curve from young (3–4 months, n = 26) and old (24–26 months, n = 28) mice (2 independent experiments). Full thickness wounds were induced on the dorsal side of both ears (see ‘Wounding and wound healing experiments’ for details) and the size of the wounds was assessed by imaging ear wounds every second day for 20 days. For each mouse, the average of both ear wounds was calculated. Graph depicts the average percentage of wound area remaining at the indicated time points. Data are mean ± s.e.m. c, Ear wound healing curves of the five fastest and the five slowest healing young and old mice. Graph depicts the average average of wound area remaining at the indicated time points. Data are mean ± s.e.m. d, FACS analysis as described in Fig. 3b to assess the percentage of THY1+PDGFRα+Lin− (THY1+) cells in ears of young and old mice during basal conditions and at 7 days after induction of wounds. Results are shown as a percentage of THY1+PDGFRα+Lin− cells over PDGFRα+Lin− cells. Data shown are from young basal (3–4 months, n = 9 replicates, each with 2–3 mice), young wounded (3–4 months, n = 8 replicates, each with 2–3 mice), old basal (24–26 months, n = 10 replicates, each with 2–3 mice) and old wounded (24–26 months, n = 8 replicates, each with 2–3 mice) (3 independent experiments). Each dot represents a replicate with cells pooled from 2–3 mice. Line depicts median percentage. P values, two-tailed Wilcoxon rank-sum test. Note that the percentage of THY1+PDGFRα+Lin− in young and old basal conditions is also presented in Fig. 3b. e, Pathway enrichment analysis based on population RNA-seq of young wounded (3–4 months, n = 6 replicates, each with 2–3 mice) and old wounded (24–26 months, n = 6 replicates, each with 2–3 mice) THY1−PDGFRα+Lin− and THY1+PDGFRα+Lin− cells in vivo (1 experiment). The graph shows a subset of KEGG pathways that were found to be significantly enriched (FDR-adjusted P < 0.05). For a complete list of differentially expressed genes and pathways, with corresponding specific P values, see Supplementary Table 5c, d. **P < 0.01, ***P < 0.001; two-sided nominal P value with Benjamini–Hochberg correction. f, Comparison between the transcriptomic changes that occur in fibroblasts with age in vitro (as described in Fig. 2b) and in vivo (as described in Fig. 3b), as well as changes that occur upon wounding in young and old ears (as described in d). The heat map depicts the enrichment of the KEGG pathways that are present in at least two of the conditions described. For the complete list of differentially expressed genes and significant KEGG terms with specific P values, see Supplementary Tables 2b, c, 4f, g, 5a, b. The scale for enrichment is indicated on the left. g, Heat map of expression of a subset of cytokine genes from population RNA-seq of fibroblasts from young and old ears during basal and wounded conditions. Expression is shown as VST-transformed read counts, scaled row-wise. The scale for expression fold changes is indicated on the left. Basal and wound signatures refer to the average expression of the genes that are significantly downregulated or upregulated with wounding, respectively, in this dataset.
Extended Data Fig. 8 ∣. Single-cell RNA-seq analysis offibroblasts in wounds from young and old mice and single-cell RNA-seq analysis of entire wounds from old slow- and fast-healing mice at day 7.

a, Quality control for 10x Genomics single-cell RNA-seq data of freshly isolated PDGFRα+Lin− (CD45−CD31−EpCAM−TER119−TIE2−) cells from wounds of young mice (3–4 months, cells pooled from n = 10 mice) or old mice (24–26 months, cells pooled from n = 10 mice), 7 days after induction of wounds. Number of unique genes (left), percentage of mitochondrial genes (middle) and number of unique molecular identifiers (UMIs, right) for each cell are shown, separated by age group. Each dot represents a single cell. b, Seurat analysis of all live high-quality PDGFRα+Lin− cells described in a (3,036 cells in total) identified two main clusters of cells. Heat map depicts the expression of the top 10 marker genes for each significant cell cluster identified by Seurat, which are defined as the genes that are most specific to each population. The cell subpopulation identity assigned to each cluster is indicated below each column. c, PAGODA of the single-cell RNA-seq dataset described in a. PAGODA was performed using all KEGG pathways, and the in vitro fibroblast ageing and the fibroblast activation signatures (see Supplementary Table 2b, f). Top, heat map of single cells from wounds from young and old mice and cell clusters identified by Seurat and PAGODA analyses. Bottom, heat map of the separation of cells based on their principal component scores for the significantly overdispersed gene sets. Top heat map, PAGODA clustering of cells. Maroon and blue colours indicate increased and decreased expression of the associated gene sets, respectively. Bottom, log2-transformed fold change in the subpopulations between young and old wounds at day 7. d, PAGODA as described in c. Middle, heat map of the separation of cells based on their principal component scores for the fibroblast activation signature. Bottom, heat map of the expression of the genes that are part of the fibroblast activation signature (see Supplementary Table 2f); expression is shown as log-transformed and normalized gene expression values as calculated by Seurat and scaled row-wise. The scale for expression fold changes is indicated on the right. e, PAGODA as described in c. Middle, heat map of the separation of cells based on their principal component scores for the KEGG cytokine–cytokine receptor interaction gene set. Bottom, heat map of the expression of the genes that are part of the KEGG cytokine–cytokine receptor interaction; expression is shown as log-transformed and normalized gene expression values as calculated by Seurat and scaled row-wise. The scale for expression fold changes is indicated on the right. f, PAGODA as described in c. Middle, heat map of the separation of cells based on their principal component scores for the KEGG TNF signalling pathway gene set. Bottom, heat map of the expression of the genes that are part of the KEGG TNF signalling pathway; expression is shown as log-transformed and normalized gene expression values as calculated by Seurat and scaled row-wise. The scale for expression fold changes is indicated on the right. g, Representative images of the ears of the two slow-healing and two fast-healing old mice used for single-cell RNA-seq at day 7 after wounding (1 experiment). h, Ear wound healing curves of the ears of the two slow-healing and two fast-healing old mice used for single-cell RNA-seq. The percentage of the wound area that was not healed at the day 6 after induction of the wounds is indicated in parentheses. i, Quality control for 10x Genomics single-cell RNA-seq data of freshly isolated live cells from the ear wounds of slow-healing (n = 2) and fast-healing old mice (n = 2), 7 days after induction of wounds. Number of genes (left), percentage of mitochondrial genes (middle) and number of unique molecular identifier (right) for each cell are shown, separated by mouse. Each dot represents a single cell. j, Seurat analysis of all live high-quality cells described in i (10,797 cells in total) identified seven main clusters of cells. Heat map depicts the expression of the top 10 marker genes for each significant cell cluster identified by Seurat, which are defined as the genes that are most specific to each population. The cell subpopulation identity assigned to each cluster is indicated below each column.
Extended Data Fig. 9 ∣. Seurat and PAGODA single-cell RNA-seq analyses of fibroblasts identify distinct fibroblast subpopulations associated with fast- or slow-healing trajectories.
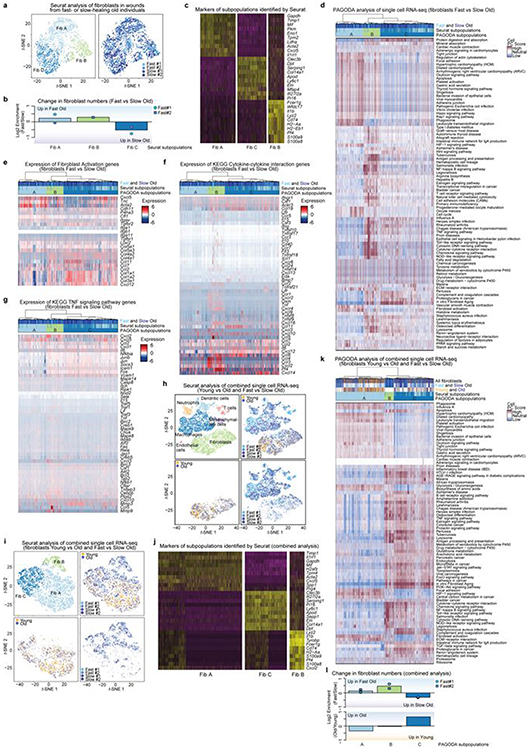
a–g, Analysis of cells identified as fibroblasts from the single-cell RNA-seq dataset described in Fig. 4c. a, t-SNE clustering of cells identified as fibroblasts (2,678 cells in total) coloured by significant clusters identified using a k-nearest neighbour (KNN) graph-based algorithm as implemented by Seurat, or by mouse. b, log2-transformed fold change in the number of cells in each of the three subpopulations identified by Seurat between fast-healing old wounds and slow-healing old wounds. c, Seurat analysis of fibroblasts (2,678 cells in total) identified three main clusters. Heat map depicts the expression of the top 10 marker genes for each significant cell cluster identified by Seurat, which are defined as the genes that are most specific to each population. The identity of each cell subpopulation assigned to each cluster is indicated below each column. d, PAGODA of fibroblasts. PAGODA was performed using raw expression counts and all KEGG pathways, and the in vitro fibroblast ageing and the fibroblast activation signatures (see Supplementary Table 2b, f). Top, heat map of single cells from wounds of old mice and cell clusters identified by Seurat and PAGODA analyses. Bottom, heat map of the separation of cells based on their principal component scores for the significantly overdispersed gene sets. Top heat map, PAGODA clustering of cells. Maroon and blue colours indicate increased and decreased expression of the associated gene sets, respectively. e, PAGODA as described in d. Bottom, heat map of the expression of the genes that are part of the fibroblast activation signature (see Supplementary Table 2f); expression is shown as log-transformed and normalized gene expression values as calculated by Seurat and scaled row-wise. The scale for expression fold changes is indicated on the right. f, Expression of the genes that are part of the KEGG cytokine–cytokine receptor interaction gene set as in e. g, Expression of the genes that are part of the KEGG TNF signalling pathway as in e. h–l, Analysis of the combined single-cell RNA-seq datasets described in Fig. 4b, c. h, Seurat analysis of combined datasets clusters fibroblasts from both datasets together. t-SNE clustering of all live, high-quality cells from both datasets (13,833 cells in total) coloured by significant clusters identified using a KNN graph-based algorithm as implemented by Seurat, or by mouse. i, t-SNE clustering of combined fibroblasts from the datasets described in Fig. 4b (PDGFRα+Lin−) and Fig. 4c. Combined fibroblasts (5,716 cells in total) are coloured by significant clusters identified using a KNN graph-based algorithm as implemented by Seurat, or by mouse. j, Seurat analysis of combined fibroblasts (5,716 cells in total) identified three main subpopulations. Heat map depicts the expression of the top 10 marker genes for each significant subpopulation identified by Seurat, which are defined as the genes that are most specific to each population. The cell subpopulation identity assigned to each cluster is indicated below each column. k, PAGODA of combined fibroblasts. PAGODA was performed using Seurat normalized counts and all KEGG pathways, the in vitro fibroblast ageing, the fibroblast activation signatures (see Supplementary Table 2b, f). Top, heat map of single fibroblasts from wounds of young and old mice or wounds from old fast- or slow-healing mice, and cell clusters identified by Seurat and PAGODA analyses. Bottom, heat map of separation of cells based on their principal component scores for a subset of the top significantly overdispersed gene sets. Top heat map, PAGODA clustering of cells. Maroon and blue colours indicate increased and decreased expression of the associated gene sets, respectively. Note that fibroblast subpopulation B did not contain cells from old/young in the combined analysis. This is probably owing to the fact that this subpopulation of fibroblast has some markers of the haematopoietic lineage, and is probably depleted in the PFGDRα+Lin− FACS-sorting scheme used to isolate fibroblasts from the wounds of young and old mice. l, log2-transformed fold change in each of the three combined fibroblast subpopulations identified by PAGODA between wounds of old fast- and slow-healing mice, or between wounds from young and old mice, at day 7.
Extended Data Fig. 10 ∣. FACS schematic for in vitro and in vivo fibroblast analysis and sorting and full western blot membranes.

a, FACS schematic for analysis and sorting of THY1−PDGFRα+ and THY1+PDGFRα+ cells in young and old cultures at passage 3. Gates shown on each plot are indicated above the plot. Marker and fluorophore are shown on each axis. FMO, fluorescence minus one. b, FACS schematic for analysis and sorting of live THY1−PDGFRα+Lin− and THY1+PDGFRα+Lin− cells from young and old fresh tissues (ears), used for population RNA-seq and single-cell RNA-seq analyses. Gates shown on each plot are indicated above the plot. Marker and fluorophore are shown on each axis. c, Full western blot membranes from Extended Data Fig. 6d, i, j. Boxes indicate the cropped area.
Supplementary Material
Acknowledgements
We thank D. Wagh from Stanford Functional Genomics Facility for help with 10x Genomics single-cell RNA-seq; C. Carswell-Crumpton and M. Weglarz from Stanford Shared FACS Facility for FACS support; L. Liu for help with shRNA experiments; V. Sebastiano and M. Kareta for help with iPS cell generation and quality assessment; V. Sebastiano, K. Andreasson, C. Weyand and T. Wyss-Coray for helpful discussions and input to the manuscript; L. Booth, T. Ruetz, P. P. Singh, X. Zhao, P. Navarro, B. Dulken and other members of the Brunet laboratory for helpful discussions and feedback on the manuscript; M. Buckley, B. Demmitt and P. P. Singh for helping with independent code checking; S. Chen, A. Freund, J. Goudeaux, M. Pesch, A. Roux and J. Reuter for feedback on the initial manuscript. The piggyback OSKM transposon constructs were a gift from K. Kaji. This work used the Genome Sequencing Service Center of the Stanford Center for Genomics and Personalized Medicine Sequencing Center, supported by the grant award NIH S10OD025212. Sorting was performed on instruments in the Stanford Shared FACS Facility obtained using the NIH grant award S10RR025518-01 and purchased by Parker Institute for Cancer Immunotherapy. Work was supported by NIH P01 GM099130 (to A.B., M.P.S. and J.W.), CIRM RB4-06087 (to A.B.), a generous philanthropic gift from M. and T. Barakett, the EMBO post-doctoral fellowship (to S.M.), the WennerGren post-doctoral fellowship (to S.M.), the Sweden-America Foundation post-doctoral fellowship (to S.M.), the Dean’s Fellowship (to E.M.), K99/R00 AG049934 (to B.A.B.), the Stanford Graduate Fellowship (to L.X.), the NSF Graduate Research Fellowship (to L.X.), R00 AG049934 and the Hanson-Thorell family fellowship (to B.A.B.), the Hagey Laboratory for Pediatric Regenerative Medicine, The Gunn/Olivier fund, the Johnson Longaker fund and R01 GM116892 (to M.T.L.).
Footnotes
Data availability
All raw sequencing reads for population RNA-seq, ChIP–seq and single-cell RNA-seq data can be found under BioProject PRJNA316110. The command and configuration files, in addition to a list of all versioned dependencies present in the running environment, are available on the Github repository for this paper (https://github.com/brunetlab/Mahmoudi_et_al_2018) (except for the code for the processing of metabolomics data, which is available upon request).
Online content
Any methods, additional references, Nature Research reporting summaries, source data, extended data, supplementary information, acknowledgements, peer review information; details of author contributions and competing interests; and statements of data and code availability are available at https://doi.org/10.1038/s41586-019-1658-5.
Competing interests The authors declare no competing interests.
Additional information
Supplementary information is available for this paper at https://doi.org/10.1038/s41586-019-1658-5.
Peer review information Nature thanks Ellen Pure, Fuchou Tang and the other, anonymous, reviewer(s) for their contribution to the peer review of this work.
References
- 1.Franceschi C & Campisi J Chronic inflammation (inflammaging) and its potential contribution to age-associated diseases. J. Gerontol. A Biol. Sci. Med. Sci 69, S4–S9 (2014). [DOI] [PubMed] [Google Scholar]
- 2.Eming SA, Martin P & Tomic-Canic M Wound repair and regeneration: mechanisms, signaling, and translation. Sci. Transl. Med 6, 265sr6 (2014). [DOI] [PMC free article] [PubMed] [Google Scholar]
- 3.Lynch MD & Watt FM Fibroblast heterogeneity: implications for human disease. J. Clin. Invest. 128, 26–35 (2018). [DOI] [PMC free article] [PubMed] [Google Scholar]
- 4.Ocampo A, Reddy P & Belmonte JCI Anti-aging strategies based on cellular reprogramming. Trends Mol. Med 22, 725–738 (2016). [DOI] [PubMed] [Google Scholar]
- 5.Chaleckis R, Murakami I, Takada J, Kondoh H & Yanagida M Individual variability in human blood metabolites identifies age-related differences. Proc. Natl Acad. Sci. USA 113, 4252–4259 (2016). [DOI] [PMC free article] [PubMed] [Google Scholar]
- 6.Ong ML & Holbrook JD Novel region discovery method for Infinium 450K DNA methylation data reveals changes associated with aging in muscle and neuronal pathways. Aging Cell 13, 142–155 (2014). [DOI] [PMC free article] [PubMed] [Google Scholar]
- 7.Li R et al. Linking inter-individual variability in functional brain connectivity to cognitive ability in elderly individuals. Front. Aging Neurosci 9, 385 (2017). [DOI] [PMC free article] [PubMed] [Google Scholar]
- 8.Cheung P et al. Single-cell chromatin modification profiling reveals increased epigenetic variations with aging. Cell 173, 1385–1397 (2018). [DOI] [PMC free article] [PubMed] [Google Scholar]
- 9.Lapasset L et al. Rejuvenating senescent and centenarian human cells by reprogramming through the pluripotent state. Genes Dev. 25, 2248–2253 (2011). [DOI] [PMC free article] [PubMed] [Google Scholar]
- 10.Li H et al. The Ink4/Arf locus is a barrier for iPS cell reprogramming. Nature 460, 1136–1139 (2009). [DOI] [PMC free article] [PubMed] [Google Scholar]
- 11.Ravaioli F, Bacalini MG, Franceschi C & Garagnani P Age-related epigenetic derangement upon reprogramming and differentiation of cells from the elderly. Genes 9, 39 (2018). [DOI] [PMC free article] [PubMed] [Google Scholar]
- 12.Mosteiro L et al. Tissue damage and senescence provide critical signals for cellular reprogramming in vivo. Science 354, aaf4445 (2016). [DOI] [PubMed] [Google Scholar]
- 13.Somers A et al. Generation of transgene-free lung disease-specific human induced pluripotent stem cells using a single excisable lentiviral stem cell cassette. Stem Cells 28, 1728–1740 (2010). [DOI] [PMC free article] [PubMed] [Google Scholar]
- 14.Guerrero-Juarez CF et al. Single-cell analysis reveals fibroblast heterogeneity and myeloid-derived adipocyte progenitors in murine skin wounds. Nat. Commun 10, 650 (2019). [DOI] [PMC free article] [PubMed] [Google Scholar]
- 15.Shook BA et al. Myofibroblast proliferation and heterogeneity are supported by macrophages during skin repair. Science 362, eaar2971 (2018). [DOI] [PMC free article] [PubMed] [Google Scholar]
- 16.Frenk S & Houseley J Gene expression hallmarks of cellular ageing. Biogerontology 19, 547–566 (2018). [DOI] [PMC free article] [PubMed] [Google Scholar]
- 17.Bahar R et al. Increased cell-to-cell variation in gene expression in ageing mouse heart. Nature 441, 1011–1014 (2006). [DOI] [PubMed] [Google Scholar]
- 18.Wiley CD et al. Analysis of individual cells identifies cell-to-cell variability following induction of cellular senescence. Aging Cell 16, 1043–1050 (2017). [DOI] [PMC free article] [PubMed] [Google Scholar]
- 19.Salzer MC et al. Identity noise and adipogenic traits characterize dermal fibroblast aging. Cell 175, 1575–1590 (2018). [DOI] [PubMed] [Google Scholar]
- 20.Croft AP et al. Distinct fibroblast subsets drive inflammation and damage in arthritis. Nature 570, 246–251 (2019). [DOI] [PMC free article] [PubMed] [Google Scholar]
- 21.Brady JJ et al. Early role for IL-6 signalling during generation of induced pluripotent stem cells revealed by heterokaryon RNA-seq. Nat. Cell Biol 15, 1244–1252 (2013). [DOI] [PMC free article] [PubMed] [Google Scholar]
- 22.Keyes BE et al. Impaired epidermal to dendritic T cell signaling slows wound repair in aged skin. Cell 167, 1323–1338 (2016). [DOI] [PMC free article] [PubMed] [Google Scholar]
- 23.Nishiguchi MA, Spencer CA, Leung DH & Leung TH Aging suppresses skin-derived circulating SDF1 to promote full-thickness tissue regeneration. Cell Rep. 24, 3383–3392 (2018). [DOI] [PMC free article] [PubMed] [Google Scholar]
- 24.Coppé JP et al. Senescence-associated secretory phenotypes reveal cell-nonautonomous functions of oncogenic RAS and the p53 tumor suppressor. PLoS Biol. 6, e301 (2008). [DOI] [PMC free article] [PubMed] [Google Scholar]
- 25.Ramírez-Solis R et al. Genomic DNA microextraction: a method to screen numerous samples. Anal. Biochem 201, 331–335 (1992). [DOI] [PubMed] [Google Scholar]
- 26.Lo Sardo V et al. Influence of donor age on induced pluripotent stem cells. Nat. Biotechnol 35, 69–74 (2017). [DOI] [PMC free article] [PubMed] [Google Scholar]
- 27.Kareta MS et al. Inhibition of pluripotency networks by the Rb tumor suppressor restricts reprogramming and tumorigenesis. Cell Stem Cell 16, 39–50 (2015). [DOI] [PMC free article] [PubMed] [Google Scholar]
- 28.Vierbuchen T et al. Direct conversion of fibroblasts to functional neurons by defined factors. Nature 463, 1035–1041 (2010). [DOI] [PMC free article] [PubMed] [Google Scholar]
- 29.Ackermann M & Strimmer K A general modular framework for gene set enrichment analysis. BMC Bioinformatics 10, 47 (2009). [DOI] [PMC free article] [PubMed] [Google Scholar]
- 30.Heinz S et al. Simple combinations of lineage-determining transcription factors prime cis-regulatory elements required for macrophage and B cell identities. Mol. Cell 38, 576–589 (2010). [DOI] [PMC free article] [PubMed] [Google Scholar]
- 31.Langmead B, Trapnell C, Pop M & Salzberg SL Ultrafast and memory-efficient alignment of short DNA sequences to the human genome. Genome Biol. 10, R25 (2009). [DOI] [PMC free article] [PubMed] [Google Scholar]
- 32.Hashimoto TB, Edwards MD & Gifford DK Universal count correction for high-throughput sequencing. PLOS Comput. Biol 10, e1003494 (2014). [DOI] [PMC free article] [PubMed] [Google Scholar]
- 33.Feng J, Liu T, Qin B, Zhang Y & Liu XS Identifying ChIP–seq enrichment using MACS. Nat. Protocols 7, 1728–1740 (2012). [DOI] [PMC free article] [PubMed] [Google Scholar]
- 34.Zhang Y et al. Model-based analysis of ChIP–seq (MACS). Genome Biol. 9, R137 (2008). [DOI] [PMC free article] [PubMed] [Google Scholar]
- 35.Ross-Innes CS et al. Differential oestrogen receptor binding is associated with clinical outcome in breast cancer. Nature 481, 389–393 (2012). [DOI] [PMC free article] [PubMed] [Google Scholar]
- 36.Li Q, Brown JB, Huang H & Bickel PJ Measuring reproducibility of high-throughput experiments. Ann. Appl. Stat 5, 1752–1779 (2011). [Google Scholar]
- 37.Love MI, Huber W & Anders S Moderated estimation of fold change and dispersion for RNA-seq data with DESeq2. Genome Biol. 15, 550 (2014). [DOI] [PMC free article] [PubMed] [Google Scholar]
- 38.Benayoun BA et al. H3K4me3 breadth is linked to cell identity and transcriptional consistency. Cell 158, 673–688 (2014). [DOI] [PMC free article] [PubMed] [Google Scholar]
- 39.Azuara V et al. Chromatin signatures of pluripotent cell lines. Nat. Cell Biol 8, 532–538 (2006). [DOI] [PubMed] [Google Scholar]
- 40.Bernstein BE et al. A bivalent chromatin structure marks key developmental genes in embryonic stem cells. Cell 125, 315–326 (2006). [DOI] [PubMed] [Google Scholar]
- 41.Guan S, Price JC, Prusiner SB, Ghaemmaghami S & Burlingame AL A data processing pipeline for mammalian proteome dynamics studies using stable isotope metabolic labeling. Mol. Cell. Proteomics 10, M111.010728 (2011). [DOI] [PMC free article] [PubMed] [Google Scholar]
- 42.Smith CA, Want EJ, O’Maille G, Abagyan R & Siuzdak G XCMS: processing mass spectrometry data for metabolite profiling using nonlinear peak alignment, matching, and identification. Anal. Chem. 78, 779–787 (2006). [DOI] [PubMed] [Google Scholar]
- 43.van den Berg RA, Hoefsloot HC, Westerhuis JA, Smilde AK & van der Werf MJ Centering, scaling, and transformations: improving the biological information content of metabolomics data. BMC Genomics 7, 142 (2006). [DOI] [PMC free article] [PubMed] [Google Scholar]
- 44.Xia J, Sinelnikov IV, Han B & Wishart DS MetaboAnalyst 3.0—making metabolomics more meaningful. Nucleic Acids Res. 43, W251–W257 (2015). [DOI] [PMC free article] [PubMed] [Google Scholar]
- 45.Bronte V & Zanovello P Regulation of immune responses by l-arginine metabolism. Nat. Rev. Immunol 5, 641–654 (2005). [DOI] [PubMed] [Google Scholar]
- 46.Phang JM, Liu W, Hancock C & Christian KJ The proline regulatory axis and cancer. Front. Oncol 2, 60 (2012). [DOI] [PMC free article] [PubMed] [Google Scholar]
- 47.Rath M, Müller I, Kropf P, Closs EI & Munder M Metabolism via arginase or nitric oxide synthase: two competing arginine pathways in macrophages. Front. Immunol 5, 532 (2014). [DOI] [PMC free article] [PubMed] [Google Scholar]
- 48.Fan J et al. Characterizing transcriptional heterogeneity through pathway and gene set overdispersion analysis. Nat. Methods 13, 241–244 (2016). [DOI] [PMC free article] [PubMed] [Google Scholar]
- 49.O’Malley J et al. High-resolution analysis with novel cell-surface markers identifies routes to iPS cells. Nature 499, 88–91 (2013). [DOI] [PMC free article] [PubMed] [Google Scholar]
- 50.Schaffer BE et al. Identification of AMPK phosphorylation sites reveals a network of proteins involved in cell invasion and facilitates large-scale substrate prediction. Cell Metab. 22, 907–921 (2015). [DOI] [PMC free article] [PubMed] [Google Scholar]
- 51.Lam MT, Nauta A, Meyer NP, Wu JC & Longaker MT Effective delivery of stem cells using an extracellular matrix patch results in increased cell survival and proliferation and reduced scarring in skin wound healing. Tissue Eng. Part A 19, 738–747 (2013). [DOI] [PMC free article] [PubMed] [Google Scholar]
- 52.Barret JP et al. Accelerated re-epithelialization of partial-thickness skin wounds by a topical betulin gel: results of a randomized phase III clinical trials program. Burns 43, 1284–1294 (2017). [DOI] [PubMed] [Google Scholar]
- 53.Butler A, Hoffman P, Smibert P, Papalexi E & Satija R Integrating single-cell transcriptomic data across different conditions, technologies, and species. Nat. Biotechnol 36, 411–420 (2018). [DOI] [PMC free article] [PubMed] [Google Scholar]
- 54.Stuart T et al. Comprehensive integration of single-cell data. Cell 177, 1888–1902 (2019). [DOI] [PMC free article] [PubMed] [Google Scholar]
- 55.Joost S et al. Single-cell transcriptomics of traced epidermal and hair follicle stem cells reveals rapid adaptations during wound healing. Cell Rep. 25, 585–597 (2018). [DOI] [PubMed] [Google Scholar]
- 56.Cheng JB et al. Transcriptional programming of normal and inflamed human epidermis at single-cell resolution. Cell Rep. 25, 871–883 (2018). [DOI] [PMC free article] [PubMed] [Google Scholar]
- 57.Der E et al. Tubular cell and keratinocyte single-cell transcriptomics applied to lupus nephritis reveal type I IFN and fibrosis relevant pathways. Nat. Immunol 20, 915–927 (2019). [DOI] [PMC free article] [PubMed] [Google Scholar]
- 58.Sun Z et al. A Bayesian mixture model for clustering droplet-based single-cell transcriptomic data from population studies. Nat. Commun 10, 1649 (2019). [DOI] [PMC free article] [PubMed] [Google Scholar]
- 59.Mertens J et al. Directly reprogrammed human neurons retain aging-associated transcriptomic signatures and reveal age-related nucleocytoplasmic defects. Cell Stem Cell 17, 705–718 (2015). [DOI] [PMC free article] [PubMed] [Google Scholar]
- 60.Luminex. xPonent 3.1 Logistic Curve Fitting: Technical Notes. https://www.luminexcorp.com/zh/download/xponent-3-1-logistic-curve-fitting-white-paper/ (2014). [Google Scholar]
- 61.Carter AC, Davis-Dusenbery BN, Koszka K, Ichida JK & Eggan K Nanog-independent reprogramming to iPSCs with canonical factors. Stem Cell Rep. 2, 119–126 (2014). [DOI] [PMC free article] [PubMed] [Google Scholar]
Associated Data
This section collects any data citations, data availability statements, or supplementary materials included in this article.