Abstract
The hypomethylation of the Cyclin D1 (CCND1) promoter induced by excess oxidative stress likely promotes the development of hepatitis B virus-associated hepatocellular carcinoma (HBV-HCC). We aimed to evaluate methylation status of the CCND1 promoter as a new plasma marker for the detection of HBV-HCC.
We consecutively recruited 191 participants, including 105 patients with HBV-HCC, 54 patients with chronic hepatitis B (CHB), and 32 healthy controls (HCs). Using methylation-specific polymerase chain reaction, we identified the methylation status of the CCND1 promoter in plasma samples. We analyzed the expression levels of the CCND1 mRNA in peripheral blood mononuclear cells by using quantitative real-time PCR. We assessed the plasma levels of superoxide dismutase, 8-hydroxydeoxyguanosine and malondialdehyde by using enzyme-linked immunosorbent assays.
Patients with HBV-HCC (23.81%) presented a reduced methylation frequency compared with patients with CHB (64.81%) or HCs (78.13%) (P < .001). When receiver operating characteristic curves were plotted for patients with HBV-HCC versus CHB, the methylation status of the CCND1 promoter yielded diagnostic parameter values for the area under the curve of 0.705, sensitivity of 76.19%, and specificity of 64.81%, thus outperforming serum alpha-fetoprotein (AFP), which had an area under the curve of 0.531, sensitivity of 36.19%, and specificity of 90.74%. Methylation of the CCND1 promoter represents a prospective diagnostic marker for patients with AFP-negative HBV-HCC and AFP-positive CHB. The expression levels of CCND1 mRNA was increased in patients with HBV-HCC compared with patients with CHB (Z = -4.946, P < .001) and HCs (Z = -6.819, P < .001). Both the extent of oxidative injury and antioxidant capacity indicated by the superoxide dismutase, 8-hydroxydeoxyguanosine and malondialdehyde levels were increased in patients with HBV-HCC. Clinical follow up of patients with HBV-HCC revealed a worse overall survival (P = .012, log-rank test) and a decreased progression-free survival (HR = 0.109, 95%CI: 0.031-0.384) for the unmethylated CCND1 group than methylated CCND1 group.
Our study confirms that oxidative stress appears to correlate with plasma levels of CCND1 promoter methylation, and the methylation status of the CCND1 promoter represents a prospective biomarker with better diagnostic performance than serum AFP levels.
Keywords: cyclin D1, DNA methylation, hepatitis B virus, hepatocellular carcinoma, oxidative stress
1. Introduction
Hepatocellular carcinoma (HCC) is a main type of liver cancer, ranking in the sixth most prevalent human cancers and the fourth leading cause of cancer-related deaths globally.[1] Hepatitis B virus (HBV) remains the dominant risk factor for HCC in the most of Asia-Pacific countries, especially in China.[2] Aberrant DNA methylation potentially leads to development of HCC,[3] which is a crucial epigenetic modification performed by DNA methyltransferases (DNMTs).[4] During catalysis of methyltransferase, a methyl group is selectively added to cytosines present in CG nucleotides of DNA to form 5-methylcytosine.[4]
Currently, the epigenetic alterations of certain genes have been demonstrated to be potential biomarkers for cancerous and inflammatory diseases. As we know, cyclins, cyclin-dependent kinases (CDKs) and cyclin dependent kinase inhibitors (CKIs) are essential for the tumorigenesis of hepatocellular carcinoma.[5,6,7] The promoter of cyclin D2 (CCND2) gene was frequently hypermethylated and the subsequent down regulation of the cyclin D2 gene in hepatocellular carcinoma was associated with early intrahepatic recurrence after 1 year of curative hepatectomy.[8,9] In addition, the promoters of the cyclin a1 (CCNA1) and cyclin-dependent kinase-like 2 (CDKL2) gene were found to be hypermethylated in hepatocellular cancerous tissue compared with normal liver tissue.[10,11] The p15INK4B and p16INK4A are the inhibitors of cell cycle gene and the promoters of these two genes were demonstrated to display various methylation frequency ranging from about 82% in hepatocellular carcinoma to 33%-39% in liver cirrhosis.[12] As a member of the cyclin G1 genes family, the cyclin D1 (CCND1) gene regulates the G1/S phase transition in the tumorigenesis.[13] The methylation signature of CCND1 gene has been reported to contribute to the oncogenesis of hepatocellular carcinoma.[14] However, the methylation for the promoter of cyclin D1 (CCND1) gene and its clinical significance in hepatocellular carcinoma have not been completed elucidated up to date. In the past few decades, significant advances in the fields of circulating tumor DNA,[15] which is regarded as a breakthrough in medical research, have been achieved and created a renewed interest in cell-free DNA methylation in the plasma of patients as a potential surveillance or diagnostics strategy for illnesses that are less likely to have a cure.[16,17] The main aim of our present study was to investigate potential value of the cell-free CCND1 promoter methylation as the biomarker for the diagnosis of HBV-HCC.
Reactive oxygen species (ROS) mainly include superoxide, hydrogen peroxide, and the hydroxyl radical,[18] and induce DNA damage, genomic instability as well as accelerate nearby cancer cells’ genetic evolution towards states of heightened malignancy.[19] Cancer cells are particularly vulnerable to high levels of oxidative stress caused by increased generations of ROS, or an imbalance between oxidative stress and antioxidant in vivo.[20] Several tumor cell lines constitutively produce substantial amounts of hydrogen peroxide; consequently, excess oxidative stress potentially strengthens tumorous behavior.[21] Treatments targeting transketolase (TKT) increase oxidative stress, enabling cancer cells to become immune to therapeutic treatment; nevertheless, TKT knockdown leads to an increase in ROS production, indicating that oxidative stress homeostasis is a critical determinant of neoplasm development.[22] Previous report has demonstrated that the oxidative stress promotes hepatocellular carcinoma progression,[23] and our previous study also supported this finding.[24] In vitro experiments showed that oxidative stress-induced DNA damage cause substantial DNA hypomethylation.[25] Therefore, we postulate that oxidative stress might be a prerequisite for global hypomethylation of the CCND1 promoter in HBV-HCC.
Our present study aimed to investigate the methylation pattern of the CCND1 promoter in plasma from HBV-HCC patients, and to determine the potential role of CCND1 gene promoter methylation as biomarker for the patients with hepatocellular carcinoma. In the present study, methylation-specific polymerase chain reaction (MSP) was used for the detection of plasma levels of CCND1 promoter methylation. Reverse transcription-quantitative polymerase chain reaction was used for determining the expression of the CCND1 mRNA in peripheral blood mononuclear cells (PBMCs). The plasma parameters for oxidative stress were assessed by using enzyme-linked immunosorbent assays (ELISAs).
2. Methods
2.1. Study population
In our study, participants were recruited from May 2016 to July 2018 at the Department of Hepatology, Qilu Hospital of Shandong University including 105 patients with HBV-HCC,54 patients with chronic hepatitis B (CHB) and 32 healthy controls (HCs). The present study complied with the moral principles of the 1975 Declaration of Helsinki, and ethical approval for this study was obtained from the Local Research and Ethics Committee at Qilu Hospital of Shandong University; along with written informed consent was provided by all subjects.
Patients were diagnosed with HBV-HCC based on the findings from ultrasound, enhanced computed tomography (CT), magnetic resonance imaging (MRI), alpha-fetoprotein (AFP) serology and needle biopsy of liver, and the diagnosis was confirmed according to the 2018 Practice Guidance by the American Association for the Study of Liver Diseases (AASLD) for Diagnosis, Staging, and Management of Hepatocellular Carcinoma.[26] The main eligibility and exclusion criteria of participants were formulated (Figure 1). The following inclusion criteria were set:
Figure 1.
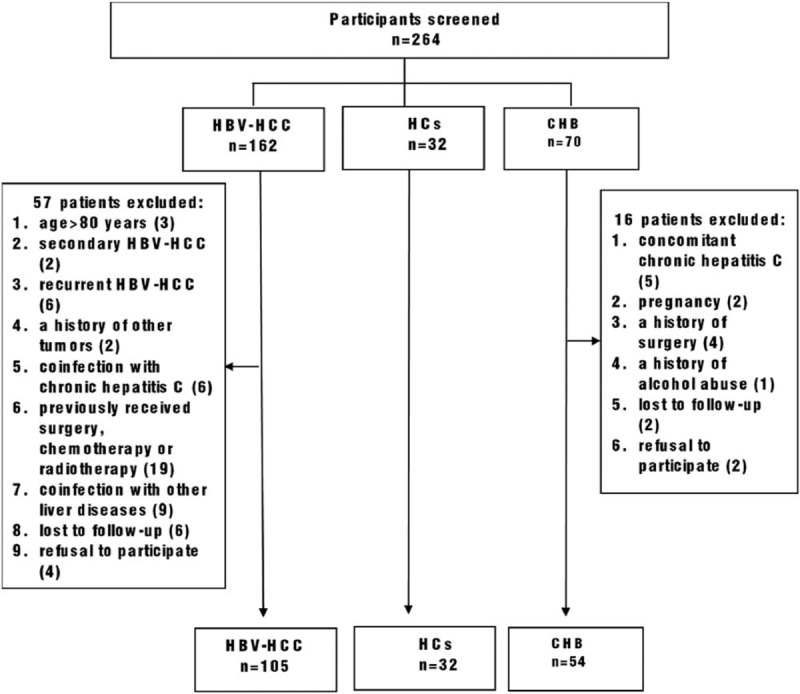
Flowchart of the inclusion and exclusion criteria. HBV- HCC = hepatitis B virus-associated hepatocellular carcinoma, CHB = chronic hepatitis B, HCs = healthy controls.
-
(1)
patients >18 years old;
-
(2)
patients with measurable, histologically proven hepatocellular carcinoma;
-
(3)
patients with the clear history of chronic HBV infection.
The following exclusion criteria were set:
-
(1)
age >80 years;
-
(2)
metastatic disease;
-
(3)
patients with a history of other tumors;
-
(4)
coinfection with hepatitis virus other than HBV or autoimmune hepatitis (AIH);
-
(5)
patients with drug-induced liver injury (DILI);
-
(6)
patients with alcoholic liver disease (ALD) or non-alcoholic fatty liver disease (NAFLD);
-
(7)
patients previously received surgery, chemotherapy or radiotherapy.
Patients with HBV-HCC received surgical resection, trans arterial chemoembolization (TACE), radiofrequency ablation (RFA), microwave ablation (MWA), and chemotherapy.[27] Diagnostic criteria for CHB were established based on the presence of hepatitis B surface antigen for at least 6 months in accordance with the 2018 update of the AASLD Hepatitis B Guidance on Prevention, Diagnosis, and Treatment of CHB.[28] HCs were subjects who were serologically negative for hepatitis viruses, had no history of malignancies, and had no history of surgery.
2.2. Sample collections
Five milliliters of peripheral venous blood were collected from every subject after an 8-hour fasts; the blood was collected in a tube containing the anticoagulant ethylenediaminetetraacetic acid. The samples were then centrifuged at 1500r/min for 5 minutes at room temperature. Supernatants (plasma) were immediately transferred into clean microcentrifuge tube (2 mL per tube) using Pasteur pipettes and stored at -80°C until use. PBMCs were isolated by gradient centrifugation on Ficoll-Paque (Pharmacia Diagnosis, Uppsala, Sweden), and well preserved at -20°C.
2.3. Clinicopathological data collection
Considering the indexes that reflect the metabolic state and liver injury, easily and readily available variables were retrieved from the patients’ medical records, including age, gender, AFP levels, presence of an HBV infection, tumor size, vascular invasion or metastasis, TNM stage, alanine aminotransferase (ALT) levels, aspartate aminotransferase (AST) levels, international normalized ratio of prothrombin time (PT-INR), prothrombin time activity, albumin (ALB) levels, total bilirubin (TBIL) levels. All these parameters were measured using standard laboratory methods in the Department of Laboratory Medicine, Qilu Hospital, Shandong University.
2.4. DNA extraction and sodium bisulfite modification
Genomic DNA was extracted from 400 μl of plasma, by using the QIAamp DNA Blood Mini Kit (QIAGEN, Valencia, CA), according to the manufacturer's the protocol. Then, for optimal results, bisulfite conversion was performed using 500ng of genomic DNA, and the EZ DNA Methylation-Gold Kit (Zymo Research, Orange, CA). Consequently, unmethylated cytosines were converted to uracil while methylated cytosines remained unchanged during the treatment. A final volume of 20 μL of modified DNA was obtained, and was either used for immediate analysis or stored at or below -20 °C until use.
2.5. MSP
Methylation-specific PCR was subsequently performed to examine the methylation status of the CCND1 promoter. For PCR, the amount of input bisulfite-modified DNA was a 1-microliter aliquot, and primers specific for methylated or unmethylated sequences were added. The primers were designed by the MethPrimer software (http://www.urogene.org/methprimer/) to generate a 146 bp PCR product, and the following sequences were: methylated CCND1, 5′-GTTAAGGTAGGAAGGTAGTTCG-3′(forward) and 5′-AAATTTCAACTTAACATACGCTCG-3′ (reverse); and unmethylated CCND1, 5′-GGTTAAGGTAGGAAGGTAGTTTGAAG-3′(forward) and 5′-AATTTCAACTTAACATACACTCACTC-3′(reverse). The reaction mixture was prepared according to the manufacturer's instructions, and included 2 μL of modified-DNA,0.5 μl of each primer, 10.5 μl of nuclease-free water, 12.5 μL of Premix Taq (Zymo Research), in a final volume of 26 of μL. MSP was performed at 95 °C (10 min), followed by 45 cycles of denaturation at 94 °C (30s),61 °C (30s), and 72 °C (30s), and then cooled at 4 °C. The PCR products were electrophoresed on 2% agarose gels at 130 volts for 30 min, stained with Gel Red (Biotium, California), and visualized under UV illumination. All experiments were performed in triplicate. Details were omitted here.
2.6. RNA extraction and quantitative real-time PCR
Total RNA was extracted from PBMCs by using the phenol-chloroform-isopropanol method, and converted into complementary DNA (cDNA) with first-strand cDNA synthesis kit (Fermentas, Vilnius, Lithuania) according to the manufacturer's instruction. Quantitative real-time PCR was utilized to measure the expression of the CCND1 mRNA in each group. The glyceraldehyde-3-phosphate dehydrogenase (GAPDH) gene served as a housekeeping gene for normalization. The amplification system and program for quantitative real-time PCR were optimized. The reactants were mixed in a total volume of 10 μL, which contained 4.1 μL of nuclease-free water, 5 μL of SYBR Green, 0.2 μL of each primer, and 0.5 μL of cDNA, and reacted, under the following conditions: hot-start at 95 °C (10 min), followed by 45cycles of denaturation at 95 °C (5s), annealing at 58 °C (30s) and extension at 72 °C (30s). The sequences of primers used for qPCR analysis were described in a previous study:[29]CCND1, 5′-CGGAGGAGAACAAACAGATCAT-3′(forward) and 5′ AGGCGGTAGTAGGACAGGAATG-3′(reverse); and GAPDH, 5′-CGGATTTGGTCGTATTGGGC-3′and5′-CCTGGAAGATGGTGATGGGATT-3′. The expression levels of the CCND1 gene and GAPDH gene in the samples were reported as relative expression by calculating the 2−ΔΔCT value of each sample.
2.7. ELISAs
This study describes the development of sensitive and competitive ELISAs for the quantitative detection of superoxide dismutase (SOD), 8-hydroxydeoxyguanosine (8-OHdG) and malondialdehyde (MDA) levels in plasma. ELISAs were performed using a Human SOD ELISA Kit (Shanghai Lengton Bioscience Co., Ltd., China), Human 8-OHdG ELISA Kit (Shanghai Lengton Bioscience Co., Ltd., China), and Human MDA ELISA Kit (Shanghai Lengton Bioscience Co., Ltd., China) according to the procedures provided by the manufacturer.
2.8. Statistical analysis
All results were produced with IBM SPSS Statistics 25.0 software (SPSS Inc., Chicago, IL, USA) and MedCalc15.2.2 (Ostend, Belgium) in the present study. Demographic characteristics were summarized either as medians and 25th to 75th percentiles or as percentages. Categorical variables were compared via Chi-square test. Quantitative variables were compared via the Mann-Whitney U test. Spearman rank correlation coefficients were calculated to evaluate correlations between 2 statistical variables. Predictors of HBV-HCC development were identified by using a binary logistic regression analysis. Receiver operating characteristic (ROC) curves were generated for the CCND1 promoter methylation status and serum AFP levels. The area under the curve (AUC) was calculated for each biomarker as an indicator of the predictive accuracy. Kaplan-Meier time-to-event methods and log-rank tests were applied to evaluate and compare overall survival (OS) among groups. Analyses were constructed to calculate the hazard ratio (HR) with 95% CI for an estimation of risk factors contributing to survival following a diagnosis of HBV-HCC; the Cox proportional hazard regression model allowed us to consider multiple factors affecting the survival time or outcome. All P values were 2 tailed, and P < .05 was considered statistically significant.
3. Results
3.1. Baseline characteristics of the study participants
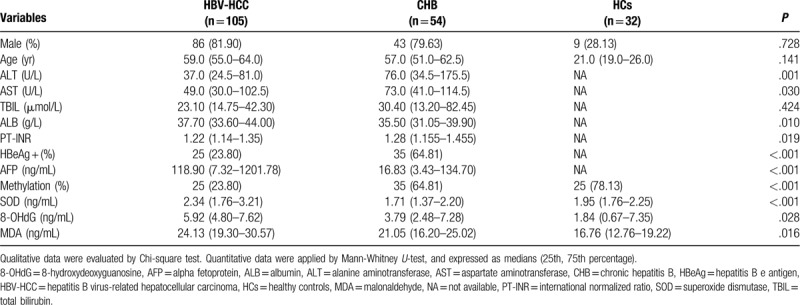
The eligible participants we recruited for this randomized and double-bland study designed to investigated the methylation status of the CCND1 gene promoter comprised 105 patients with HBV-HCC, 54 patients with CHB, and 32 healthy controls. Baseline characteristics of patients in the HBV-HCC group, CHB group, and HC group are summarized in Table 1, including the ALT, AST, TBIL, ALB, PT-INR, HBeAg, and AFP levels. Among the 105 patients with HBV-HCC, 86 patients were male, and the median age was 59.0 years (55.0-64.0). The HBV-HCC group displayed less advanced hepatic insufficiency, as indicated by the levels of ALT, AST, ALB, and PT-INR, compared with the CHB group. Despite these conditions, a reduced HBeAg positive rate (P < .001) and a distinctly increased serum AFP level (median: 118.90 versus 16.83, P < .001) was achieved in the HBV-HCC group.
Table 1.
Baseline characteristics of enrolled participants.
3.2. Methylation status of the CCND1 promoter in plasma
The methylation status of the CCND1 promoter in the plasma of the participants is depicted in Figure 2A. The methylation frequency in patients with HBV-HCC was 23.81% (80/105), and the methylation frequencies in patients with CHB and HCs were64.81% (35/54) and 78.13% (25/32), respectively. Apparently, the methylation frequency of the CCND1 promoter was higher in samples from patients with HBV-HCC than in patients with CHB and HCs samples (χ2 = 25.520, P < .001; χ2 = 31.219, P < .001). No significant differences were observed between patients with CHB and HCs (χ2 = 1.688, P = .194). The methylation status is not correlated with AFP levels (Figure 4O, P > .05), and advanced patients with HBV-HCC (TNM III and IV) appears lower methylation frequency than patients with HBV-HCC of early stage (TNM I and II) (Figure 4P, P = .033). Representative results from the MSP of the CCND1 promoter methylation status are presented (Figure 2B).
Figure 2.
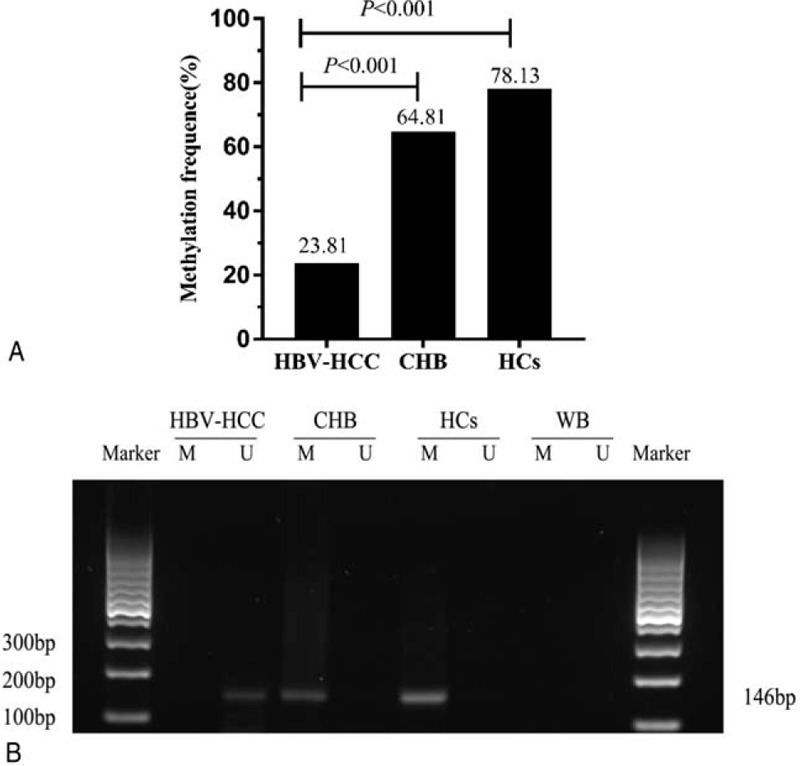
A. Comparison of the CCND1 methylation frequency in different groups. HBV-HCC = hepatitis B virus-associated hepatocellular carcinoma, CHB = chronic hepatitis B, HCs = healthy controls. P < 0.05 indicates a statistically significance difference. B. Typical methylation-specific polymerase chain reaction (MSP) results for the CCND1 gene promoter. M = methylated sequence, U = unmethylated sequence, HBV- HCC = hepatitis B virus-associated hepatocellular carcinoma, CHB = chronic hepatitis B, HCs = healthy controls, WB = water blank. The MSP product size of MSP is 146 bp.
Figure 4.
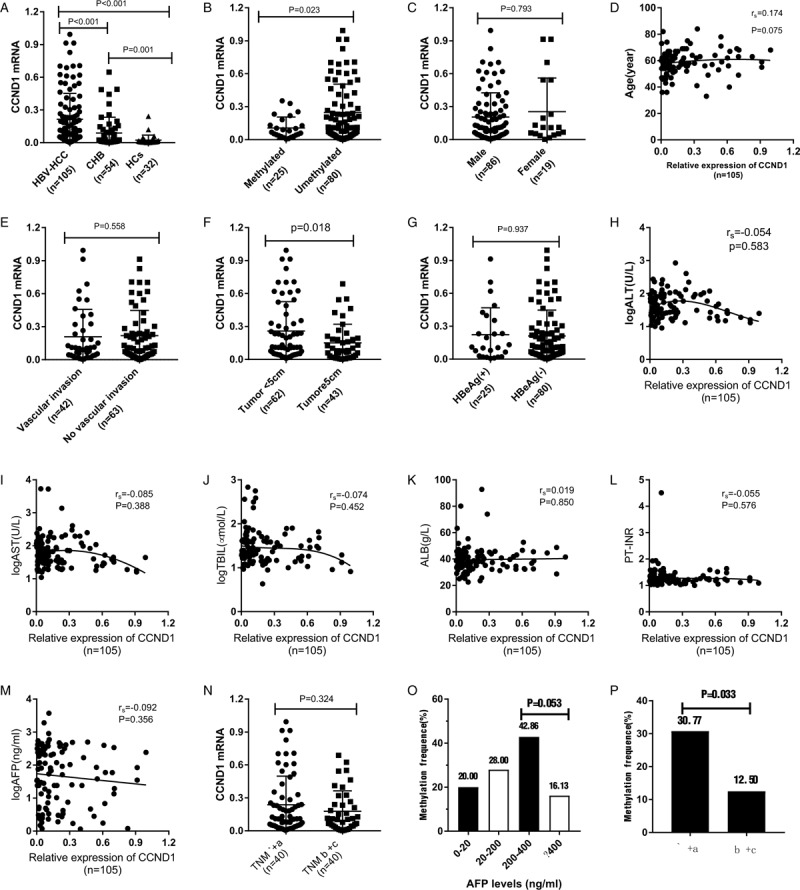
A. Relative expression level of CCND1 mRNA level in PBMCs from the HBV-HCC, CHB and HC groups. B. Patients with methylated CCND1 expressed CCND1 mRNA at a low level than patients with HBV-HCC presenting the unmethylated promoter (P = .023). C. A significant difference in the CCND1 mRNA level was not observed between males and females (P = .793). D and H-M. No significant correlations were observed between the expression of the CCND1 mRNA and age, ALT levels, AST levels, TBIL levels, ALB levels, PT-INR, AFP levels, and TNM stage (rs = 0.174, P = 0.075; rs = -0.054, P = .583; rs = -0.074, P = .452; rs = 0.019, P = .850; rs = -0.055, P = .576; and rs = -0.092, P = .356, respectively). E. No significant difference in the CCND1 mRNA level was observed between patients presenting with or without vascular invasion or not (P = .558). G. No significant difference in the CCND1 mRNA level was observed between HBeAg(+) and HBeAg(-) patients (P = .937). F. Patients with a tumor size < 5-cm expressed the CCND1 mRNA at significantly higher levels than patients with a tumor size≥5-cm (P = .018). N. No significant difference in the CCND1 mRNA level was observed between patients with TNM stages I + II and III + IV (P = .324). O. Methylation frequencies in patients with different AFP levels. P. Methylation frequencies in patients with different TNM stages.
3.3. Observational association between the methylation status of the CCND1 promoter in patients with HBV-HCC and clinicopathological characteristics
As shown in Table 1, patients with HBV-HCC showed higher plasma SOD levels [2.34 (1.76-3.21)], as indicated by the P value < .001, compared with patients with CHB [1.71 (1.37-2.20)]. Similar to the plasma SOD levels, the 8-OHdG levels in patients with HBV-HCC (5.92 [4.80-7.62]) were significantly increased compared with patients with CHB (3.79 [2.48-7.28]) (P = .028). An analogous trend was observed when we compared plasma MDA levels in patients with HBV-HCC (24.13 [19.30-30.57]) and CHB (21.05 [16.20-25.02]) (P = .016).
A Detailed description of the associations between the methylated or unmethylated CCND1 promoter in patients with HBV-HCC and clinicopathological characteristics is provided in Table 2. The methylated CCND1 promoter achieved high performance in identifying HBV-HCC in terms of tumor size (χ2 = 3.900, P = .049) and TNM stage (χ2 = 4.556, P = .033) and was particularly useful, for plasma SOD (P < .001), 8-OHdG (P = .001), and MDA levels (P < .001). Table 3 shows the rank correlation coefficients that indicated significant negative correlations between the methylation status, tumor size and TNM stage (rs = -0.193, P = .049; and rs = -0.208, P = .033, respectively). Factors related to oxidative stress, such as plasma SOD, 8-OHdG and MDA levels were negatively correlated with CCND1 methylation (rs = -0.533, P < .001; rs = -0.324, P = .001; and rs = -0.526, P < .001, respectively). Additionally, other clinicopathological characteristics, such as gender, age, AFP, vascular invasion or metastasis, and HBeAg status were also further tested, although the correlation did not reach statistical significance (Table 2, P > .05). Tumor size, TNM stage, and SOD, 8-OHdG, and MDA levels were selected as independent variables with significant effects for binary logistic regression analysis to confirm the independent risk factors for HBV- HCC (Table 4). The levels of SOD and MDA, but not 8-OHdG, affected the occurrence of HBV-HCC.
Table 2.
Association between the methylation status of CCND1 in patients with hepatitis B virus-associated hepatocellular carcinoma and clinicopathological characteristics.
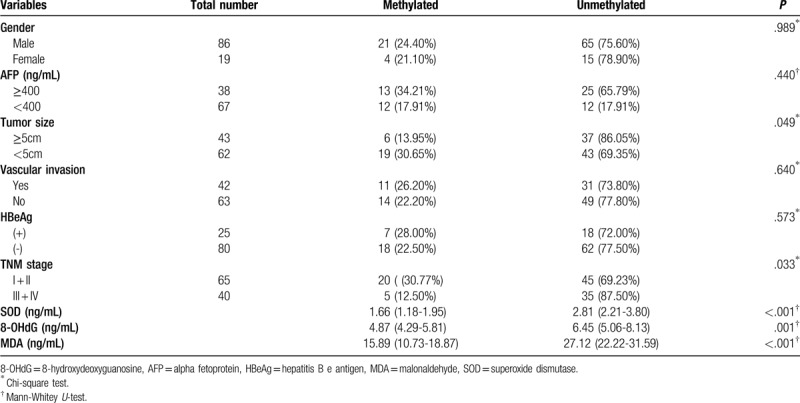
Table 3.
Correlation of CCND1 promoter methylation status among with clinicopathological characteristics.

Table 4.
Binary logistic regression analysis of clinicopathological characteristics in hepatitis B virus-associated hepatocellular carcinoma.

3.4. Plasma CCND1 promoter methylation outperforms serum AFP levels as a biomarker
Using the detection of CCND1 promoter methylation status in plasma to define an abnormality, a sensitivity of 76.19% (80/105) was achieved with a specificity of 64.81% (35/54), positive predictive value of 80.81% (80/99), negative predictive value of 58.33% (35/60), and Youden index of 0.41. The serum AFP level permitted us to differentiate patients with HBV-HCC from patients with CHB with a sensitivity of 36.19% (38/105), specificity of 90.74% (49/54), positive predictive value of 88.37% (38/43), negative predictive value of 42.24% (49/116), and Youden index of 0.2693 (Table 5). We then assessed the diagnostic values of plasma CCND1 promoter methylation and serum AFP levels in patients with HBV-HCC, and plotted ROC curves for patients with HBV-HCC versus CHB group. As shown in Figure 3A, the plasma CCND1 promoter methylation status yielded higher AUC values and significantly outperformed serum AFP levels in predicting HBV-HCC (0.705 versus 0.531, P = .0034).
Table 5.
Results of plasma CCND1 promoter methylation in differentiating hepatitis B virus-associated hepatocellular carcinoma from chronic hepatitis B.

Figure 3.
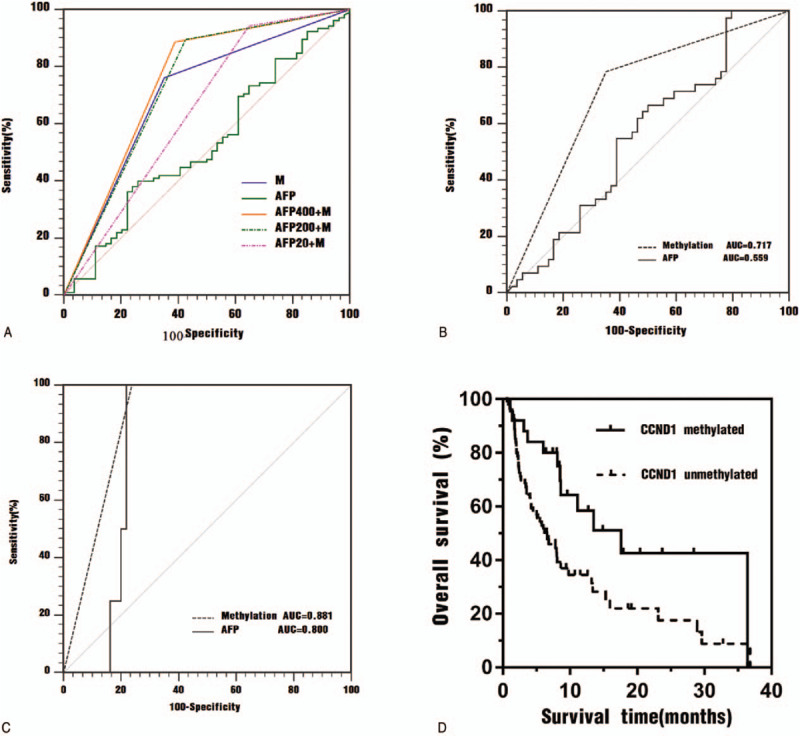
A. Receiver operating characteristic (ROC) curves for the ability of plasma biomarkers to differentiate patients with HBV-HCC from patients with CHB. M = plasma CCND1 promoter methylation, AFP = serum AFP level, AFP400 + M = serum AFP (cutoff value of 400 ng/ml) combined with plasma CCND1 promoter methylation, AFP200 + M = serum AFP (cutoff value of 200 ng/ml) combined with plasma CCND1 promoter methylation, AFP20 + M = serum AFP (cutoff value of 20 ng/mL) combined with plasma CCND1 promoter methylation. B. Receiver operating characteristic (ROC) curves for the ability of CCND1 promoter methylation and serum AFP to differentiate patients with AFP-negative HBV-HCC from patients with CHB. AUC = areas under the ROC curve. C. Receiver operating characteristic (ROC) curves for the ability of CCND1 promoter methylation and serum AFP levels to differentiate patients with AFP-positive CHB from patients with HBV-HCC. AUC = area under the ROC curve. D. Kaplan-Meier curves for patients with HBV-HCC stratified according to CCND1 methylation status.
When plasma CCND1 promoter methylation was combined with serum AFP levels in a synergistic manner, at an optimal diagnostic cutoff value for AFP of 400 ng/mL, an AUC of 0.748, sensitivity of 88.57%, and specificity of 61.11% were observed (Table 5, Figure 3A, P = .0003), suggesting that the combination improved the diagnostic performance compared to methylation or AFP levels alone. Using the cut-off value of serum AFP levels of 200ng/mL or 20 ng/mL, the combination of plasma CCND1 promoter methylation with serum AFP levels yielded a similar diagnostic performance for HBV-HCC, but it did not exceed the aforementioned performance (Table 5, Figure 3A).
3.5. Plasma CCND1 promoter methylation in the detection of AFP-negative HBV-HCC and AFP-positive CHB
We investigated the performance of plasma CCND1 promoter methylation in detecting AFP-negative HBV-HCC. Forty-two patients were diagnosed with AFP-negative HBV-HCC, 9 (21.43%) of whom presented the methylated CCND1 promoter. As shown in Figure 3B, a ROC analysis of plasma CCND1 promoter methylation in patients with AFP-negative HBV-HCC compared with patients with CHB elucidated a diagnostic value with an AUC of 0.717 (P = .0129). We subsequently assessed the potential of plasma CCND1 promoter methylation as a biomarker for the detection of AFP-positive CHB. Among the patients with CHB enrolled in this study, methylation of CCND1 promoter occurred in all 4 AFP-positive patients. In ROC curves plotting the methylation status of patients with AFP-positive CHB versus patients with HBV-HCC, the diagnostic parameter presented an AUC of 0.881 (0.805-0.935) compared with AUC 0.800 (0.713-0.871) for AFP levels (Figure 3C, P = .0375).
3.6. mRNA expression levels of CCND1 in PBMCs
We analyzed the expression levels of CCND1 mRNA in PBMCs by using reverse transcription-quantitative polymerase chain reaction. As expected from previous reports, the expression level of CCND1 mRNA increased in the HBV-HCC group compared with the CHB grou (Z = −4.946, P < .001) and HCs group (Z = −6.819, P < .001). Additionally, in the CHB group, the CCND1 mRNA level was substantially higher than the level in the HCs group (Z = −3.194, P = .001) (Figure 4A). Patients who were confirmed to present aberrant methylation in the HBV-HCC group showed overexpression of the CCND1 mRNA, compared with patients without aberrant methylation (Z = −2.268, P = .023) (Figure 4B). Moreover, in this study, a direct correlation between the CCND1 methylation status and its mRNA expression levels was identified in patients with HBV-HCC (rs = −0.213, P = .032).
We next sought to determine the connections between the expression of the CCND1 mRNA and clinicopathological characteristics (Figure 4C-N). For this comparison, easily and readily accessible variables were also assessed, namely, sex, age, vascular invasion or metastasis, tumor size, HBeAg (+/-), ALT levels, AST levels, TBIL levels, ALB levels, AFP levels, and TNM stage.
As shown in Figure 4F, the relative expression of the CCND1 mRNA was negatively correlated with the tumor size. However, the analysis including patients with HBV-HCC showed no clear separation of the relative expression of CCND1 mRNA and other factors at a level of P > .05.
3.7. The extent of oxidative injury and antioxidant capacity
Plasma MDA levels were increased in patients with HBV-HCC up 26.783 ± 11.174 ng/ml compared with those with patients with CHB (22.568 ± 8.839 ng/mL), or HCs (20.075 ± 9.128) (Figure 5A, P < .05). An exploratory analysis revealed increased plasma MDA levels in patients with HBV-HCC presenting an unmethylated CCND1 promoter (37.759 ± 13.448) compared to patients with HBV-HCC presenting a methylated promoter (23.964 ± 7.879) (Figure 5B, Z = -2.948, P = .003). The plasma SOD levels were significantly reduced in patients with CHB (2.053 ± 2.100ng/mL) and HCs (2.126 ± 0.780ng/mL) compared to patients with HBV-HCC (2.790 ± 1.447 ng/mL) (P < .001), and HCs did not present lower plasma SOD levels than patients with CHB (P = .105) (Figure 5C). Compared with patients with HBV-HCC, who presented with a methylated CCND1 promoter, patients who presented with an unmethylated CCND1 promoter displayed lower plasma SOD levels (Figure 5D, 3.619 ± 2.012ng/mL versus 2.557 ± 1.074 ng/ml, P = .016). Moreover, patients with HBV-HCC showed higher plasma 8-OHdG levels than patients with CHB or HCs (Figure 5E, 6.124 ± 2.144 ng/mL, 4.223 ± 2.537 ng/mL, 3.288 ± 3.843 ng/mL, respectively, P < .05). Another experiment confirmed these findings, in which plasma 8-OHdG levels were decreased to 4.507 ± 1.466ng/mL in patients with HBV-HCC with a methylated CCND1 promoter compared with 6.644 ± 2.048 ng/mL in patients with an unmethylated promoter (Figure 8F, P < .001). Based on these data, both the extent of oxidative injury and antioxidant capacity are substantially and significantly increased in patients with HBV-HCC.
Figure 5.
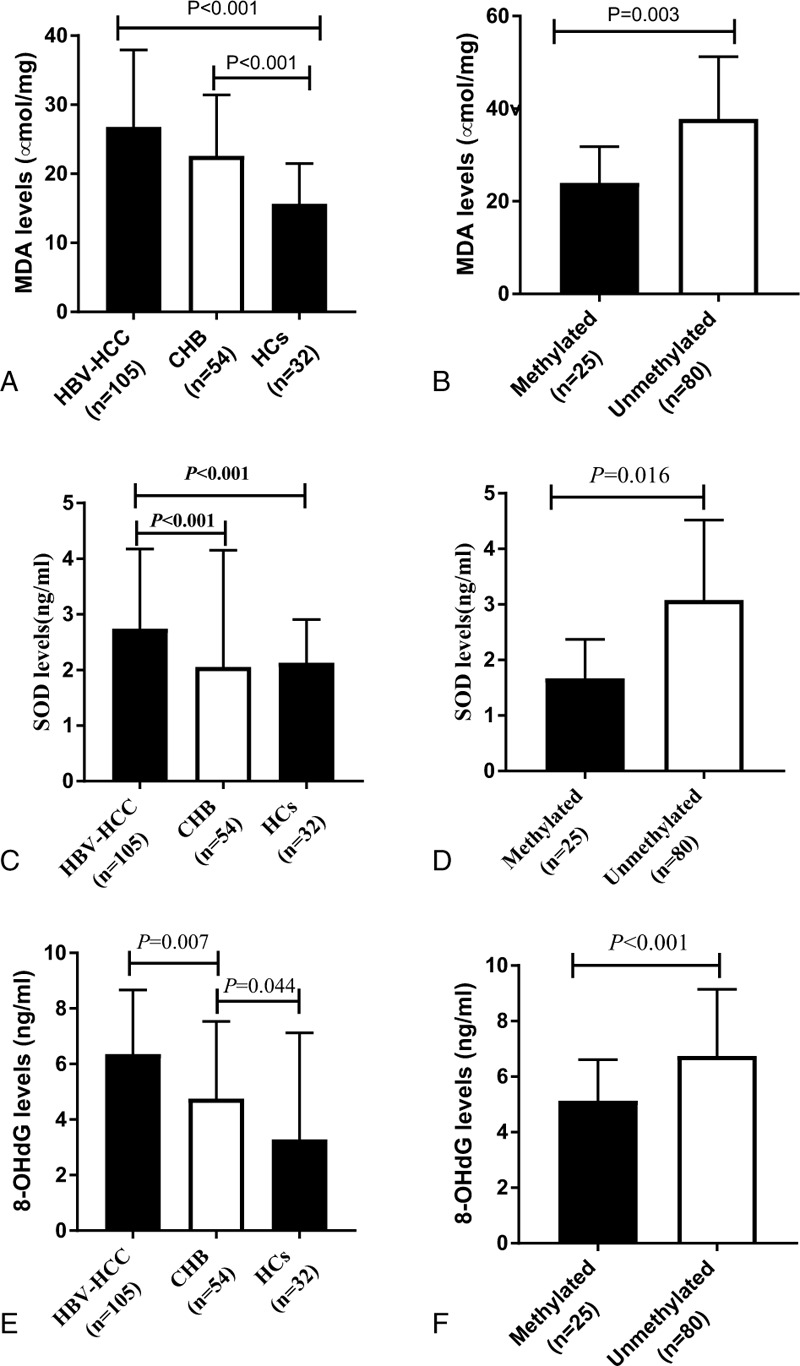
Oxidative stress parameters in patients with HBV-HCC. HBV- HCC = hepatitis B virus-associated hepatocellular carcinoma.
3.8. OS
Clinical follow-up was performed for all patients with HBV-HCC by the investigators, with a median of 6.8 months (25th-75th percentile: 2.6 months to 9.7 months). In the analysis of the Kaplan-Meier curves (Figure 3D), the CCND1 unmethylated group exhibited a worse OS than the CCND1 methylated group (P = .012, log-rank test). At the final observation, the median survival time was 6.567 months (SE, 1.425; 95% CI: 3.733-9.360) for the methylated group and 17.567 months (SE, 5.116; 95% CI: 7.539-27.594) for the unmethylated group.
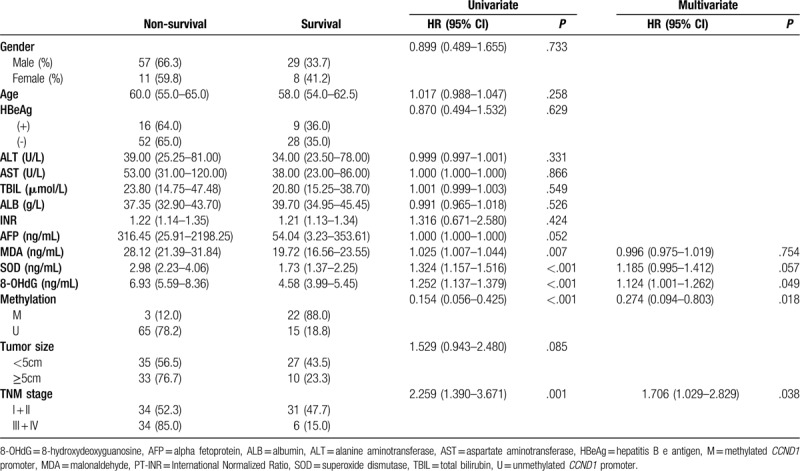
In the univariate analyses (Table 6), OS differed in patients stratified by TNM stage, serum MDA levels, serum SOD levels, serum 8-OHdG levels, and CCND1 methylation status (all P < .05). In the multivariate Cox regression analysis, OS was not affected by serum MDA and serum SOD levels. Instead, 3 independent predictors of a decreased OS were identified: serum 8-OHdG levels (HR = 1.124; 95%CI: 1.001-1.262), CCND1 methylation status (HR = 0.274; 95%CI: 0.094-0.803) and TNM stage (HR = 1.706; 95%CI: 1.029-2.829).
Table 6.
Prognosticators of overall survival: univariate and multivariate Cox proportional hazard regression analyses.
3.9. Progression-free survival (PFS)
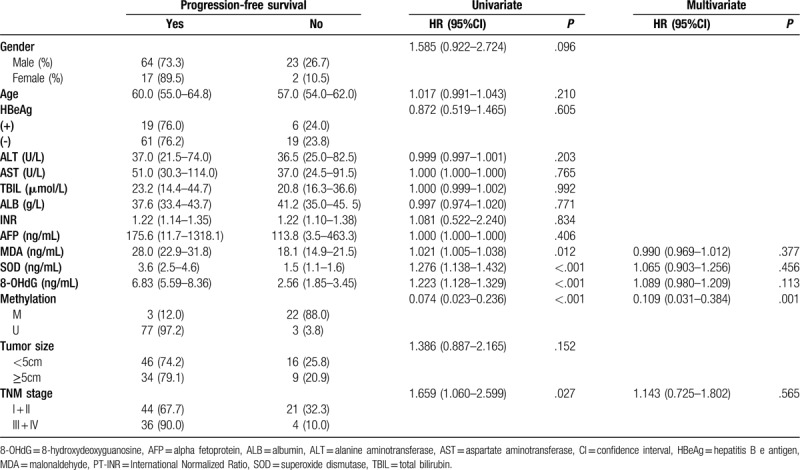
An additional secondary end point was PFS, based on researchers’ assessments and defined as the time from admission to the first progression, relapse, or death from any cause or last follow-up. A decrease in the CCND1 methylation frequency was strongly associated with a decreased PFS (HR = 0.109, 95% CI: 0.031-0.384), whereas the 3 oxidative stress related factors did not exert a significant effect on PFS, suggesting that other determinants may have masked the association between factors related to oxidative stress and PFS. Similarly, we did not observe other interactions between PFS and clinicopathological data (Table 7).
Table 7.
Prognosticators of progression-free survival: univariate and multivariate Cox proportional hazard regression analyses.
4. Discussion
In our present study, we demonstrated that the methylation of the CCND1 promoter exhibited better diagnostic performance than AFP levels in detecting HBV-HCC, particularly in AFP-negative HBV-HCC. Notably, the combination of CCND1 methylation and AFP levels increased the diagnostic accuracy compared to CCND1 methylation or AFP levels alone. We reported that both the extent of oxidative injury and antioxidant capacity are substantially increased in patients with HBV-HCC compared with CHB. Furthermore, the potential benefit of antioxidants including SOD in the treatment of cancer has been also reported.[30] These results strongly indicated that oxidative stress might involve in the development of HBV-HCC.
DNA methylation results in durable alterations in the expression of genes that regulate the tumor phenotype. The percentages of metastatic neoplasms and primary malignancies with hypomethylated DNA are lower than benign tumors or normal tissues,[31] which explains the involvement of the aberrant demethylation of DNA in cancers. Analogously, hypomethylation of long interspersed nucleotide element-1 (LINE-1) correlates with an increase in colon-specific mortality and overall mortality,[32] indicating that normally silenced genes are potentially reactivated via DNA hypomethylation. The understanding of the rationale underlying plasma CCND1 methylation in HBV-HCC comes the idea of pharmacologically relieving the active effects of CCND1 hypomethylation on gene expression. The origin of cell-free DNA CCND1 promoter hypomethylation is the important issue in the discussion. In fact, the cell-free DNA in plasma has been reported to be probably derived from apoptosis in neoplastic and/or white blood cells.[33,34] Hypomethylation of certain genes could be detected in the plasma DNA of patients with HCC,[35] and usually was associated with increased gene expression in peripheral blood.[36] In our present study, the CCND1 promoter hypomethylation status in cell-free DNA originating largely from tumor cells correlates with increased Cyclin D1 mRNA expression in PBMCs, which is in consistent with the previous reports.[37,38]
Because HBV-HCC is a prevalent but fatal disease, a prevalent biomarker shall improve the clinical management of HBV-HCC.[39] AFP is negative in more than one-third of HCC.[40] In adult patients with any type of hepatitis or liver cirrhosis, a moderate increase in AFP levels (ranging from 10 to 500ng/mL and occasionally up to 1000ng/ml) has also been observed. AFP levels ranging from 10 to 1000ng/mL, represent unknown territory, because the values of patients with benign liver diseases and even other malignant diseases are all within this range.[41,42] The present study also attempted to explore the potential diagnostic value of CCND1 promoter methylation in patients with AFP-negative HBV-HCC and patients with AFP-positive CHB. CCND1 promoter methylation displayed better diagnostic performance than serum AFP levels in both groups of patients, but the results must be further confirmed in a larger cohort due to the limited sample size.
Cyclin D1 has been reported to be implicated in carcinogenesis. The obvious increase in of Cyclin D1 levels in a variety of human tumor types supports the hypothesis that this protein plays a pivotal role in carcinogenesis.[43,44] Consistent with previous studies, we found that increased expression of the CCND1 mRNA was observed in patients with HBV-HCC compared with patients with CHB or HCs. Compared with patients with HBV-HCC presenting the unmethylated CCND1 promoter, patients with the methylated CCND1 promoter expressed higher levels of the CCND1 mRNA. Since CCND1 is commonly upregulated in various types of cancer. Its specificity for HCC remains a question, which needs to be confirmed in further research. Furthermore, the methylation patterns of other cyclins, CDKs and CKIs have also been reported to exert potential influences on the biomarker development of hepatocellular carcinoma. For example, the hypermethylation of the cyclin J (CCNJ) gene promoter was demonstrated to predict poor OS of HCC patients.[45] The hypermethylation of CDKL2 gene promoter and the downregulation of CDKL1 gene expression could be restored by 5-aza-2′-deoxycytidine in HCC cell lines.[11] In addition, the methylation for the inhibitor of cyclin-dependent kinase 4A (INK4A) gene promoter showed the potential value for the diagnosis and prognosis of HCC patienets.[46] Therefore, the network of methylation patterns for the family gene of cyclins might exert synergistic effects on the development of HCC.
The origins of hypomethylation of CCND1 gene promoter in HCC patients are mainly the following:
-
(1)
Ten-eleven translocation proteins iteratively oxidize 5-methylcytosine (5mC) to generates oxidized cytosine bases (5-hydroxymethylcytosine,5hmC; 5-formylcytosine, 5fC; 5-carboxycytosine, 5caC), and these cytosine analogs may facilitate DNA demethylation.[47] The expression level of Ten-eleven translocation enzyme 2 was decreased significantly in HCC.[48] Thereby it potentially causes increased oxidative injury and antioxidant capacity, eventually leads to hypomethylation of CCND1 promoter.
-
(2)
The second reason for CCND1 promoter hypomethylation was the decrease of DNMTs activity. DNA methylation is mediated by the de novo DNMT DNMT3A and DNMT3B, and maintained by DNMT1 during DNA replication.[49]
However, the expression of DNMT 1, DNMT3A and DNMT3B was up-regulated in the HCC samples compared with the paired non-HCC liver tissues.[50] However, the possible influence of DNMTs on the methylation of CCND1 need further study.
The strengths of our study include its simplicity, non-invasiveness, and low loss to follow-up. In addition, patient variables such as serum levels of ALT, AST, AFP, and so on. were retrieved from the patient data management system in a standardized manner. Due to the risk of rapid disease progression, an early diagnosis based on initial assessment that facilitates a timely decision for treatment would be a strength of this study.
The present study has several limitations. First, MSP is the method for qualitative analysis rather than quantitative analysis. Bisulfite sequencing PCR (BSP) and MethyLight would be helpful for the methylation status of multiple CpG loci.[51,52] Second, inherent limitations of the retrospective nature of the study should be considered. Third, the samples were only from 1 single unit, and the sample size was relatively small; thus, our results may not be generalized to population from other regions or races. Larger scale validation studies of patients with HBV-HCC are warranted and should encompass different geographies and ethnicities to determine the clinical diagnostic value of this biomarker. Fourth, we did not compare the methylation status of the CCND1 gene with others genes of the cyclins, cyclin-dependent kinases, and CDKIs. Fifth, the mechanism underlying the correlation between CCND1 promoter methylation and oxidative has not be studied. Therefore, these issues should be extensively resolved in the future. Sixth, the main aim of our present study was to investigate potential value of the cell-free CCND1 promoter methylation as the biomarker for the diagnosis of HCC. Therefore, we have selected the plasma of HCC patients and the plasma is the feasible tool of liquid biopsy in clinical application. The association of the CCND1 promoter methylation status in PBMCs and Cyclin D1 mRNA expression in PBMCs should be further studied. Finally, the CCND1 hypomethylation has been reported in other cancers including colorectal cancer and non-Hodgkin's lymphoma.[53,54] If hypomethylation is a global phenomenon in HBV-HCC and affects various tissues including PBMCs, the question of whether it is specific and affects selected set of genes or it is completely non-specific should be addressed. Looking at an independent marker that is not expected to be hypomethylated in cancer (such as any of the tumor suppressor genes including p21, p27, p53, RB1, and so on. or any other genes not associated with cancer) should help address this question.
In summary, plasma CCND1 promoter methylation is a promising non-invasive biomarker for the discrimination of HBV-HCC from the patients with CHB and healthy individuals.
Author contributions
Conceptualization: Kai Wang, Li-Yan Han, Yu-Chen Fan, and Hui-HuiLiu
Data curation: Yu Fang, Hui-Hui Liu, and Xiao-Dong Yuan
Formal analysis: Li-Yan Han, Jing-Wen Wang, and Hui-Hui Liu
Funding acquisition: Kai Wang, and Yu-Chen Fan
Methodology: Yu Fang, Jing-Wen Wang, and Hui-Hui Liu
Supervision: Kai Wang
Writing – original draft: Hui-Hui Liu and Xiao-Dong Yuan
Writing – review and editing: Kai Wang, Yu-Chen Fan and Shuai Gao
Footnotes
Abbreviations: 8-OHdG = 8-hydroxydeoxyguanosine, AFP = alpha-fetoprotein, ALB = albumin, ALT = alanine aminotransferase, AST = aspartate aminotransferase, AUC = area under the curve, CHB = chronic hepatitis B, DNMTs = DNA methyltransferases, ELISAs = enzyme-linked immunosorbent assays, HBsAg = hepatitis B surface antigen, HBV-HCC = hepatitis B virus-associated hepatocellular carcinoma, HR = hazard ratio, MDA = malondialdehyde, MSP = methylation-specific polymerase chain reaction, NPV = negative predictive value, OH = hydroxyl radical, OS = overall survival, PBMCs = peripheral blood mononuclear cells, PFS = progression-free survival, PPV = positive predictive value, PTA = prothrombin time activity, PT-INR = international normalized ratio of prothrombin time, ROC = receiver operating characteristic, ROS = reactive oxygen species, RT-qPCR = reverse transcription-quantitative polymerase chain reaction, SOD = superoxide dismutase, TBIL = total bilirubin.
How to cite this article: Liu HH, Fang Y, Wang JW, Yuan XD, Fan YC, Gao S, Han LY, Wang K. Hypomethylation of the cyclin D1 promoter in hepatitis B virus-associated hepatocellular carcinoma. Medicine. 2020;99:20(e20326).
This study was sponsored by the Key Project of the Chinese Ministry of Science and Technology (2017ZX10202202 and 2018ZX10302206), National Natural Science Foundation of China (81970522), the Key Research and Development Project of Shandong Province (2019GSF108023), Shandong University multidisciplinary research and innovation team of young scholars (2020QNQT11), and the Fundamental Research Funds of Shenzhen Research Institute of Shandong University (JCYJ20170818103059486).
The datasets generated during and/or analyzed during the current study are not publicly available, but are available from the corresponding author on reasonable request.
The authors have no conflicts of interest to disclose.
References
- [1].Bray F, Ferlay J, Soerjomataram I, et al. Global cancer statistics 2018: GLOBOCAN estimates of incidence and mortality worldwide for 36 cancers in 185 countries. CA Cancer J Clin 2018;68:394–424. [DOI] [PubMed] [Google Scholar]
- [2].Arzumanyan A, Reis HM, Feitelson MA. Pathogenic mechanisms in HBV- and HCV-associated hepatocellular carcinoma. Nat Rev Cancer 2013;13:123–35. [DOI] [PubMed] [Google Scholar]
- [3].Ding XF, He M, Chan AWH, et al. Genomic and epigenomic features of primary and recurrent hjepatocellular carcinomas. Gastroenterology 2019;157:1630–45. [DOI] [PubMed] [Google Scholar]
- [4].Lyko F. The DNA methyltransferase family: a versatile toolkit for epigenetic regulation. Nature reviews. Genetics 2018;19:81–92. [DOI] [PubMed] [Google Scholar]
- [5].Sonntag R, Giebeler N, Nevzorova YA, et al. Cyclin E1 and cyclin-dependent kinase 2 are critical for initiation, but not for progression of hepatocellular carcinoma. P Natl Acad Sci USA 2018;115:9282–7. [DOI] [PMC free article] [PubMed] [Google Scholar]
- [6].Wu SY, Lan SH, Wu SR, et al. Hepatocellular carcinoma-related cyclin D1 is selectively regulated by autophagy degradation system. Hepatology (Baltimore, Md) 2018;68:141–54. [DOI] [PMC free article] [PubMed] [Google Scholar]
- [7].Guo H, Jing L, Cheng YZ, et al. Down-regulation of the cyclin-dependent kinase inhibitor p57 is mediated by Jab1/Csn5 in hepatocarcinogenesis. Hepatology (Baltimore, Md) 2016;63:898–913. [DOI] [PubMed] [Google Scholar]
- [8].Lehmann U, Berg-Ribbe I, Wingen LU, et al. Distinct methylation patterns of benign and malignant liver tumors revealed by quantitative methylation profiling. Clin Cancer Res 2005;11:3654–60. [DOI] [PubMed] [Google Scholar]
- [9].Tsutsui M, Oizuka N, Moribe T, et al. Methylated cyclin D2 gene circulating in the blood as a prognosis predictor of hepatocellular carcinoma. Clin Chim Acta 2010;411:516–20. [DOI] [PubMed] [Google Scholar]
- [10].Yu J, Zhang HY, Ma ZZ, et al. Methylation profiling of twenty four genes and the concordant methylation behaviours of nineteen genes that may contribute to hepatocellular carcinogenesis. Cell Res 2003;13:319–33. [DOI] [PubMed] [Google Scholar]
- [11].Zhou Y, Qiu XP, Lia ZH, et al. Clinical significance of aberrant cyclin-dependent kinase-like 2 methylation in hepatocellular carcinoma. Gene 2019;683:35–40. [DOI] [PubMed] [Google Scholar]
- [12].Roncalli M, Bianchi P, Bruni B, et al. Methylation framework of cell cycle gene inhibitors in cirrhosis and associated hepatocellular carcinoma. Hepatology (Baltimore, Md) 2002;36:427–32. [DOI] [PubMed] [Google Scholar]
- [13].Massague J. G1 cell-cycle control and cancer. Nature 2004;432:298–306. [DOI] [PubMed] [Google Scholar]
- [14].Yuan M, Yuan J, Mei L, et al. Bioinformatics analysis of methylation in cervical adenocarcinoma in Xinjiang, China. Medicine 2018;97:e12108. [DOI] [PMC free article] [PubMed] [Google Scholar]
- [15].Lippman M, Osborne CK. Circulating tumor DNA--ready for prime time? N Engl J Med 2013;368:1249–50. [DOI] [PubMed] [Google Scholar]
- [16].Hardy T, Zeybel M, Day CP, et al. methylation: a potential biomarker for stratification of liver fibrosis in non-alcoholic fatty liver disease. Gut 2017;66:1321–8. [DOI] [PMC free article] [PubMed] [Google Scholar]
- [17].Fackler MJ, Lopez Bujanda Z, Umbricht C, et al. Novel methylated biomarkers and a robust assay to detect circulating tumor DNA in metastatic breast cancer. Cancer Res 2014;74:2160–70. [DOI] [PMC free article] [PubMed] [Google Scholar]
- [18].Koller CA, LoBuglio AF. Monocyte-mediated antibody-dependent cell-mediated cytotoxicity: the role of the metabolic burst. Blood 1981;58:293–9. [PubMed] [Google Scholar]
- [19].Hanahan D, Weinberg RA. Hallmarks of cancer: the next generation. Cell 2011;144:646–74. [DOI] [PubMed] [Google Scholar]
- [20].Lee D, Xu IM, Chiu DK, et al. Induction of oxidative stress via inhibition of thioredoxin reductase 1 is an effective therapeutic approach for hepatocellular carcinoma. Hepatology 2019;69:1768–86. [DOI] [PMC free article] [PubMed] [Google Scholar]
- [21].Szatrowski TP, Nathan CF. Production of large amounts of hydrogen peroxide by human tumor cells. Cancer Res 1991;51:794–8. [PubMed] [Google Scholar]
- [22].Xu IM, Lai RK, Lin SH, et al. Transketolase counteracts oxidative stress to drive cancer development. Proc Natl Acad Sci U S A 2016;113:E725–34. [DOI] [PMC free article] [PubMed] [Google Scholar]
- [23].Moy KA, Jiao L, Freedman ND, et al. Soluble receptor for advanced glycation end products and risk of liver cancer. Hepatology (Baltimore, Md) 2013;57:2338–45. [DOI] [PMC free article] [PubMed] [Google Scholar]
- [24].Li F, Fan YC, Gao S, et al. Methylation of serum insulin-like growth factor-binding protein 7 promoter in hepatitis B virus-associated hepatocellular carcinoma. Genes Chromosomes Cancer 2014;53:90–7. [DOI] [PubMed] [Google Scholar]
- [25].Weitzman SA, Turk PW, Milkowski DH, et al. Free radical adducts induce alterations in DNA cytosine methylation. Proc Natl Acad Sci U S A 1994;91:1261–4. [DOI] [PMC free article] [PubMed] [Google Scholar]
- [26].Marrero JA, Kulik LM, Sirlin CB, et al. Diagnosis, staging, and management of hepatocellular carcinoma: 2018 practice guidance by the American Association for the Study of Liver Diseases. Hepatology (Baltimore, Md) 2018;68:723–50. [DOI] [PubMed] [Google Scholar]
- [27].Maluccio M, Covey A. Recent progress in understanding, diagnosing, and treating hepatocellular carcinoma. CA Cancer J Clin 2012;62:394–9. [DOI] [PubMed] [Google Scholar]
- [28].Terrault NA, Lok ASF, McMahon BJ, et al. Update on prevention, diagnosis, and treatment of chronic hepatitis B: AASLD 2018 hepatitis B guidance. Hepatology (Baltimore, Md) 2018;67:1560–99. [DOI] [PMC free article] [PubMed] [Google Scholar]
- [29].Tian R, Wang J, Yan H, et al. Differential expression of miR16 in glioblastoma and glioblastoma stem cells: their correlation with proliferation, differentiation, metastasis and prognosis. Oncogene 2017;36:5861–73. [DOI] [PMC free article] [PubMed] [Google Scholar]
- [30].Sablina AA, Budanov AV, Ilyinskaya GV, et al. The antioxidant function of the p53 tumor suppressor. Nat Med 2005;11:1306–13. [DOI] [PMC free article] [PubMed] [Google Scholar]
- [31].Gama-Sosa MA, Slagel VA, Trewyn RW, et al. The 5-methylcytosine content of DNA from human tumors. Nucleic Acids Res 1983;11:6883–94. [DOI] [PMC free article] [PubMed] [Google Scholar]
- [32].Ogino S, Nosho K, Kirkner GJ, et al. A cohort study of tumoral LINE-1 hypomethylation and prognosis in colon cancer. J Natl Cancer Inst 2008;100:1734–8. [DOI] [PMC free article] [PubMed] [Google Scholar]
- [33].Giacona MB, Ruben GC, Iczkowski KA, et al. Cell-free DNA in human blood plasma: length measurements in patients with pancreatic cancer and healthy controls. Pancreas 1998;17:89–97. [DOI] [PubMed] [Google Scholar]
- [34].Mitchell SM, Ho T, Brown GS, et al. Evaluation of methylation biomarkers for detection of circulating tumor DNA and application to colorectal cancer. Genes-Basel 2016;7:125–35. [DOI] [PMC free article] [PubMed] [Google Scholar]
- [35].Chan KCA, Jiang PY, Chan CWM, et al. Noninvasive detection of cancer-associated genome-wide hypomethylation and copy number aberrations by plasma DNA bisulfite sequencing. P Natl Acad Sci USA 2013;110:18761–8. [DOI] [PMC free article] [PubMed] [Google Scholar]
- [36].Huang YH, Kuo HC, Li SC, et al. HAMP promoter hypomethylation and increased hepcidin levels as biomarkers for Kawasaki disease. J Mol Cell Cardiol 2018;117:82–7. [DOI] [PubMed] [Google Scholar]
- [37].Liao WT, You HL, Chai CY, et al. Cyclin D1 promoter -56 and -54 bp CpG un-methylation predicts invasive progression in arsenic-induced Bowen's disease. J Dermatol Sci 2018;89:191–7. [DOI] [PubMed] [Google Scholar]
- [38].Gertsch J, Guttinger M, Heilmann J, et al. Curcumin differentially modulates mRNA profiles in Jurkat T and human peripheral blood mononuclear cells. Bioorg Med Chem 2003;11:1057–63. [DOI] [PubMed] [Google Scholar]
- [39].Befeler AS, Di Bisceglie AM. Hepatocellular carcinoma: diagnosis and treatment. Gastroenterology 2002;122:1609–19. [DOI] [PubMed] [Google Scholar]
- [40].Ye X, Li C, Zu X, et al. A large-scale multicenter study validates Aldo-Keto Reductase family 1 Member B10 as a prevalent serum marker for detection of hepatocellular carcinoma. Hepatology 2019;69:2489–501. [DOI] [PMC free article] [PubMed] [Google Scholar]
- [41].Johnson PJ. The role of serum alpha-fetoprotein estimation in the diagnosis and management of hepatocellular carcinoma. Clin Liver Dis 2001;5:145–59. [DOI] [PubMed] [Google Scholar]
- [42].McIntire KR, Waldmann TA, Moertel CG, et al. Serum alpha-fetoprotein in patients with neoplasms of the gastrointestinal tract. Cancer Res 1975;35:991–6. [PubMed] [Google Scholar]
- [43].Arber N, Hibshoosh H, Moss SF, et al. Increased expression of cyclin D1 is an early event in multistage colorectal carcinogenesis. Gastroenterology 1996;110:669–74. [DOI] [PubMed] [Google Scholar]
- [44].Hunter T, Pines J. Cyclins and cancer. II: Cyclin D and CDK inhibitors come of age. Cell 1994;79:573–82. [DOI] [PubMed] [Google Scholar]
- [45].Takano N, Hishida M, Inokawa Y, et al. CCNJ detected by triple combination array analysis as a tumor-related gene of hepatocellular carcinoma. Int J Oncol 2015;46:1963–70. [DOI] [PubMed] [Google Scholar]
- [46].Huang GM, Krocker JD, Kirk JL, et al. Evaluation of INK4A promoter methylation using pyrosequencing and circulating cell-free DNA from patients with hepatocellular carcinoma. Clin Chem Lab Med 2014;52:899–909. [DOI] [PMC free article] [PubMed] [Google Scholar]
- [47].Wu H, Zhang Y. Reversing DNA methylation: mechanisms, genomics, and biological functions. Cell 2014;156:45–68. [DOI] [PMC free article] [PubMed] [Google Scholar]
- [48].Liu J, Jiang JH, Mo JZ, et al. Global DNA 5-hydroxymethylcytosine and 5-formylcytosine contents are decreased in the early stage of hepatocellular carcinoma. Hepatology (Baltimore, Md) 2019;69:196–208. [DOI] [PubMed] [Google Scholar]
- [49].Baubec T, Colombo DF, Wirbelauer C, et al. Genomic profiling of DNA methyltransferases reveals a role for DNMT3B in genic methylation. Nature 2015;520:243–78. [DOI] [PubMed] [Google Scholar]
- [50].Lin CH, Hsieh SY, Sheen IS, et al. Genome-wide hypomethylation in hepatocellular carcinogenesis. Cancer Res 2001;61:4238–43. [PubMed] [Google Scholar]
- [51].Ye YP, Jiao HL, Wang SY, et al. Hypermethylation of DMTN promotes the metastasis of colorectal cancer cells by regulating the actin cytoskeleton through Rac1 signaling activation. J Exp Clin Cancer Res 2018;37:299. [DOI] [PMC free article] [PubMed] [Google Scholar]
- [52].Chettouh H, Mowforth O, Galeano-Dalmau N, et al. Methylation panel is a diagnostic biomarker for Barrett's oesophagus in endoscopic biopsies and non-endoscopic cytology specimens. Gut 2018;67:1942–9. [DOI] [PMC free article] [PubMed] [Google Scholar]
- [53].Liu JW, Li H, Sun LP, et al. Aberrantly methylated-differentially expressed genes and pathways in colorectal cancer. Cancer Cell Int 2017;17. [DOI] [PMC free article] [PubMed] [Google Scholar]
- [54].Shi HD, Guo JY, Duff DJ, et al. Discovery of novel epigenetic markers in non-Hodgkin's lymphoma. Carcinogenesis 2007;28:60–70. [DOI] [PubMed] [Google Scholar]


