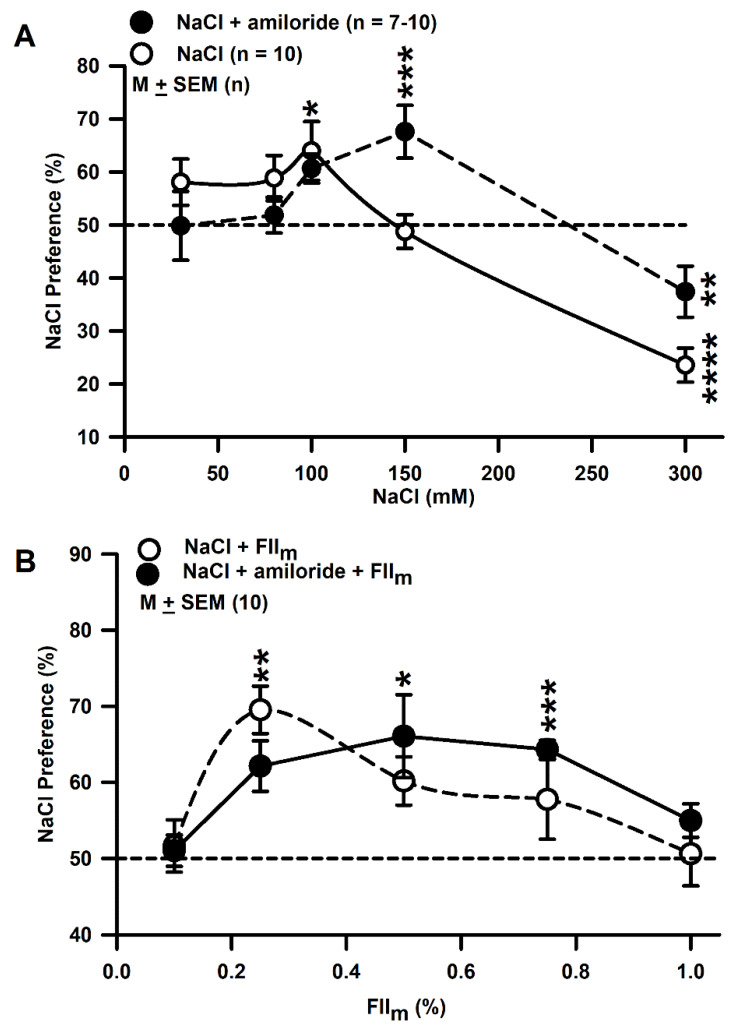
Figure 6.
Effect of amiloride and FIIm on NaCl Preference in WT mice. (A) Shows NaCl Preference in WT mice when given a choice between H2O and varying concentrations of NaCl (3, 80, 100, 120, 150, 200 and 300 mM) in the absence (○) and presence of 10 µM amiloride (●). The values are presented as mean (M) ± SEM of n, where n = 7–10. * p = 0.02; ** p = 0.0134; *** p = 0.0024; **** p = 0.0001. (B) Shows NaCl Preference in WT mice when given a choice between H2O and 100 mM NaCl (○) or H2O and 100 mM NaCl + 10 µM amiloride (●) containing increasing concentrations of FIIm (0.1 to 1%). * p = 0.0086; ** p = 0.0018; *** p = 0.0001 (n = 10). Dotted line represents the indifference value.

