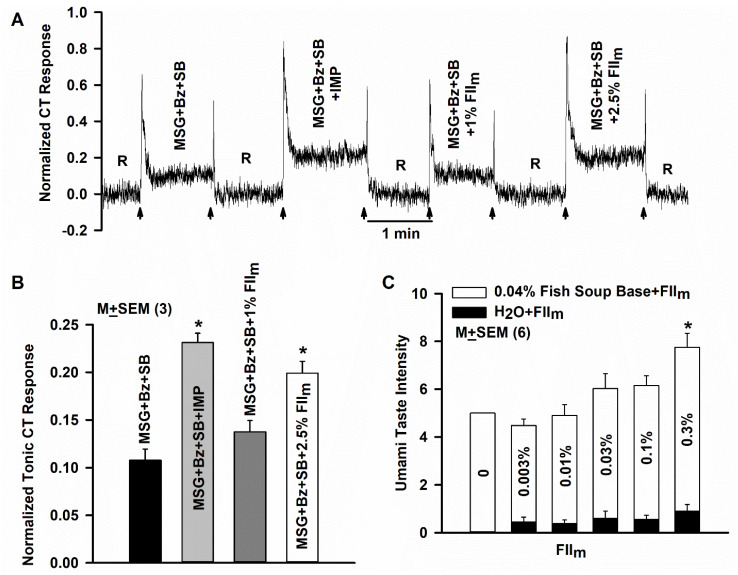
Figure 8.
Effect of FIIm on the glutamate chorda tympani (CT) response and human umami taste sensory evaluation. (A) Shows a representative CT response in which the rat tongue was first rinsed with the rinse solution (R) and then with 100 mM MSG + 5 µM benzamil (Bz) + 1 µM SB-366791 (SB), MSG + Bz + SB +1 mM IMP, MSG + Bz + SB + 1% FIIm and MSG + Bz + SB + 2.5% FIIm. The arrows represent the time period when the tongue was superfused with the rinse and stimulating solutions. (B) Shows mean normalized tonic CT responses from 3 rats. In each rat the data were normalized to the tonic response obtained with 0.3 M NH4Cl. * p = 0.001. (C) Shows the effect of adding increasing concentrations of FIIm (0.003 to 0.3%) to the 0.04% Fish Soup Base (open bars) or to H2O (filled bars). The values are presented as M ± SEM of n, where n represents the number of panel members tested. * p = 0.01.

