Supplemental Digital Content is available in the text
Keywords: esophageal cancer, integrated bioinformatics analysis, differentially expressed genes
Abstract
Background:
Esophageal cancer (ESCA) is one of the most deadly malignancies in the world. Although the management and treatment of patients with ESCA have improved, the overall 5-year survival rate is still very poor.
Methods:
The study aimed to identify potential key genes associated with the pathogenesis and prognosis of ESCA. In the study, integrated bioinformatics methods were used to screen differentially expressed genes (DEGs) between ESCA and normal tissue in the data set of gene expression profiles. The hub gene in DEGs was further analyzed by protein–protein interaction (PPI) network and survival analysis to explore its relationship with the pathogenesis and poor prognosis of ESCA.
Results:
134 up-regulated genes and 183 down-regulated genes were obtained in ESCA compared with normal tissues. Moreover, the PPI network was established with 176 nodes and 800 interactions. Ten hub genes (AURKA, CDC20, BUB1, TOP2A, ASPM, DLGAP5, TPX2, CENPF, UBE2C, and NEK2) were filtered out based on the degree value. Functional enrichment analysis indicated that a variety of extracellular related items and ECM–receptor interaction pathway were all correlated with the ESCA.
Conclusions:
The results of this study would provide some guidance for further study of diagnostic and prognostic biomarkers to promote ESCA treatment.
1. Introduction
Esophageal cancer (ESCA) ranks seventh in terms of incidence and sixth in mortality overall.[1] The incidence of ESCA varies from region to region, with Eastern Asia having the highest incidence and China was referred to as the “esophageal cancer belt”.[2] There are 2 common histological subtypes of ESCA, which are esophageal squamous cell carcinoma (ESCC) and esophageal adenocarcinoma (EA).[3] The pathogenesis of ESCA is still unclear, but heavy drinking, smoking, poor nutritional status, low intake of fruits and vegetables, drinking high-temperature drinks, chewing betel nut, gastroesophageal reflux disease, overweight, and obesity can all be the cause of ESCA.[4,5,6,7] ESCA is one of the most deadly malignant tumors in the world. Although the management and treatment of patients with ESCA have improved, the overall 5-year survival rate is still very poor. Its 5-year survival rate is about 15% to 25%. The best results are related to early diagnosis, commonly referred to as “early stage”, however, ESCA patients are often diagnosed in the advanced stage, mainly due to the lack of early clinical symptoms.[8,9] In recent years, in order to improve the survival rate of patients with ESCA, multimodal neoadjuvant concurrent chemoradiotherapy (CCRT) has become more and more widely used in therapy.[10,11] After receiving CCRT, the 5-year overall survival rate and recurrence survival rate of patients with ESCA were higher, however, not all patients with ESCA could respond to neoadjuvant radiotherapy and chemotherapy. According to reports, about 60% of patients have no response to neoadjuvant chemoradiation, reducing the success rate of surgery.[12,13] Identifying susceptible genes and biomarkers can help predict a patient's response to treatment while improving patient survival. Therefore, more genetic information remains urgently needed to provide reference for precision medical treatment.[14] Recently, cancer microarrays and high-throughput sequencing technologies have been frequently used to explore common biomarkers associated with cancer, as well as drugs that are directly used in cancer treatment, diagnosis, and prognosis, revealing key genetic or epigenetic variations in tumorigenesis.[15,16] He[17] performed an informatic analysis of EA chip data in the GEO database to find relevant key genes and pathways; Zhang[18] used bioinformatics to analyze esophageal squamous cell carcinoma and found that 5 genes such as SPP1 are closely related to the pathogenesis and prognosis of ESCC. In this study, we tried to detect new indicators of poor prognosis in ESCA patients through integrated bioinformatics methods, and endeavor to provide potential therapeutic targets for this challenging disease.
In this study, we selected 5 microarray datasets published in the GEO database to identify differentially expressed genes (DEGs) between ESCA tissues and normal tissues. Later, further functional enrichment analysis was performed on DEGs to find the main biological functions of their regulation. In addition, hub genes affecting the pathogenesis and prognosis of ESCA patients were identified by using protein–protein interaction (PPI) networks and survival analysis. The detailed workflow of the study is shown in Figure 1.
Figure 1.
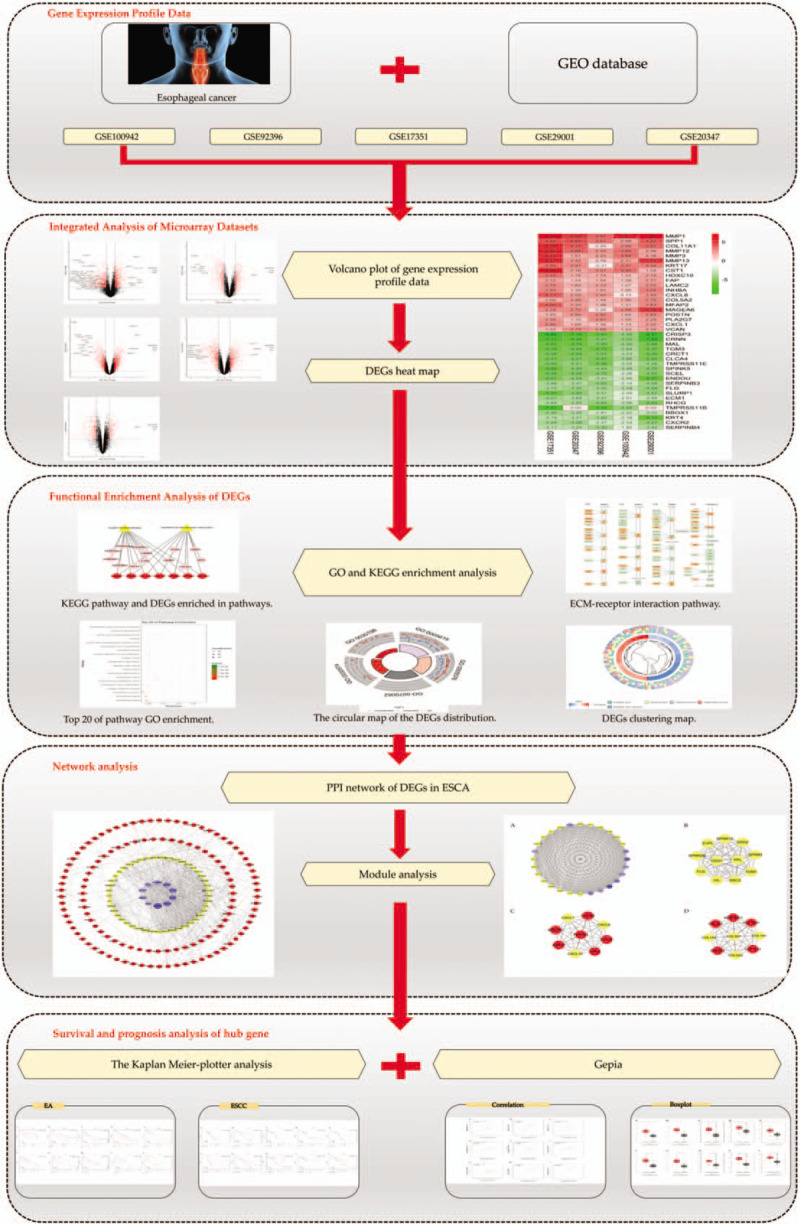
Workflow for identification of hub genes and pathways for ESCA.
2. Materials and methods
2.1. Gene expression profile data
The gene expression profile datasets (GSE17351, GSE20347, GSE29001, GSE92396, GSE100942) were obtained from Gene Expression Omnibus (GEO, http://www.ncbi.nlm.nih.gov/geo/).[19] All included datasets met the following criteria:
-
1)
they employed tissue samples gathered from human esophageal cancer and corresponding adjacent or normal tissues;
-
2)
they included at least 10 samples.
2.2. Integrated analysis of microarray datasets
The matrix data of each GEO data set is normalized and log2 converted using the Limma[20] software package in the R software, and the DEG in each microarray is also filtered by the Limma software package. Gene integration of DEGs identified from 5 data sets was performed using RobustRankAggreg.[21] |log 2FC| ≥ 1 and adjust P value < .05 were considered statistically significant for the DEGs.
2.3. GO functional and KEGG pathway enrichment analysis
To illustrate the role of DEGs in gene function and signaling pathways, this study used the DAVID v 6.8[22] (https://david.ncifcrf.gov/) database to perform gene ontology (GO) functional enrichment analysis and Kyoto Encyclopedia of Genes and Genomes (KEGG) pathway enrichment analysis. The results of the GO functional enrichment analysis were visualized via OmicShare platform (http://www.omicshare.com/. Accessed 19 July 2018) and GOplot[23] software package in the R software.
2.4. PPI network and module analysis
Search Tool for the Retrieval of Interacting Genes/Proteins (STRING) 10.5(https://string-db.org/) is a database of known and predicted protein interactions that contains the direct and indirect association of proteins. The number and quality of interacting proteins can be set according to their confidence settings and it has a score for each protein interaction information. The higher the score, the higher the confidence of the protein interaction.[24] The confidence score was set no less than 0.7 in this study.
After this, the genes were introduced into Cytoscape 3.5.1 (http://www.cytoscape.org/)[25] to obtain PPI network map. MCODE app in Cytoscape was used for cluster analysis, with the degree cutoff = 2, node score cutoff = 0.2 and K-Core = 2 were set as the advanced options.
2.5. Survival analysis of hub genes
Kaplan Meier-plotter (KM plotter, http://kmplot.com/analysis/) is an online tool for further understanding the molecular basis of disease and identifying biomarkers associated with survival. This tool is suitable for real-time meta-analysis of published cancer microarray datasets to identify survival-related biomarkers.[26,27]
2.6. Expression level analysis and correlation analysis of the hub genes
The Gene Expression Profiling Interactive Analysis (GEPIA) (http://gepia.cancer-pku.cn/index.html) is a web server that provides analysis of different tumor types or pathological stages, differential expression analysis of tumor/normal tissues, survival analysis, correlation analysis, and principal component analysis. It contains 9736 tumor samples and 8587 normal tissue samples covering 33 malignancies. Among them, we used 182 esophageal cancer tissue samples and 256 normal tissue samples to study the difference in expression of the same genes in ESCA and normal tissues.[28]
3. Results
3.1. Gene expression profile data
In this study, we have adopted a total of 5 datasets including 60 cancer tissues and 61 normal tissues (Table 1). After analysis, we obtained 134 up-regulated genes and 183 down-regulated genes in ESCA compared with normal tissues (Supplementary file 1). Figure 2 shows the top 20 down- and up-regulated genes in the integrated microarray analysis.
Table 1.
Information for the 5 GEO datasets included in the current study.

Figure 2.
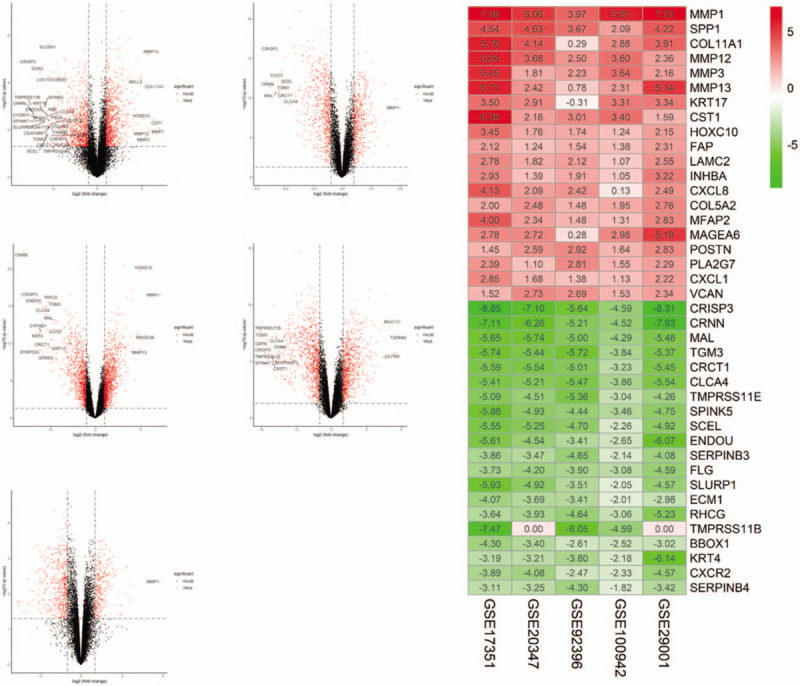
Volcano plot of gene expression profile data in ESCA samples and normal ones and heat map of differentially expressed gene (DEGs). (A) Volcano plot of GSE17351. (B) Volcano plot of GSE20347. (C) Volcano plot of GSE29001. (D) Volcano plot of GSE92396. (E) Volcano plot of GSE100942. (F) Heat map of differentially expressed genes. Green represents a lower expression level, red represents higher expression levels, and white represents that there is no different expression amongst the genes. Each column represents one dataset and each row represents 1 gene. The number in each rectangle represents the normalized gene expression level. The gradual color ranged from green to red represents the changing process from down-regulation to up-regulation.
3.2. Functional enrichment analysis of DEGs
DEGs were put into David for GO and KEGG functional enrichment analysis. The functional enrichment analysis results were shown in Figure 3. According to KEGG pathway enrichment analysis, the DEGs were mainly involved in Amoebiasis and ECM–receptor interaction pathway (Fig. 4). Likewise, in GO functional enrichment analysis, 21 GO entries satisfy FDR and P values both less than .05, most of which are biological processes, followed by molecular functions and cellular components. The first 20 entries are extracellular space, extracellular region, extracellular exosome, collagen catabolic process, extracellular matrix organization, proteinaceous extracellular matrix, extracellular matrix, keratinocyte differentiation, keratinization, peptide cross-linking, collagen fibril organization, collagen trimer, cornified envelope, positive regulation of cell proliferation, serine-type endopeptidase inhibitor activity, extracellular matrix disassembly, midbody, serine-type endopeptidase activity, epidermis development, and extracellular matrix structural constituent.
Figure 3.
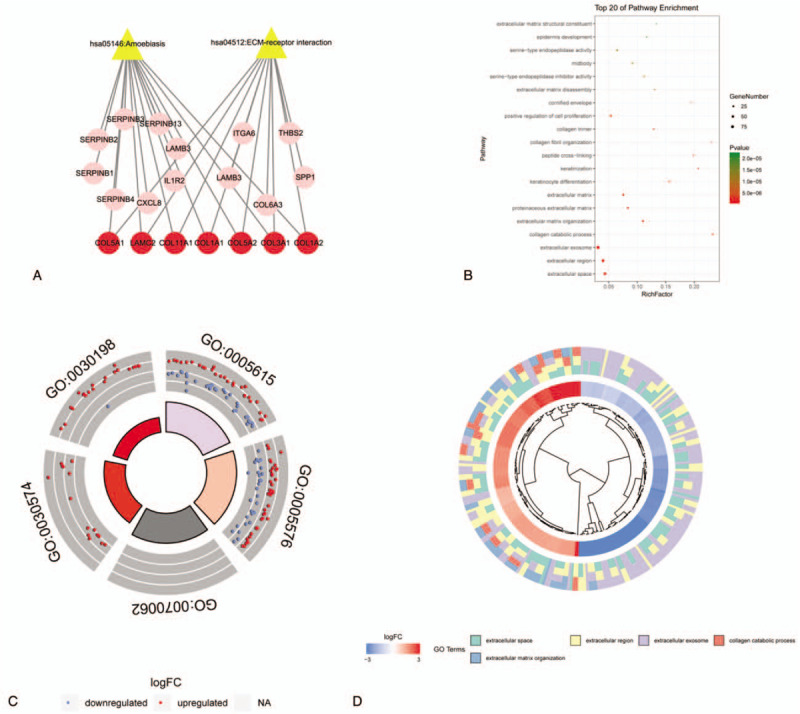
Graph of the functional enrichment analysis results. (A) KEGG pathway and DEGs enriched in pathways. The yellow triangle represents the KEGG pathways. The red dots are the common DEGs enriched in the 2 pathways, and the pink dots represent the other DEGs enriched in the pathways. (B) Top 20 of pathway GO enrichment. (C) The circular map of the DEGs distribution of the top 5 GO pathway. The red indicates the up-regulated gene and the blue indicates the down-regulated gene. (D) DEGs clustering map of the first 5 GO pathways. In the figure, from the inside to the outside are gene clustering, |log 2FC| and GO pathway.
Figure 4.
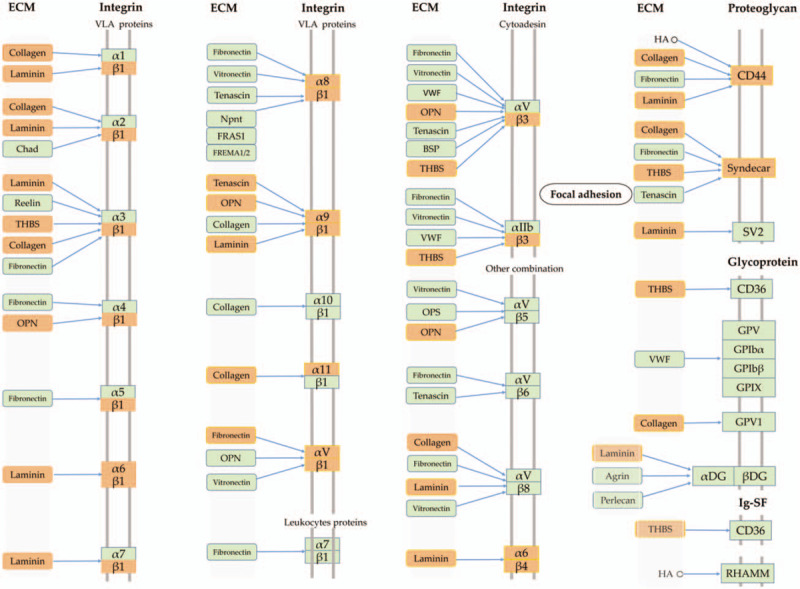
Graph of the ECM–receptor interaction pathway (17). The orange nodes show the DEGs in the pathway and the green nodes indicate other genes.
3.3. PPI network analysis and module analysis
The PPI network was constructed in the STRING 10.5 database including 176 nodes and 800 interactions. As shown in Figure 5, the size of the nodes was proportional to the degree value. The top 10 genes with the greater degree were considered to be hub genes. Besides, in order to detect important cluster modules in this PPI network, we performed module analysis and obtained the first 4 modules of high scores (Fig. 6). Module 1 has the highest number of nodes, edges, and scores, and may be the main functional module.
Figure 5.
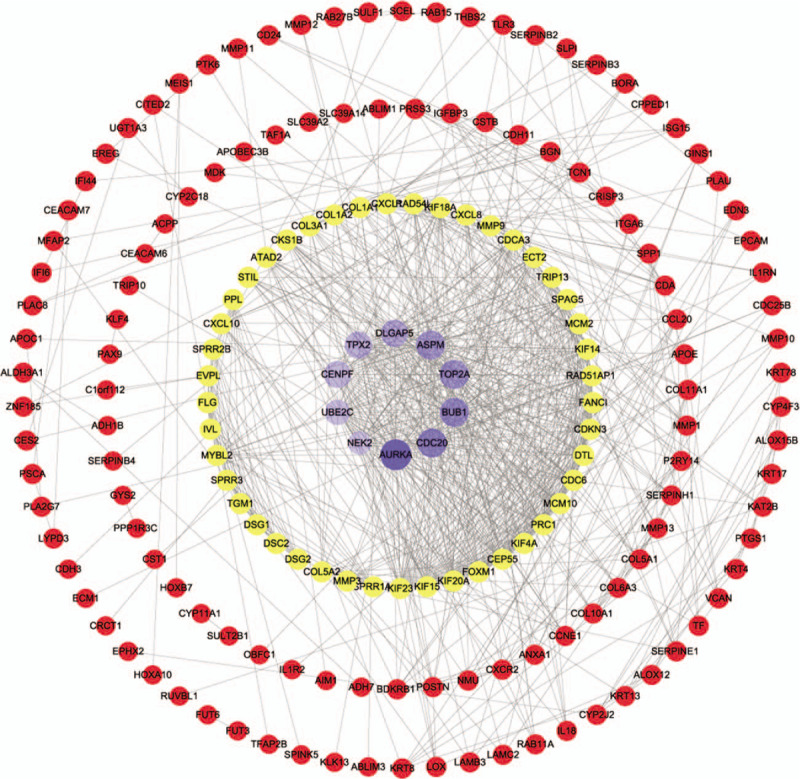
PPI network of DEGs in ESCA. Purple represents the hub genes in DEGs, and the depth of the color and size of the nodes are proportional to the degree value. Yellow dot represents the gene which degree value is greater than average and red represents other genes.
Figure 6.
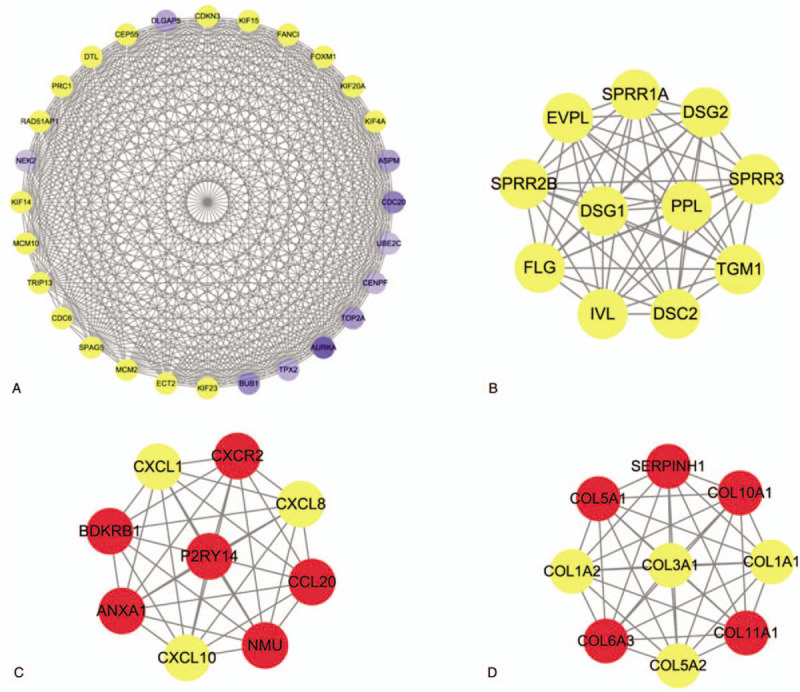
Four significant modules identified from the PPI network. (A) Module 1 contained 28 nodes and 355 interactions, MCODE score = 26; (B) module 2 contained 11 nodes and 55 sides, MCODE score = 11; (C) module 3 contained 9 nodes and 36 interactions, MCODE, score = 9; (D) module 4 contained 9 nodes and 36 interactions, MCODE, score = 9.
3.4. The Kaplan Meier-plotter and expression level of hub genes correlation and correlated analysis
The Kaplan Meier-plotter was adopted to analyze the prognostic information of 10 hub genes in which ESCA were divided into EA and ESCC. It was found that the high expression of AURKA (HR = 2.75 (1.15–6.59), P = .018), BUB1 (HR = 2.01 (1.02–3.94), P = .038), DLGAP5 (HR = 2.24 (1.17–4.26), P = .012), TPX2 (HR = 2.78 (1.44–5.36), P = .0015), UBE2C (HR = 3.73, (1.78–7.81), P = 2e−04), and NEK2 (HR = 2.76 (1.07–7.15), P = .029) were associated with the worse overall survival(OS) of for EA patients (Fig. 7), as well as the high expression of AURKA (HR = 0.32 (0.13–0.82), P = .013), BUB1 (HR = 0.35 (0.15–0.81), P = .011), TOP2A (HR = 0.31 (0.11–0.86), P = .018), ASPM (HR = 0.35 (0.15–0.84), P = .014), DLGAP5 (HR = 0.23 (0.1–0.53), P = .00019), TPX2 (HR = 0.33 (0.14–0.79), P = .0094), CENPF (HR = 0.41 (0.18–0.95), P = .031), and NEK2(HR = 0.4 (0.18–0.92), P = .025) were relevant to the worse OS for the ESCC patients (Fig. 8). Furthermore, GEPIA was devoted to analyze the different expression of hub genes in cancer tissues and normal tissues and 10 hub genes were definitely highly expressed in ESCA cancer tissues (Fig. 9). Moreover, the correlation between hub genes was analyzed by GEPIA. The results showed that remaining 9 hub genes were strongly associated with AURKA in the expression of ESCA cells (Fig. 10).
Figure 7.
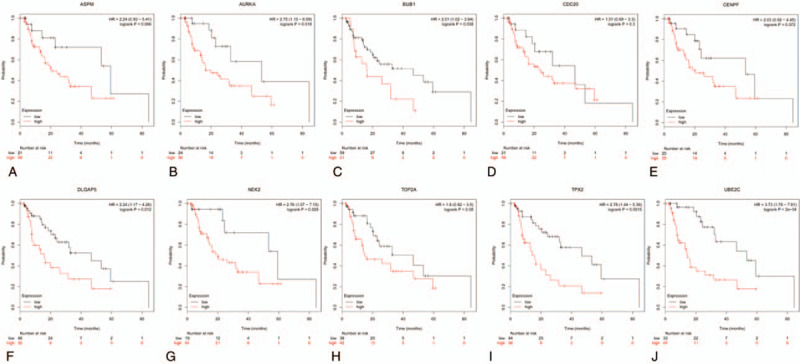
Prognostic roles of 10 hub genes in the EA patients. Survival curves are plotted for EA cancer patients. (A) ASPM; (B) AURKA; (C) BUB1; (D) CDC20; (E) CENPF; (F) DLGAP5; (G) NEK2; (H) TOP2A; (I) TPX2; and (J) UBE2C.
Figure 8.
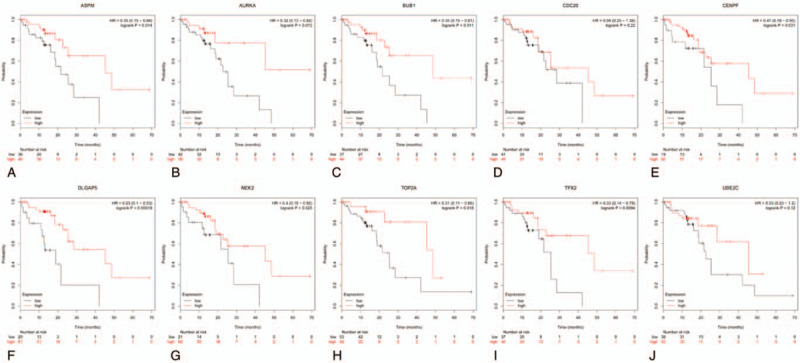
Prognostic roles of 10 hub genes in the ESCC patients. Survival curves are plotted for ESCC cancer patients. (A) ASPM; (B) AURKA; (C) BUB1; (D) CDC20; (E) CENPF; (F) DLGAP5; (G) NEK2; (H) TOP2A; (I) TPX2; and (J) UBE2C.
Figure 9.
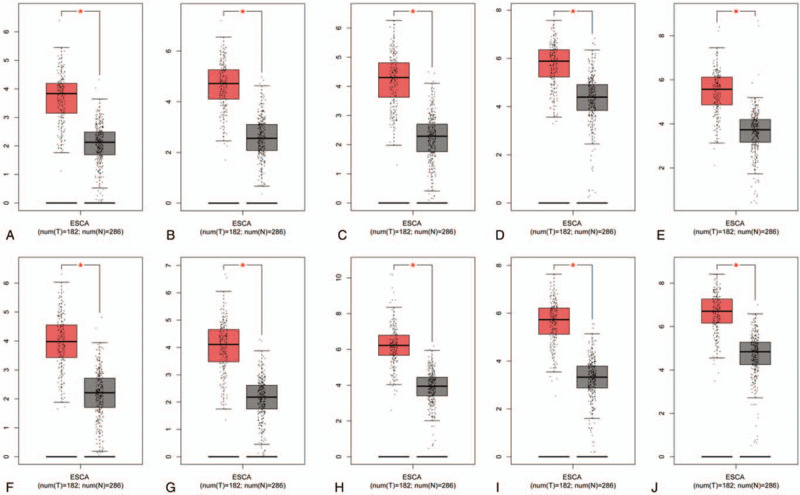
Analysis of 10 hub genes expression level in human ESCA. The red and gray boxes represent cancer and normal tissues, respectively. (A) ASPM; (B) AURKA; (C) BUB1; (D) CDC20; (E) CENPF; (F) DLGAP5; (G) NEK2; (H) TOP2A; (I) TPX2; and (J) UBE2C.
Figure 10.
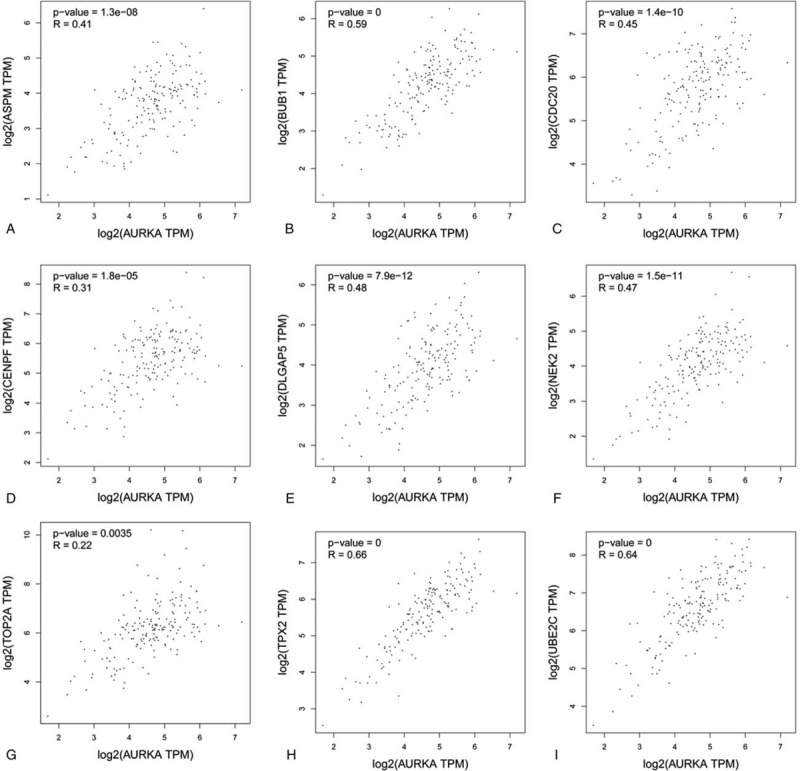
Correlation analysis of 9 hub genes and AURKA in ESCA. (A) AURKA; (B) BUB1; (C) CDC20; (D) CENPF; (E) DLGAP5; (F) NEK2; (G) TOP2A; (H) TPX2; and (I) UBE2C.
4. Discussion
ESCA is one of the most serious malignant gastrointestinal tumors, although recent advances in multimodal treatment have shown promise in reducing morbidity and improving survival, this is not enough.[29] Therefore, understanding the pathogenesis of ESCA is crucial to improve survival and reduce morbidity. The rapid development of microarray technology, making breakthroughs in identifying cancer marker genes, and strengthening disease prognosis.[30]
In the present study, a total of 317 DEGs were screened, consisting of 134 up-regulated genes and 183 down-regulated genes. Most of these DEGs were enriched in pathways closely relevant to cancer, such as extracellular space, extracellular region, extracellular exosome, and ECM–receptor interaction pathway. Among all DEGs, the top 10 in the degree value were the hub genes. Additionally, all hub genes were up-regulated in ESCA cancer tissues compared with normal tissues and closely related to the first hub gene AURKA.
Aurora kinase A (AURKA) – is a serine/threonine kinase that is essential for normal mitotic spindle formation and centrosome maturation as well as separation during cell division. When an abnormality occurs in AURKA, it often leads to the functional defect of the centrosome in mitosis and the disorder of the bipolar spindle, which conduces to the asymmetric separation of chromosomes during division, induces chromosomal instability, forms aneuploidy, and causes abnormal mutations in cells. At the same time, it begins to transform cancer and form a tumor.[31,32,33] The AURKA gene is clearly overexpressed in several types of cancer, including ESCA.[34] It is worth noting that AURKA overexpression is significantly associated with advanced cancer and poor prognosis.[35] Besides, a variety of AURKA inhibitors have been developed for the treatment of cancers of the digestive system.[32] CDC20 (cell division cycle 20 homologue) is overexpressed in quantities of human tumors and also is currently a potential target for the treatment of multiple cancers. It mainly regulates cell cycle progression, and cells with CDC20 mutants block cell division and stop the progression of the cell cycle to late and chromosome separation.[36] BuB1 is the only Mad1 centromere receptor in yeast, which contributes to the localization of Mad1, thereby loading MAD1 and MAD2 onto CDC20, catalyzing the formation of mitotic checkpoint complex (MCC).[37] As with MAD2, overexpression of BUB1 could be a consequence of loss of normal protein functioning.[38] Topoisomerase IIα (TOP2A) is a gene-encoding enzyme involved in DNA replication and correlates with the response of anthracyclines to various cancers.[39] Its overexpression is common in a diversity of cancers including ESCA. Besides, TOP2A inhibitors have been used in a variety of solid tumors such as small cell lung cancer.[40,41] ASPM regulates the duration of mitosis and passage through the G1 restriction point and it also shows overexpression in a range of cancers.[42,43] It has been experimentally proven that knocking down ASPM can inhibit tumor growth and lead to apoptosis.[44] Disc large (Drosophila) homolog-associated protein 5 (DLGAP5) is a mitotic spindle protein that promotes the formation of tubulin polymers, resulting in tubulin fragments around the ends of microtubules. DLGAP5 contains the guanylate kinase-associated protein (GKAP) domain, which is conserved among various species.[45] In addition, the involvement of DLGAP5 in the formation and development of cancer affects cell migration, invasion, and adhesion ratio, suggesting that the gene and its products may be potential therapeutic targets.[46] TPX2 acts as a microtubule-associated protein (MAP) to control the nucleation, function, and interaction of microtubules with other cellular structures. Studies have shown that improper expression of TPX2 leads to chromosomal instability, resulting in centrosome expansion and development into aneuploidy which is highly correlated with the occurrence and development of various tumors.[47,48] As a downstream regulatory gene of MMP13, CENPF plays an important role in cell cycle, mitosis, and regulation of PLK1 activity in G2/M transition.[49] Furthermore, different kinds of experiments have confirmed that the high expression of CEPNF is a prognostic indicator of survival and metastasis in ESCA patients.[50,51] Recently, the ubiquitin-conjugating enzyme E2C (UBE2C), a prominent tumor biomarker candidate, is considered to be a key player in the cell cycle progression. And by qRT-PCR analysis and immunohistochemical analysis, UBE2C protein was up-regulated in ESCA tissues.[52] Never in mitosis (NIMA)-associated kinase 2 (NEK2) plays a key role in the regulation of mitosis. Due to its abnormal overexpression and malignant transformation in a variety of human cancers it has become a key target for the treatment of cancer.[53]
In enrichment analysis, GO enrichment analysis revealed that a series of extracellular related items were closely associated with ESCA. The interaction of multiple genes with the extracellular matrix combined with poor signaling can also enhance the metastasis of ESCA cells.[54] Exosomes is an important component of the tumor microenvironment and plays a complex role in the progression and treatment of ESCA.[55] On the other hand, in KEGG enrichment analysis, ECM–receptor interaction pathway affects cellular activities such as adhesion, migration, differentiation, proliferation, and apoptosis.[56] There have also been related RNA array studies in the early stage to confirm the correlation between ECM–receptor interaction pathway and ESCA.[57,58]
The limitations of our study were as follows: Firstly, our research is based on the data already in the database and research results need to be verified by corresponding experimental studies. For example, chemistry experiments comparing expression in ESCA tissues and normal tissues, should be conducted to confirm the target genes and potential key functional enrich pathway. Secondly, we obtained data in the GEO database, the sample size is small and its quality cannot be verified. Finally, our study has some limitations because it focuses on genes that are typically identified as significant changes in multiple data sets, without regard to gender, age, tumor classification, and staging.
5. Conclusion
In conclusion, we have identified a total of 10 hub genes associated with the development and poor prognosis of ESCA in this integrated bioinformatics analysis. However, since our research is based on data analysis, further experiments are needed to confirm. At the same time, we hope that our research results can have certain guiding significance for the future prognosis and treatment of ESCA.
Author contributions
ZW and WJR conceived and designed the study. JSS, MZQ, and ZXM collected the data. LXK, LSY, GSY, and NMW performed the data analysis, and ZW and ZJY wrote the manuscript. All authors were responsible for reviewing data. All authors read and approved the final manuscript.
Supplementary Material
Footnotes
Abbreviations: CCRT = multimodal neoadjuvant concurrent chemoradiotherapy, DEGs = differentially expressed genes, EA = esophageal adenocarcinoma, ESCA = esophageal cancer, ESCC = esophageal squamous cell carcinoma, GEPIA = The Gene Expression Profiling Interactive Analysis, GO = gene ontology, KEGG = Kyoto Encyclopedia of Genes and Genomes, PPI = protein–protein interaction.
How to cite this article: Zhou W, Wu J, Liu X, Ni M, Meng Z, Liu S, Jia S, Zhang J, Guo S, Zhang X. Identification of crucial genes correlated with esophageal cancer by integrated high-throughput data analysis. Medicine. 2020;99:20(e20340).
The study was financially supported by National Natural Science Foundation of China (Grant Nos. 81473547 and 81673829) and Young Scientists Training Program of Beijing University of Chinese Medicine.
The current analysis does not require ethical approval, because our integrated bioinformatics analysis only collects uploaded data information from the GEO database search. The program does not process any patient's personal data and will not cause any patient hurt.
The authors have no conflicts of interest to disclose.
Supplemental Digital Content is available for this article.
All data generated or analyzed during this study are included in this published article [and its supplementary information files].
References
- [1].Bray F, Ferlay J, Soerjomataram I, et al. Global cancer statistics 2018: GLOBOCAN estimates of incidence and mortality worldwide for 36 cancers in 185 countries. CA Cancer J Clin 2018;68:394–424. [DOI] [PubMed] [Google Scholar]
- [2].Torre LA, Bray F, Siegel RL, et al. Global cancer statistics, 2012. CA Cancer J Clin 2015;65:87–108. [DOI] [PubMed] [Google Scholar]
- [3].Arnold M, Laversanne M, Brown LM, et al. Predicting the future burden of esophageal cancer by histological subtype: international trends in incidence up to 2030. Am J Gastroenterol 2017;112:1247–55. [DOI] [PubMed] [Google Scholar]
- [4].McCormack VA, Menya D, Munishi MO, et al. Informing etiologic research priorities for squamous cell esophageal cancer in Africa: a review of setting-specific exposures to known and putative risk factors. Int J Cancer 2017;140:259–71. [DOI] [PMC free article] [PubMed] [Google Scholar]
- [5].Toh Y, Oki E, Ohgaki K, et al. Alcohol drinking, cigarette smoking, and the development of squamous cell carcinoma of the esophagus: molecular mechanisms of carcinogenesis. Int J Clin Oncol 2010;15:135–44. [DOI] [PubMed] [Google Scholar]
- [6].Lagergren J, Bergstrom R, Lindgren A, et al. Symptomatic gastroesophageal reflux as a risk factor for esophageal adenocarcinoma. N Engl J Med 1999;340:825–31. [DOI] [PubMed] [Google Scholar]
- [7].Post PN, Siersema PD, Van Dekken H. Rising incidence of clinically evident Barrett's oesophagus in The Netherlands: a nation-wide registry of pathology reports. Scand J Gastroenterol 2003;42:17–22. [DOI] [PubMed] [Google Scholar]
- [8].Pennathur A, Gibson MK, Jobe BA, et al. Oesophagealcarcinoma. Lancet 2013;381:400–12. [DOI] [PubMed] [Google Scholar]
- [9].Arnal MJD, Arenas ÁF, Arbeloa ÁL. Esophageal cancer: risk factors, screening and endoscopic treatment in Western and Eastern countries. World J Gastroenterol 2015;21:7933. [DOI] [PMC free article] [PubMed] [Google Scholar]
- [10].Merkow RP, Bilimoria KY, McCarter MD, et al. Use of multimodality neoadjuvant therapy for esophageal cancer in the United States: assessment of 987 hospitals. Ann Surg Oncol 2012;19:357–64. [DOI] [PubMed] [Google Scholar]
- [11].van Hagen P, Hulshof MC, van Lanschot JJ, et al. Preoperative chemoradiotherapy for esophageal or junctional cancer. N Engl J Med 2015;366:2074–84. [DOI] [PubMed] [Google Scholar]
- [12].Allum WH, Stenning SP, Bancewicz J, et al. Long-term results of a randomized trial of surgery with or without preoperative chemotherapy in esophageal cancer. J Clin Oncol 2009;27:5062–7. [DOI] [PubMed] [Google Scholar]
- [13].Skinner HD, Lee JH, Bhutani MS, et al. A validated miRNA profile predicts response to therapy in esophageal adenocarcinoma. Cancer 2014;120:3635–41. [DOI] [PMC free article] [PubMed] [Google Scholar]
- [14].Bibby BA, Reynolds JV, Maher SG. MicroRNA-330-5p as a putative modulator of neoadjuvant chemoradiotherapy sensitivity in oesophageal adenocarcinoma. PLoS One 2015;10:e0134180. [DOI] [PMC free article] [PubMed] [Google Scholar]
- [15].Liu X, Wu J, Zhang D, et al. Identification of potential key genes associated with the pathogenesis and prognosis of gastric cancer based on integrated bioinformatics analysis. Front Genet 2018;9:265. [DOI] [PMC free article] [PubMed] [Google Scholar]
- [16].Ni M, Liu X, Wu J, et al. Identification of candidate biomarkers correlated with the pathogenesis and prognosis of non-small cell lung cancer via integrated bioinformatics analysis. Front Genet 2018;9:469. [DOI] [PMC free article] [PubMed] [Google Scholar]
- [17].Feng H, Bo A, Lei T. Identification of genes and pathways in esophageal adenocarcinoma using bioinformatics analysis. Biomed Rep 2018;9:305–12. [DOI] [PMC free article] [PubMed] [Google Scholar]
- [18].Zhang H, Zhong J, Tu Y, et al. Integrated bioinformatics analysis identifies hub genes associated with the pathogenesis and prognosis of esophageal squamous cell carcinoma. Biomed Res Int 2019;2019:2615921. [DOI] [PMC free article] [PubMed] [Google Scholar]
- [19].Clough E, Barrett T. The gene expression omnibus database. Methods Mol Biol 2016;1418:93–110. [DOI] [PMC free article] [PubMed] [Google Scholar]
- [20].Ritchie ME, Phipson B, Wu D, et al. Limma powers differential expression analyses for RNA-sequencing and microarray studies. Nucleic Acids Res 2015;43:e47. [DOI] [PMC free article] [PubMed] [Google Scholar]
- [21].Kolde R, Laur S, Adler P, et al. Robust rank aggregation for gene list integration and meta-analysis. Bioinformatics 2012;28:573–80. [DOI] [PMC free article] [PubMed] [Google Scholar]
- [22].Dennis G, Jr, Sherman BT, Hosack DA, et al. DAVID: database for annotation, visualization, and integrated discovery. Genome Biol 2003;4:P3. [PubMed] [Google Scholar]
- [23].Walter W, Sánchez-Cabo F, Ricote M. GOplot: an R package for visually combining expression data with functional analysis. Bioinformatics 2015;31:2912–4. [DOI] [PubMed] [Google Scholar]
- [24].Szklarczyk D, Morris JH, Cook H, et al. The STRING database in 2017: quality-controlled protein–protein association networks, made broadly accessible. Nucleic Acids Res 2017;45:D362–8. [DOI] [PMC free article] [PubMed] [Google Scholar]
- [25].Franz M, Lopes CT, Huck G, et al. Cytoscape.js: a graph theory library for visualisation and analysis. Bioinformatics 2016;32:309–11. [DOI] [PMC free article] [PubMed] [Google Scholar]
- [26].Lacny S, Wilson T, Clement F, et al. Kaplan–Meier survival analysis overestimates cumulative incidence of health-related events in competing risk settings: a meta-analysis. J Clin Epidemiol 2018;93:25–35. [DOI] [PubMed] [Google Scholar]
- [27].Győrffy B, Surowiak P, Budczies J, et al. Online survival analysis software to assess the prognostic value of biomarkers using transcriptomic data in non-small-cell lung cancer. PloS One 2013;8:e82241. [DOI] [PMC free article] [PubMed] [Google Scholar]
- [28].Tang Z, Li C, Kang B, et al. GEPIA: a web server for cancer and normal gene expression profiling and interactive analyses. Nucleic Acids Res 2017;45:W98–102. [DOI] [PMC free article] [PubMed] [Google Scholar]
- [29].Sohda M, Kuwano H. Current status and future prospects for esophageal cancer treatment. Ann Thorac Cardiovasc Surg 2017;23:1–1. [DOI] [PMC free article] [PubMed] [Google Scholar]
- [30].Xu Z, Zhou Y, Cao Y, et al. Identification of candidate biomarkers and analysis of prognostic values in ovarian cancer by integrated bioinformatics analysis. Med Oncol 2016;33:130. [DOI] [PubMed] [Google Scholar]
- [31].Barr AR, Gergely F. Aurora-A: the maker and breaker of spindle poles. J Cell Sci 2007;120:2987–96. [DOI] [PubMed] [Google Scholar]
- [32].Belkhiri A, El-Rifai W. Advances in targeted therapies and new promising targets in esophageal cancer. Oncotarget 2015;6:1348. [DOI] [PMC free article] [PubMed] [Google Scholar]
- [33].Honda K, Mihara H, Kato Y, et al. Degradation of human Aurora2 protein kinase by the anaphase-promoting complex-ubiquitin-proteasome pathway. Oncogene 2000;19:2812. [DOI] [PubMed] [Google Scholar]
- [34].Tong T, Zhong Y, Kong J, et al. Overexpression of Aurora-A contributes to malignant development of human esophageal squamous cell carcinoma. Clin Cancer Res 2004;10:7304–10. [DOI] [PubMed] [Google Scholar]
- [35].Jeng YM, Peng SY, Lin CY, et al. Overexpression and amplification of Aurora-A in hepatocellular carcinoma. Clin Cancer Res 2004;10:2065–71. [DOI] [PubMed] [Google Scholar]
- [36].Wang L, Zhang J, Wan L, et al. Targeting Cdc20 as a novel cancer therapeutic strategy. Pharmacol Ther 2015;151:141–51. [DOI] [PMC free article] [PubMed] [Google Scholar]
- [37].Zhang G, Kruse T, Guasch Boldú C, et al. Efficient mitotic checkpoint signaling depends on integrated activities of Bub1 and the RZZ complex. EMBO J 2019;38:e100977. [DOI] [PMC free article] [PubMed] [Google Scholar]
- [38].Doak SH, Jenkins GJ, Parry EM, et al. Differential expression of the MAD2, BUB1 and HSP27 genes in Barrett's oesophagus-their association with aneuploidy and neoplastic progression. Mutat Res 2004;547:133–44. [DOI] [PubMed] [Google Scholar]
- [39].Purim O, Beny A, Inbar M, et al. Biomarker-driven therapy in metastatic gastric and esophageal cancer: real-life clinical experience. Target Oncol 2018;13:1–0. [DOI] [PMC free article] [PubMed] [Google Scholar]
- [40].Akagi T, Ito T, Kato M, et al. Chromosomal abnormalities and novel disease-related regions in progression from Barrett's esophagus to esophageal adenocarcinoma. Int J Cancer 2009;125:2349–59. [DOI] [PMC free article] [PubMed] [Google Scholar]
- [41].Yu Y, Ding S, Liang Y, et al. Expression of ERCC1, TYMS, TUBB3, RRM1 and TOP2A in patients with esophageal squamous cell carcinoma: a hierarchical clustering analysis. Exp Ther Med 2014;7:1578–82. [DOI] [PMC free article] [PubMed] [Google Scholar]
- [42].Capecchi MR, Pozner A. ASPM regulates symmetric stem cell division by tuning cyclin E ubiquitination. Nat Commun 2015;6:8763. [DOI] [PMC free article] [PubMed] [Google Scholar]
- [43].Tang J, Lu M, Cui Q, et al. Overexpression of ASPM, CDC20, and TTK confer a poorer prognosis in breast cancer identified by gene co-expression network analysis. Front Oncol 2019;9:310. [DOI] [PMC free article] [PubMed] [Google Scholar]
- [44].Bikeye SN, Colin C, Marie Y, et al. ASPM associated stem cell proliferation is involved in malignant progression of gliomas and constitutes an attractive therapeutic target. Cancer Cell Int 2010;10:1. [DOI] [PMC free article] [PubMed] [Google Scholar]
- [45].Shi YX, Yin JY, Shen Y, et al. Genome-scale analysis identifies NEK2, DLGAP5 and ECT2 as promising diagnostic and prognostic biomarkers in human lung cancer. Sci Rep 2017;7:8072. [DOI] [PMC free article] [PubMed] [Google Scholar]
- [46].Liao W, Liu W, Yuan Q, et al. Silencing of DLGAP5 by siRNA significantly inhibits the proliferation and invasion of hepatocellular carcinoma cells. PLoS One 2013;8:e80789. [DOI] [PMC free article] [PubMed] [Google Scholar]
- [47].Wang S, Chen Y, Chai Y. Prognostic role of targeting protein for Xklp2 in solid tumors: a PRISMA-compliant systematic review and meta-analysis. Medicine 2018;97:e13018. [DOI] [PMC free article] [PubMed] [Google Scholar]
- [48].Aguirre-Portoles C, Bird AW, Hyman A, et al. Tpx2 controls spindle integrity, genome stability, and tumor development. Cancer Res 2012;72:1518–28. [DOI] [PubMed] [Google Scholar]
- [49].Yang X, Miao BS, Wei CY, et al. Lymphoid-specific helicase promotes the growth and invasion of hepatocellular carcinoma by transcriptional regulation of centromere protein F expression. Cancer Sci 2019;110:2133–44. [DOI] [PMC free article] [PubMed] [Google Scholar]
- [50].Osako Y, Seki N, Kita Y, et al. Regulation of MMP13 by antitumor microRNA-375 markedly inhibits cancer cell migration and invasion in esophageal squamous cell carcinoma. Int J Oncol 2016;49:2255–64. [DOI] [PMC free article] [PubMed] [Google Scholar]
- [51].Aytes A, Mitrofanova A, Lefebvre C, et al. Cross-species regulatory network analysis identifies a synergistic interaction between FOXM1 and CENPF that drives prostate cancer malignancy. Cancer Cell 2014;25:638–51. [DOI] [PMC free article] [PubMed] [Google Scholar]
- [52].Palumbo A, Jr, Da Costa NM, De Martino M, et al. UBE2C is overexpressed in ESCC tissues and its abrogation attenuates the malignant phenotype of ESCC cell lines. Oncotarget 2016;7:65876. [DOI] [PMC free article] [PubMed] [Google Scholar]
- [53].Fang Y, Zhang X. Targeting NEK2 as a promising therapeutic approach for cancer treatment. Cell Cycle 2016;15:895–907. [DOI] [PMC free article] [PubMed] [Google Scholar]
- [54].Luo ML, Zhou Z, Sun L, et al. An ADAM12 and FAK positive feedback loop amplifies the interaction signal of tumor cells with extracellular matrix to promote esophageal cancer metastasis. Cancer Lett 2018;422:118–28. [DOI] [PubMed] [Google Scholar]
- [55].Su LL, Chang XJ, Zhou HD, et al. Exosomes in esophageal cancer: a review on tumorigenesis, diagnosis and therapeutic potential. World J Clin Cases 2019;7:908. [DOI] [PMC free article] [PubMed] [Google Scholar]
- [56].Kim SH, Turnbull J, Guimond S. Extracellular matrix and cell signalling: the dynamic cooperation of integrin, proteoglycan and growth factor receptor. J Endocrinol 2011;209:139–51. [DOI] [PubMed] [Google Scholar]
- [57].Wu W, Bhagat TD, Yang X, et al. Hypomethylation of noncoding DNA regions and overexpression of the long noncoding RNA, AFAP1-AS1, in Barrett's esophagus and esophageal adenocarcinoma. Gastroenterology 2013;144:956–66. [DOI] [PMC free article] [PubMed] [Google Scholar]
- [58].Li Y, Shi X, Yang W, et al. Transcriptome profiling of lncRNA and co-expression networks in esophageal squamous cell carcinoma by RNA sequencing. Tumour Biol 2016;37:13091–100. [DOI] [PubMed] [Google Scholar]
Associated Data
This section collects any data citations, data availability statements, or supplementary materials included in this article.


