

Abstract
Mutations in DEP domain containing 5 (DEPDC5) are increasingly appreciated as one of the most common causes of inherited focal epilepsy. Epilepsies due to DEPDC5 mutations are often associated with brain malformations, tend to be drug-resistant, and have been linked to an increased risk of sudden unexplained death in epilepsy (SUDEP). Generation of epilepsy models to define mechanisms of epileptogenesis remains vital for future therapies. Here, we describe a novel mouse model of Depdc5 deficiency with a severe epilepsy phenotype, generated by conditional deletion of Depdc5 in dorsal telencephalic neuroprogenitor cells. In contrast to control and heterozygous mice, Depdc5-Emx1-Cre conditional knockout (CKO) mice demonstrated macrocephaly, spontaneous seizures and premature death. Consistent with increased mTORC1 activation, targeted neurons were enlarged and both neurons and astrocytes demonstrated increased S6 phosphorylation. Electrophysiologic characterization of miniature inhibitory post-synaptic currents in excitatory neurons was consistent with impaired post-synaptic response to GABAergic input, suggesting a potential mechanism for neuronal hyperexcitability. mTORC1 inhibition with rapamycin significantly improved survival of CKO animals and prevented observed seizures, including for up to 40 days following rapamycin withdrawal. These data not only support a primary role for mTORC1 hyperactivation in epilepsy following homozygous loss of Depdc5, but also suggest a developmental window for treatment which may have a durable benefit for some time even after withdrawal.
Introduction
Mutations in DEP domain containing 5 (DEPDC5) (HGNC#18423; OMIM#614191) are a significant cause of focal epilepsies and brain malformations (1–9). Patients with epilepsy due to DEPDC5 mutation are also at increased risk of sudden unexpected death in epilepsy (SUDEP) (10, 11). The link to SUDEP combined with the drug-resistant nature of DEPDC5-related epilepsies underscores the importance of identifying treatment strategies for patients with epilepsies due to DEPDC5 mutations. Most anti-epileptic drugs act as modulators of various ion channels to attenuate seizure activity. However, DEPDC5 is unique in that it is one of the few epilepsy-associated genes that does not code for an ion channel or channel modulator, suggesting that new treatment paradigms, such as signaling pathway modulation, may be warranted.
DEPDC5 is one of three members of the GATOR1 complex, along with NPRL2 and NPRL3. The GATOR1 complex acts to inhibit RagA/B-mediated recruitment of mTORC1 to the lysosomal membrane during times of nutrient deprivation, thereby preventing its activation and phosphorylation of downstream targets (12). Dysregulation of mTOR signaling is linked to epilepsy as well as other neurodevelopmental diseases, including malformations of cortical development (13, 14). Modulation of mTORC1 signaling is used clinically to treat patients with mTORopathies with initial pre-clinical evidence suggesting that mTORC1 modulation may be useful in cases of DEPDC5-related epilepsies (15).
To discover and effectively test new epilepsy therapeutics, a pre-clinical Depdc5-related epilepsy mouse model is essential. Homozygous germline loss of Depdc5 is embryonic lethal in mice and rats (16, 17). Germline heterozygosity does not result in seizures in mice or rats, though it does lead to mTORC1 hyperactivation in the brain and cytomegalic neurons in rats (16, 17). Two models of in utero electroporation have been created to generate biallelic inactivation of Depdc5 in the brains of mice, leading to areas resembling focal cortical dysplasia (18, 19). These mice demonstrated increased pS6 expression, cytomegalic neurons and abnormal cortical lamination (19). Thirty percent of the Ribierre et al. (18) mice demonstrated focal seizures, while the Dawson et al. (19) mice had a decreased seizure threshold in response to pentylenetetrazol (PTZ) but no spontaneous seizures. Thus, while both are novel models for Depdc5-related epilepsies with brain malformations, they are somewhat limited in the robustness of their epilepsy phenotypes. Another mouse model with neuron-specific Depdc5 conditional knockout (CKO) was generated using Cre recombinase driven by the Syn1 promoter, beginning at embryonic day 12–13 (20). The Syn1-CKO mice that survive until adulthood and have seizures starting after 100 days of life. We hypothesized that an earlier CKO of Depdc5 in neural progenitors would result in an earlier onset of seizures to allow for therapeutic testing at an earlier age. We based our model generation on a prior mouse model of tuberous sclerosis complex (TSC) generated by our laboratory, in which the Emx1 promoter was used to drive Cre-recombinase expression beginning at embryonic day 10 (21). The Emx1-lineage gives rise to excitatory neurons in the cerebral cortex as well as a subset of glial cells, including certain astrocytes and some oligodendrocytes (22, 23). Like DEPDC5-related epilepsies, TSC is also a disease of dysregulated mTOR signaling. In the case of the Emx1-Tsc1 CKO model, deleting Tsc1 in embryonic neural progenitor cells resulted in spontaneous seizures beginning at an early age (P13–P20). Thus, to create a mouse model of DEPDC5-related epilepsy with a severe epilepsy phenotype in which early therapeutic interventions could be tested, we generated a CKO mouse with deletion of Depdc5 in the Emx1-expressing embryonic dorsal telencephalic neuroepithelium. The targeting of glial cells in addition to projection neurons was an additional advantage of the Emx1-Cre driver because it allowed us to also investigate the consequences of Depdc5 loss in this glial subset.
Depdc5-Emx1-Cre-CKO mice have a greatly reduced lifespan with terminal seizures, display evidence of mTORC1 hyperactivation in both neurons and astrocytes, and demonstrate dysplastic cortical neurons with an altered response to GABAergic input. These results suggest that an altered response to inhibitory neuronal inputs may be a feature of DEPDC5-related epilepsies and also raise the possibility of a role for glial cells in contributing to disease pathogenesis. Postnatal treatment with rapamycin prolonged lifespan and prevented observed seizures, even for weeks after its withdrawal. We thus present a novel Depdc5 CKO mouse model with early development of epilepsy and seizure-associated death that will be useful for testing additional therapeutic strategies.
Results
Generation of Depdc5-Emx1-Cre CKO transgenic mice
To develop an epileptic Depdc5 mouse model and determine the consequences of CKO of Depdc5, we targeted cortical neuroprogenitor cells using mice expressing Emx1-Cre (22, 23) crossed to mice with a floxed alleles of Depdc5 (Fig. 1A and B). Depdc5Emx1 homozygous CKO mice (henceforth Depdc5Emx1 CKO) mice are viable and born at the expected Mendelian ratio (Table 1). The very early postnatal development of Depdc5Emx1 CKO mice was similar to control and heterozygous mice. After postnatal day (P) day 15 of life, CKO mice lost body weight but continued to demonstrate enlargement of brain size, resulting in a significant increase in both the absolute brain size and in the brain-to-body ratio (Fig. 1C). The gross and relative enlargement of brain size is consistent with that seen in other mouse models with mTORC1 hyperactivation (14, 24–26).
Figure 1.
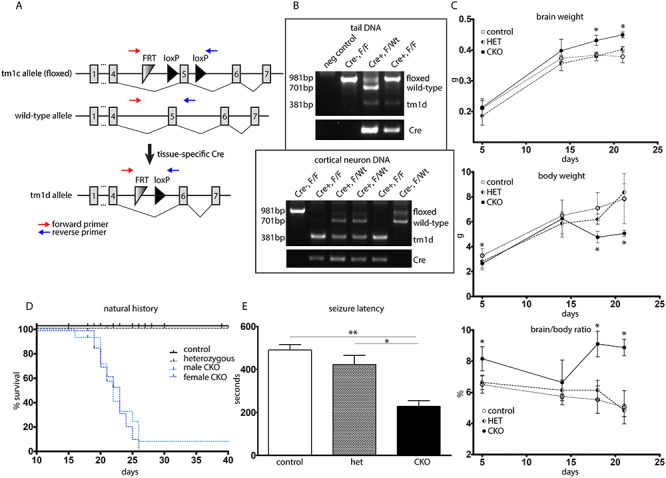
Depdc5Emx1 CKO mice display changes in gross brain/body weight and demonstrate both seizures and reduced survival. (A) Schematic demonstrating targeting of the Depdc5 allele. Genotyping primers are indicated by red arrows. (B) Representative genotyping of tail DNA as well as DNA from primary neuronal cultures. Wt mice show a 701 bp band, while conditional mice (F) show a larger 981 bp band due to inclusion of the FRT and LoxP sites. Mice with a conditional allele show a 381 bp band representing excisional loss of exon 5 and a LoxP site. Cre + mice are identified using primers targeting Cre. Top image, genotyping from mouse tail DNA. Bottom image, genotyping from cultured primary cortical neurons. (C) Depdc5-Emx1 mice have increased brain weights, are smaller than littermate controls, and cease to gain body weight by P20. CKO mice thus have an increased brain/body weight ratio in contrast littermate controls and heterozygotes. *P < 0.05, two-way ANOVA with Bonferroni’s multiple comparisons. n = 4–7 controls, n = 2–5 heterozygotes, n = 3–9 CKOs. (D) Survival was significantly shortened in CKO animals, with only a single CKO animal surviving past P26 (P < 0.0001 using Log-rank Mantel–Cox test). CKO male: n = 17, median survival = 22 days; CKO female, n = 18, median survival = 23 days; in contrast control (n = 37) and heterozygous (n = 28). Tick marks indicate animals that were censored due to sacrifice for biochemical experiments. (E) CKO animals (n = 9) showed decreased flurothyl-induced seizure threshold in contrast littermate controls (n = 10) and heterozygotes (n = 2). *P < 0.05, **P < 0.01, one-way ANOVA.
Table 1.
Depdc5Emx1 mice are born at a Mendelian ratio
| Cre+F/F | Cre-F/F | Cre+F/Wt | Cre-F/Wt | Litter size | Sequential litters |
|---|---|---|---|---|---|
| 40 | 31 | 33 | 30 | 7.1 ± 1.6 | 19 |
Depdc5-CKO mice have decreased life expectancy with terminal seizures
Characterization of the natural history of the Depdc5Emx1 mouse model demonstrated both clinical seizures and premature death as early as P11 in the CKO mouse. With routine handling, clinical seizures were noted in 25% of CKO mice, leading to a relative risk for seizures of nearly 50% by P25. Typical seizures observed included tonic convulsions, tonic-clonic convulsions and hypermotor seizures with running and jumping (27). With one exception, CKO mice died by P26, with no difference in mortality between male and female mice (P = 0.6727 by Mantel–Cox Log-rank test) (Fig. 1D). Some CKO mice were noted to lose weight or appear lethargic in the days prior to death, though no gross abnormalities were seen in heart, lung, liver or kidneys upon routine inspection. No seizures were observed in heterozygous or control mice with routine observation. Given that seizures were only observed in the CKO mice, we sought to determine if the seizure threshold was altered similarly in both the heterozygous and the CKO mice. Following the administration of the GABA antagonist flurothyl, the seizure latency was found to be reduced by greater than 50% in the CKO mice in comparison to both control and heterozygous mice (Fig. 1E). In addition, the character of the seizures in the CKO mice was different from heterozygous mice or controls, with a prolonged ictal course characterized by intermittent jerking before the stereotypical rearing then whole-body convulsing that is typically seen following flurothyl administration. Given the absence of observed seizures, the normal seizure threshold in the heterozygous animals, and the lack of a heterozygous phenotype in a previously published mouse model (15), subsequent studies focused on CKO animals and wild-type (WT) littermate controls.
To determine if the premature death in CKO animals was proximally related to seizures and may represent a model of SUDEP, a cohort of mice underwent continuous video monitoring from P18 to P29. At P23, two of three CKO mice demonstrated hypermotor running and jumping events followed immediately by tonic stiffening. Neither animal recovered from the tonic seizure and both died in place, supporting both that the previously observed hypermotor events are seizures and that the premature death in our model is likely a direct consequence of seizures (Supplemental Videos 1 and 2). The remaining CKO from this cohort was the only CKO to survive past 26 days, living until sacrifice at P43.
Depdc5-CKO mice have abnormally thickened cortex with cytomegalic neurons
To investigate the etiology for the enlarged brain size in the CKO mouse, cortical histology was examined. Brightfield photomicrographs of H&E stained paraffin sections demonstrated increased thickness of both the hippocampus and overlying cortex (Fig. 2A). Immunofluorescence staining with the layers II–IV marker Cux1 demonstrated an increased number of ectopic Cux1-positive neurons scattered throughout the lower layers (Supplementary Figure S1). As hypothesized following loss of Depdc5, a negative regulator of mTORC1, CKO mice had diffusely increased signal intensity of mTORC1 downstream target phosphorylated-S6 (pS6) (s240/244) (Fig. 2B). Cortical thickness was also significantly increased in CKO mice, consistent with the larger brain size (Fig. 2C). To confirm that the pS6 positive cells were indeed neuronal, sections were co-stained with the neuronal marker NeuN (Fig. 2D). By P5, cortical neurons were enlarged in the CKO mouse relative to littermate controls, consistent with aberrant mTORC1 activation (Fig. 2E). Immunoblots were performed on cortical lysates from P17–18 mice to evaluate expression of downstream targets of mTOR (pAkt S473, pS6 s240/244, and pS6 s235/236), NPRL2 and GFAP (Fig. 2F and G). After normalization to total S6 protein, phosphorylation of S6 was significantly elevated at both s235/236 and s240/244, consistent with elevated mTORC1 activity. Decreased phosphorylation of Akt (s473) was also evident. Decreased pAkt has been reported in other models with mTOR hyperactivation and is an expected consequence due to feedback regulation (20, 21, 28). Fellow GATOR1 complex protein NPRL2 showed a decrease, which is consistent with what was seen in the Depdc5Syn1 CKO mice (20). However, unlike the data from the Depdc5Syn1 CKO mice, we did not observe increased GFAP in the Depdc5Emx1 CKO mice, a finding reinforced with immunofluorescence staining for GFAP (Supplementary Figure S2).
Figure 2.
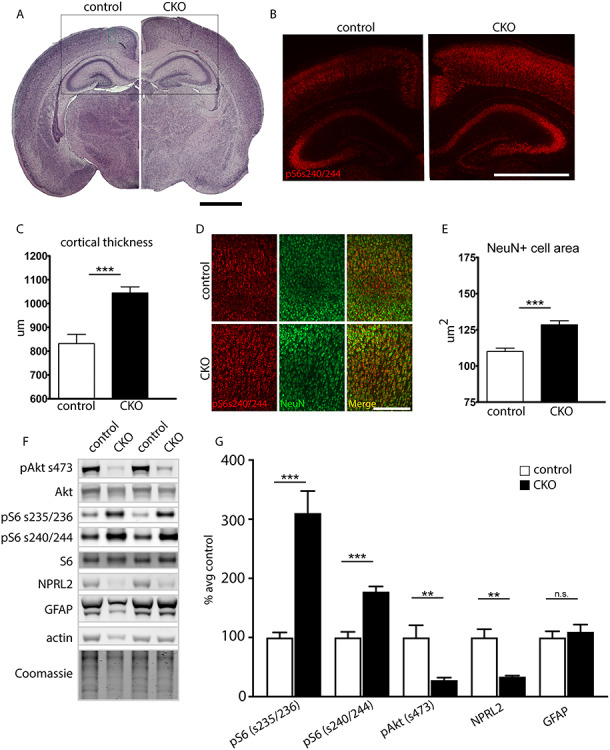
Neurohistologic abnormalities in CKO animals. (A) CKO animals display grossly thickened cortices and hippocampi by P5; hematoxylin and eosin (H&E) stain. Scale bar, 1000 μm. (B) CKO animals show diffusely positive pS6 (s240/244) immunofluorescence signal intensity (red) in the cortex and hippocampus. Image location indicated by the black box in panel A. Scale bar, 1000 μm. (C) Quantification of cortical width shows increased cortical thickness in CKO animals. Four separate sites were measured and averaged in at least two sections from n = 3 animals per genotype. *P < 0.05, Student’s t-test. (D and E) CKO cortical neurons (NeuN, green) are larger with more intense pS6 (s240/244) signal (red). ***P < 0.001, Student’s t-test, n ≥ 50 neurons per animal from 7 CKOs and 4 littermate controls. Image location indicated by the green box in (A). Scale bar, 200 μm. (F–G) Representative immunoblot and quantitative analysis of cortical lysates from P17–18 CKO and littermate controls (n = 5 mice per genotype). Expression levels were normalized to respective total protein (for pS6 and pAkt) or total protein by Coomassie (for NPRL2 and GFAP), then shown as percent of the average littermate control expression. β-actin is also shown as a loading control. Groups were compared using unpaired t-tests: pS6 s235/235, P = 0.0006; pS6 s240/244, P = 0.0004; pAkt, P = 0.009; NPRL2, P = 0.0015; GFAP, P = 0.5659. Bars represent mean ± SEM.
Depdc5-CKO astrocyte cultures demonstrate increased mTORC1 activation
As noted above, in contrast to published data from the Depdc5Syn1 mouse model, a marked gliosis, reflected by increased GFAP expression, was not appreciated in the Depdc5Emx1 CKO, a surprising finding as Emx1-Cre targets a population of astrocytes. While this finding may be a function of the young age at which the animals were studied, published data did not demonstrate co-localization of DEPDC5 with astrocytes in human tissue (2). Given the lack of high-quality antibodies for Depdc5 and challenges in demonstrating astrocytic S6 phosphorylation in mixed cell populations in vivo, we generated primary mouse astrocyte cultures for additional characterization. To further address the questions of Depdc5 expression in astrocytes, we examined mRNA from the astrocyte primary cultures. We found that Depdc5 mRNA was present in mouse astrocytes and that its expression was significantly reduced in the cultures obtained from the CKO mice. GFAP mRNA expression was not significantly altered in the primary cultures (Fig. 3A and B). To evaluate functional consequences of Depdc5 loss in astrocytes, we characterized mTORC1 activation in cultured astrocytes both during nutrient-plentiful and nutrient-restricted conditions. Immunostaining for phosphorylated S6 (s240/244) in astrocytes suggested increased mTORC1 activation (Fig. 3C–H), a finding confirmed by immunoblot with a slight, but significant increase in S6 phosphorylation in extracts from primary cultures of CKO astrocytes (Fig. 3I–L). Amino acid restriction resulted in a decrease in the level of mTORC1 activation in both control and CKO cells, though the difference in phosphorylation remained the same between control and CKO cells. Consistent with the results from cortical lysates, Akt phosphorylation at s473 was also decreased in the CKO astrocytes (Fig. 3M). While Akt phosphorylation was not changed in the control line following amino acid restriction, it was significantly increased in the CKO cells, consistent with a release of feedback inhibition. In total, these data support that Depdc5 is present and functional in astrocytes.
Figure 3.
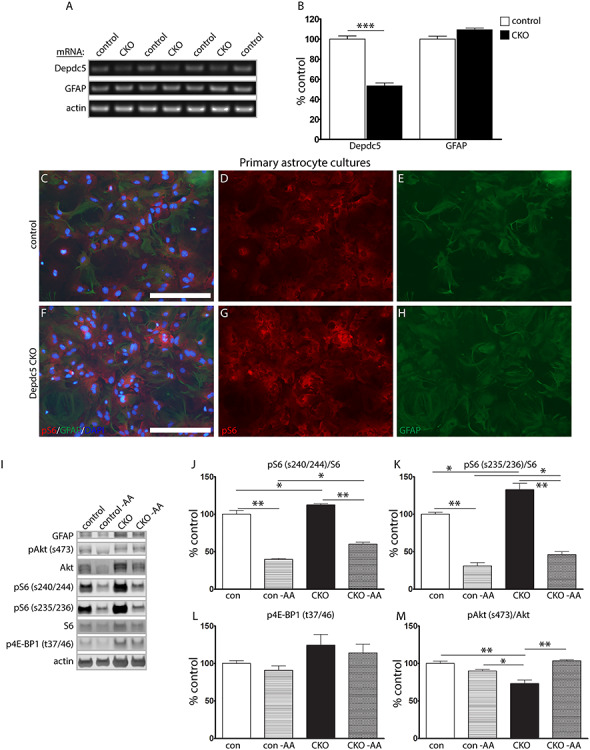
Astrocyte cultures from CKO mice display increased mTORC1 activation. (A and B) Semi-quantitative reverse transcriptase PCR of mRNA extracts from primary astrocyte cultures. Data represent mean ± SEM. Groups were compared using Student’s t-test, independent cultures from n = 4 control and n = 3 CKO mice. ***P < 0.001. (C–H) Primary astrocyte cultures from the CKO cortex demonstrate increased pS6 expression relative to littermate controls. Scale bar, 200 μm. (I–M) Protein immunoblots from primary astrocyte cultures isolated from WT and CKO cortex demonstrate increased expression of mTORC1 signaling targets at baseline and when subjected to amino acid deprivation (−AA). Blots were cropped to show relevant bands. Bars represent mean ± SEM. Groups were compared using two-way ANOVA with Tukey’s multiple comparisons, n = 3 independent cultures per genotype. *P < 0.05, **P < 0.01.
Depdc5-CKO mice show alterations of inhibitory neurotransmission in mIPSC amplitude, rise time and frequency
The thalamocortical circuitry, which includes cortical layer V/VI pyramidal neurons, has been suggested to be involved in generalized epilepsy/seizures in several animal models (29–31). Additionally, a study in zebrafish suggested that Depdc5 loss of function leads to mTORC1-independent alterations in GABAergic network activity (32). Thus, to further define mechanisms that may lead to neuronal excitability and epilepsy in Depdc5Emx1 CKO mice, we investigated the response of cortical excitatory neurons to GABAergic stimulation.
To characterize GABAergic synaptic transmission in WT and CKO mice, miniature inhibitory postsynaptic currents (mIPSCs) were recorded from cortical layer V pyramidal neurons at a −60 mV holding potential (Fig. 4A). Based on observation through diffuse interference contrast microscopy as well as size quantification by immunofluorescence, neurons from Depdc5Emx1 CKO mice have a larger soma size in contrast those from WT littermates, a finding reflected in the significantly increased capacitance of CKO neurons (Fig. 4B). mIPSCs in WT littermates demonstrated an amplitude of 35.58 ± 4.52 pA, with a frequency of 2.40 ± 0.75 Hz, exhibiting fast rising and slow decaying phases (Fig. 4C and D). Compared with mIPSCs from WT littermates, mIPSCs from Depdc5Emx1 CKO mice showed significantly smaller amplitudes (24.83 ± 2.10 pA) and tended to occur more frequently (4.26 ± 0.86 Hz), though this frequency increase was not statistically significant. The mIPSC amplitude cumulative distribution histogram from CKO mice also showed a left shift toward smaller amplitudes, compared with mIPSCs from WT littermates (k-s test, P = 0.0001), suggesting that mIPSCs in layer V pyramidal neurons CKO mice were significantly reduced (data not shown). A significant increase in the rise time and rise time-constant in mIPSC amplitude was seen in CKO mice (Fig. 4E and F), though mIPSC decay time and the decay time-constant were not different (data not shown, P = 0.35 and 0.29, respectively). These findings are consistent with postsynaptic mechanisms for decreased mIPSC responses, suggesting a functional impairment in the ability of Depdc5-deficient excitatory cortical neurons to respond to GABAergic-mediated inhibition.
Figure 4.
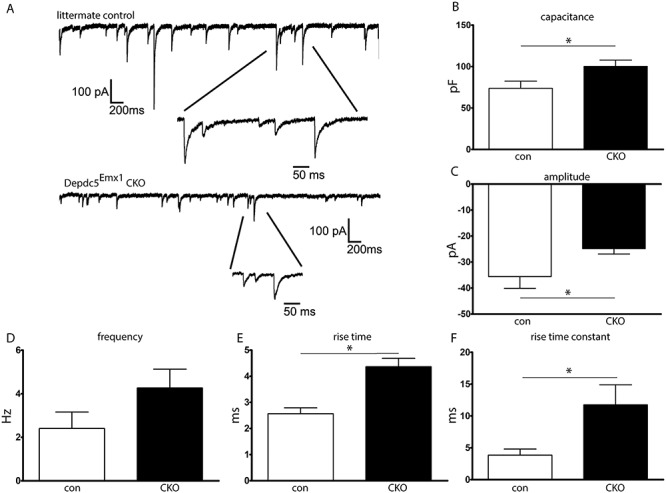
Brain slice cultures from CKO mice demonstrate increased capacitance and changes in inhibitory neurocircuitry. (A) Representative electrophysiologic tracing demonstrating mIPSCs in cortical excitatory neurons. (B) Capacitance was increased in CKO neurons. (C) mIPSC amplitude was decreased in CKO neurons. (D) Frequency of mIPSCs tended to be higher in CKO mice but did not reach statistical significance. (E and F) Both the rise time and rise time constant for mIPSCs were increased in CKO cortical excitatory neurons. n = 8–10 neurons from N = 3 mice per group. Groups were compared with the Student’s t-test, *P < 0.05.
Rapamycin extends survival of Depdc5-CKO mice and reduces seizure frequency, even after withdrawal
Our findings demonstrating macrocephaly with enlarged neurons, altered cortical and hippocampal anatomy, and increased S6 phosphorylation are consistent with previous studies in TSC and Depdc5 mouse models with mTORC1 hyperactivation. To determine the contribution of mTORC1 hyperactivation to premature death in the Depdc5Emx1 CKO, CKO mice and littermate controls were treated with the mTORC1 inhibitor rapamycin (3 mg/kg, 5 days per week), a protocol that was shown to prevent early death in a Tsc1 mouse model and rescue myelination in the Olig2-Tsc2 mouse model (21, 33). Following treatment with rapamycin, 71% of CKO mice survived to 30 days of life, in contrast to untreated or vehicle-treated CKO mice with 5% survival by P26 (Fig. 5A). A witnessed seizure was seen in 1 of 20 (5%) of the rapamycin-treated CKO mice, a significant reduction from the 25% of untreated or vehicle treated CKO mice demonstrating clinical seizures (P ≤ 0.05 using Chi-square with Yates correction). The lone rapamycin-treated animal with an observed seizure died prematurely at P22. Cortical extracts confirmed both the marked elevation of S6 phosphorylation prior to treatment and the decrease to near normal levels with rapamycin treatment (Fig. 5B and C). The benefits of rapamycin with respect to mortality were durable despite increased S6 phosphorylation 7 days following rapamycin withdrawal at P30. All CKO animals that survived to P30 remained living until the day of sacrifice at P70. CKO animals did have significantly increased brain weights at P70, although the brain-to-body ratio was not significantly different from littermate controls (Fig. 5D–F).
Figure 5.
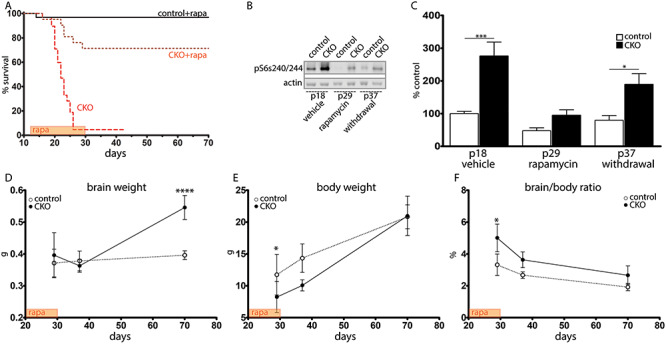
Rapamycin treatment prolongs survival even after withdrawal. (A) Survival after rapamycin (P < 0.0001 using Log-rank [Mantel–Cox] test). (B) Without treatment, CKO cortical lysates demonstrated increased pS6 (s240/244) (P18) in contrast littermate controls. This was attenuated during rapamycin treatment (P29) and remained attenuated 1 week after rapamycin withdrawal (P37). (C) Quantification of pS6 s240/244 expression. n = 4 animals per genotype. *P < 0.05, ***P < 0.001 by two-way ANOVA with Bonferroni’s multiple comparison test. (D–F) Brain weight (D), body weight (E) and brain-to-body ratio (F) immediately after the rapamycin treatment window (P30), 7 days after treatment withdrawal (P37) and 40 days after treatment withdrawal (P70). n = 3–6 CKOs and n = 4–20 littermate controls. *P < 0.05 by 2-way ANOVA with Bonferroni’s multiple comparison test.
Discussion
Mutations in the component proteins of the GATOR1 complex are increasingly appreciated as common causes for focal epilepsies. The association of these mutations with medically refractory focal epilepsies and SUDEP necessitates a better understanding of the mechanisms by which the loss of these components leads to epilepsy. Herein, we describe a novel epileptic mouse model lacking Depdc5 in neuroprogenitor cells.
Experience from the study of mouse models of TSC has demonstrated that mouse models do not recapitulate the human disease completely, including lack of seizures in heterozygous mouse models and lack of focal ‘tuber-like’ structures. Nonetheless, rodent models continue to have value in addressing underlying mechanisms of epilepsy and for designing therapies that may modulate neuronal networks or affect multiple organ systems. Published rodent models have previously and consistently shown that knockout or knockdown of Depdc5 allows increased mTORC1 activity, increased neuronal size, and dysplastic cortical neurons (16, 18, 20). Given that homozygous global knockout of Depdc5 is embryonic lethal and heterozygous mice do not have epilepsy, mouse models with a CKO or with an induced focal second hit have been required for epileptogenesis. Yuskaitis et al. demonstrated in the Depdc5Syn1 CKO mouse model a lowered seizure threshold, rare spontaneous seizures and premature death (20). By targeting neuroprogenitor cells, we have generated a mouse model with a similar, though more severe phenotype, including a higher incidence of epilepsy and attenuated life span. While we were unable to perform video-EEG recordings due to the small size of the young animals, the relative risk for clinical seizures observed during routine husbandry approached 50% by 25 days of life. This risk is likely an underestimation of total seizure burden given that these were seizures observed during routine handling; however, the lack of video-EEG is a limitation of this study. Consistent with this, focused video analysis demonstrated terminal seizures in two of three mice, supporting the likelihood that premature death in this model is due to seizures and that this may serve as a model for investigation of mechanisms of SUDEP. Future studies with video-EEG recordings will be required to fully characterize the association between clinical seizures and SUDEP in our model.
While both Syn1-Cre and Emx1-Cre result in gene deletion in excitatory neurons, because Emx1-Cre targets neuroprogenitor cells, a subset of astrocytes is also targeted. Published data from human tissue failed to definitively show DEPDC5 in astrocytes via immunofluorescence labeling (2). Without Depdc5, astrocytes would have to rely on an alternative method for sensing cellular amino acids (12). While the lack of a quality Depdc5 antibody precluded a direct quantitation of Depdc5 protein in mouse brain or in cultured astrocytes, our data demonstrating mTORC1 hyperactivation in CKO astrocytes and the presence of Depdc5 mRNA in astrocyte cultures suggest that Depdc5 is expressed and functional in mouse astrocytes. The contribution of astrocytes to epilepsy is increasingly appreciated (34). Astrocytes perform a variety of functions that can modulate neuronal excitability, including playing a significant role in extracellular potassium regulation. Disruption of these functions or of the ratio of astrocytes to neurons may increase neuronal excitability. It is also possible that non-cell-autonomous effects are occurring in the cortex and contributing to astrocyte dysfunction (35); however, these effects are likely limited in primary astrocyte cultures. Further studies will be important to determine the contribution of astrocytes and other glial cells to the pathogenesis of DEPDC5-related epilepsies.
Our data demonstrate that CKO cortical excitatory neurons have a reduced ability to respond to GABAergic input, which may play a role in neuronal excitability leading to epilepsy. A decrease in mIPSC amplitude, but no significant change in frequency, suggests a postsynaptic mechanism, such as reduced expression or activation of postsynaptic GABA receptors. Ribierre et al. reported altered dendritic spine morphology, including spine hypertrophy and increased branching complexity in focal regions of Depdc5 homozygosity following in utero electroporation (18). It is possible that similar morphologic alterations are present in the dendritic arbors of Depdc5Emx1 CKO mice, impairing the response to presynaptic GABA release. Another possibility involves a potential mTORC1-independent function of DEPDC5 in regulating fine-branching of the GABAergic network (32). While the exact mechanism underlying the decreased response to GABA has not yet been fully determined, our findings may suggest a specific benefit for drug therapies which increased GABA availability.
The finding that inhibition of mTORC1 with rapamycin nearly completely prevented premature death and decreased the incidence of observed seizures in our mouse model strongly supports a primary role for mTORC1 dysregulation. Similar findings concerning premature death were observed following treatment of the Depdc5Syn1 mouse with rapamycin (15). Future studies will be required to better clarify the mechanisms by which transient mTORC1 inhibition is protective in our mouse model. The finding that transient rapamycin treatment (P12—P30) was able to prevent death and observed seizures for an extended period of time following withdrawal is consistent with the notion that transient mTOR inhibition may be sufficient to modify development and lead to long-lasting benefits with respect to neuronal excitability. Similar findings have been reported following rapamycin withdrawal in TSC mouse models, with extended survival following withdrawal of rapamycin (28, 36). However, TSC mice given rapamycin until P30 had gradual deterioration following treatment withdrawal (28). While we did not observe clinical deterioration in our mice following rapamycin withdrawal, CKO mice did have an increased brain weight in contrast controls at P70, suggesting possible phenotypic re-emergence or progression.
The long-term benefits of early drug treatment with the goal of future seizure prevention are currently being investigated in TSC, the prototypical mTORopathy (https://clinicaltrials.gov/ct2/show/NCT02849457). Thus, the concept that seizure prevention during a critical neurodevelopmental window may have lasting consequences for the future development of epilepsy in GATORopathies warrants further consideration. Whether similar long-lasting benefits in our model may result from shorter durations of mTOR inhibition, early seizure prevention with standard antiepileptic medications, or dietary modifications are considerations for future studies.
Materials and Methods
Generation of CKO mouse model
To generate a mouse model of Depdc5, mice containing a floxed-stop allele of exon 5 (Depdc5tm1c(EUCOMM)Hmgu) were obtained from Infrafrontier (EM:10459). As homozygous loss of Depdc5 is lethal in the embryonic stage (16, 17), to contrast heterozygous versus the homozygous loss of Depcd5 in cortical neurons, a CKO mouse was generated. To target neuroprogenitor cells, male Depdc5 mice were crossed to female mice heterozygous for Depdc5 and Emx1-Cre (Jax 005628) and maintained on a C57BL/6 background. This breeding strategy was used due to mitigate risk of germline transmission of Emx1.
Mice were housed under normal environmental conditions with a standard 12-h light-dark cycle and ad lib access to water and food. Weekly weights were taken to ensure the maintenance of normal food and water intake. Mice were euthanized under anesthesia for tissue harvesting, methods in accordance with AVMA guidelines. All work was conducted with the approval of the Institutional Animal Care and Use Committee at Vanderbilt University, Nashville, Tennessee (M/17/00125).
Confirmation that pups were born at a Mendelian ratio was determined by counting pups from 19 consecutive litters. Thereafter, animals were observed daily and weighted weekly or at time of sacrifice. Animals which died were plotted on Kaplan–Meier curves along with animals that were censored for use in experiments. Male and female CKO mice showed no difference in mortality and were used interchangeably in studies. Documentation of seizure incidence was recorded during routine husbandry.
Genotyping
DNA was extracted from mouse tails using the REDExtract-N-Amp Tissue PCR kit according to the manufacturer’s instructions (Millipore Sigma #XNAT). Genotyping of the Depdc5 gene was performed using primers (forward: 5′- TCCAGCTTCAGCTCTCTT-3′; reverse: 5′- AAGCAGCCTATGTACCATTTAT-3′) that flank LoxP sites surrounding exon 5, allowing concurrent detection of the WT and conditional alleles. Agarose gel electrophoresis was performed, detecting a 701 base pair (bp) band for the WT allele, a 981 bp band for the conditional allele, and a 381 bp band for the CKO. The presence of the Cre recombinase gene was determined using primers (forward: 5’-GCATTACCGGTCGATGCAACGAGTGATGAG-3′; reverse: 5’-GAGTGAACGAACCTGGTCGAAATCAGTGCG-3′) detecting a 408 bp band. Genomic DNA was isolated from astrocytes using a DNeasy kit (Qiagen #69504) and Cre-mediated deletion of exon 5 of Depdc5 was verified by PCR following the genotyping strategy above.
Seizure threshold testing with flurothyl
As described previously, in a blinded manner, P15 mice were placed in a 1.96 L custom built acrylic chamber and allowed to habituate for 1 min (37). Following habituation, a 10% solution of the GABA antagonist flurothyl (bis-2,2,2-trifluoroethyl ether, Sigma-Aldrich) in 95% ethanol was dripped at a rate of 100 μL/min onto filter paper suspended above and out of reach of the animal. Latency to seizure, typically a stereotyped clonic-forebrain seizure with rearing followed by tonic-clonic convulsions, was recorded and compared between groups with a one-way ANOVA.
Immunofluorescence
Brain tissues were dissected from Depdc5 CKO and littermate controls as previously described (37–39). Briefly, animals were anesthetized with ketamine/xylazine and perfused (P5 and older) with ice-cold phosphate buffered saline (PBS) followed by ice-cold 4% paraformaldehyde (PFA) in PBS (pH 7.4). Brains were post-fixed in 4% PFA overnight and cryoprotected in 30% sucrose in PBS prior to sectioning. Brains were frozen in OCT and stored at −80°C. Ten um sections were cut using a cryostat.
Immunofluorescence was performed as previously described (40). Briefly, brain sections on slides were post-fixed in 1% PFA, washed in PBS, blocked in 10% goat serum with 0.1% Triton X-100, and primary antibodies were added and incubated overnight at 4C. The next day, slides were washed in PBS and secondary fluorescent antibodies (AlexaFluor, ThermoFisher) were added and allowed to bind for 1 h. Slides were washed in PBS and coverslipped with mounting medium including DAPI (Vectashield, Vector Labs #H-1200). Negative controls omitting primary antibodies were performed for each experiment.
Photomicrographs were obtained using an AMG EVOS epifluorescence microscope. All images from a given experiment were generated in parallel with constant gain and exposure time. Images analysis was performed with ImageJ and Adobe Photoshop CS5. Minor adjustments of contrast or brightness, as well as cropping, were performed concurrently on control and CKO sections. Experiments were performed in triplicate to ensure reproducibility.
Cell size
Size of NeuN positive cells was quantified by importing images to ImageJ (NIH, version 1.38) and, in a blinded fashion, cell area was measured in > 50 cells per animal from layers 2–4 of the frontal cortex using five independent control littermate and five Depdc5Emx1-Cre CKO mice. Means and standard deviation were calculated and results were compared for statistical significance using Student’s t-test.
Rapamycin treatment
Rapamycin (LC Laboratories, Woburn, MA) was dissolved at 30 mg/mL in ethanol and diluted with vehicle 0.25% Tween 20/0.25% polyethylene glycol in PBS. Depdc5Emx1-Cre CKO and control littermates were injected with either rapamycin (3 mg/kg) or vehicle i.p. daily Monday-Friday of each week starting at P13–15 (41). All surviving mice were euthanized between P30–70. As nearly all vehicle-treated Depdc5Emx1-Cre CKO mice died by 26 days of life, a vehicle-treated control littermate was euthanized on that same day. All control brains were rapidly removed, weighed and processed in parallel with brains from Depdc5Emx1-Cre CKO mice. Kaplan–Meier survival curves of Depdc5Emx1-Cre CKO and control mice treated with either rapamycin or vehicle were compared using the log rank test (GraphPad Prism).
Immunoblotting
Mice were anesthetized with isoflurane and tissues rapidly dissected on ice, flash frozen in liquid nitrogen and stored at −80°C. Lysate preparation, SDS-PAGE, and immunoblotting were performed as previously described (40).
Primary antibodies:
| Antibody | Species | Dilution | Vendor/Manufacturer | Catalog Number |
|---|---|---|---|---|
| anti-beta-actin | Rabbit | 1:2000 (WB) | Cell Signaling Technology | #4967 |
| anti-beta-actin | Mouse | 1:2000 (WB) | Sigma | #A5441 |
| anti-phospho-Akt (Ser473) | Rabbit | 1:1000 (WB) | Cell Signaling Technology | #4060 |
| anti-phospho-4E-BP1 (Thr37/46) | Rabbit | 1:250 (WB) | Cell Signaling Technology | #2855 |
| anti-4E-BP1 (clone 53H11) | Rabbit | 1:500 (WB) | Cell Signaling Technology | #9644 |
| anti-pan-Akt (clone 40D4) | Mouse | 1:1000 (WB) | Cell Signaling Technology | #2920S |
| anti-phospho-S6 (Ser235/236) | Rabbit | 1:1000 (WB) | Cell Signaling Technology | #2211 |
| anti-phospho-S6 (Ser240/244) | Rabbit | 1:1000–1:2000 (WB); 1:800 (IF) | Cell Signaling Technology | #5364 |
| anti-S6 (clone 54D2) | Mouse | 1:500 (WB) | Cell Signaling Technology | #2317S |
| anti-NPRL2 | Rabbit | 1:1000 (WB) | Cell Signaling Technology | #37344S |
| anti-GFAP | Mouse | 1:1000 (WB); 1:300 (IF) | Cell Signaling Technology | #3670 |
| anti-NeuN | Mouse | 1:1000 (IF) | Abcam | #ab104224 |
| anti-Cux1 | Rabbit | 1:100 (IF) | Santa Cruz | #SC-13024 |
Primary mouse astrocyte cultures
Primary mixed glial cultures were prepared from P0 to P2 mouse brains with modification of published protocols (33, 42). Briefly, following euthanasia, cortical tissue was isolated, dissociated and plated into poly-l-lysine (PLL)-coated flasks incubated at 37°C and 8.5% CO2 in mixed glial culture media (MGCM, DMEM with 10% FBS + pen/strep). Microglia and oligodendrocyte precursors were removed via differential shaking at DIV9. Astrocytes remaining in the T25 flask were washed with PBS and dissociated with 0.25% trypsin in Hanks’ balanced salt solution. Dissociated cells were re-plated into T-25 flasks or onto PLL-coated 24-well culture dishes until the day of harvest.
For immunoblotting, individual cultures from a single animal represent a single biologic replicate. For amino acid starvation experiments, fresh baseline MGCM or nutrient-limited media consisting of DMEM lacking amino acids (USBiological D9800–13) was added at time zero. Cells were harvested and lysed for protein after 1.5 h, then analyzed via immunoblot.
For immunofluorescence microscopy, cells in 24-well dishes were washed with PBS followed by fixation with 4% paraformaldehyde for 10 min. Following PBS washes, cells were labeled as described above prior to imaging with an EVOS fluorescent microscope (AMG).
Semi-quantitative RT-PCR from primary mouse astrocyte cultures
Total RNA was extracted from astrocytes using the RNeasy kit (Qiagen #74134) and QIAShredder columns (Qiagen #79654) according to the manufacturer’s instructions. DNA digestion was performed using either on-column DNA digestion (Qiagen #79254). cDNA was synthesized using random primers with the SuperScript VILO cDNA synthesis kit (Invitrogen #11754). A PCR reaction with primers designed to amplify Depdc5, GFAP (224 bp), or Actin (150 bp) was performed using 100 ng of cDNA. Depdc5 (150 bp):
F′-5’-GTCCTTTGCTTTTGCAAGTCA-3′, R-5’-CCCACGGCCAATATACTGAT-3′. GFAP: F-5’-TCCTGGAACAGCAAAACAAG-3′, R-5′- CAGCCTCAGGTTGGTTTCAT-3′ (43). Actin: F-5′- CCACCATGTACCCAGGCATT-3′, R-5′- GGACTCATCGTACTCCTGC-3′. The reaction was performed as follows using a Bio-Rad T100 thermal cycler: 95°C x 1 minute, repeated 35 times: (95°C × 15 s, 54.5°C × 15 s, 72°C × 2 min), 72°C × 5 min. Following amplification, PCR products were separated on a 1.5% agarose gel. Band densities for Depdc5 and GFAP products were quantified using ImageJ (NIH, version 1.51n) and normalized to Actin, then expressed as % average control. Primary cultures from four separate CKO mice and four littermate controls were analyzed.
Brain slice preparation and whole-cell recordings
Brain slices were prepared using the method previously described in Schofield et al. (44) and Zhou et al. (45). Mice (postnatal 14–18 days old of either gender) were anesthetized with isoflurane. Brains were then surgically removed to prepare coronal slices (300 μm) using a LEICA VT-1200S vibrotome (Leica Inc) in oxygenated (bubbling with 95%O2/5%CO2) ice-cooled dissection solution (4°C) (mM: 2.5 KCl, 0.5 CaCl2, 10 MgSO4, 1.25 NaH2PO4, 24 NaHCO3, 11 Glucose, 214 sucrose). The slices were incubated in a glass chamber containing oxygenated ACSF (mM: 126 NaCl, 2.5 KCl, 2 CaCl2, 2 MgCl2, 26 NaHCO3, 10 glucose, pH 7.4) for 40 min at 35–36°C. The slices were allowed to recover at room temperature for at least 1 h before recordings.
Whole-cell recordings were carried out with an upright NIKON Eclipse FN-1 IR-DIC microscope and a MultiClamp 700B amplifier and Digidata 1440A (Molecular Devices Inc.). Since the thalamocortical circuitry is involved in epileptogenesis, layer V pyramidal neurons in the somatosensory cortex were chosen for recording (44, 46). Miniature inhibitory postsynaptic currents (mIPSCs) were recorded at −60 mV and isolated by including 10–20 μM NBQX and 1 μM tetrodotoxin (TTX) in the ACSF (flow rate: 1–1.5 mL per min). The internal solution for recordings contained (as per Schofield et al., in mM: 135 CsCl, 10 HEPES, 10 EGTA, 5 QX-314, 5 ATP-Mg (290–295 mOsm, pH = 7.3) with a chloride ion reversal potential close to 0 mV (44). Filled glass electrodes had 3–5 MΩ resistance. Access resistances during recording were continuously monitored and were less than 20–25 MΩ. The access resistances were compensated by 70% and cell capacitance. Unstable recordings with access resistance variation > 20% or larger than 25 MΩ were discarded. Junction potentials were compensated for when electrodes were in ACSF. Data were collected using the Clampex program 10.2 (Molecular Devices Inc.) and synaptic currents were filtered at 2 KHz and digitized at 10 KHz. All recordings were made continuously for 20–30 min following the rupture of the membrane (at room temperature, 24°C). mIPSC data were analyzed with Clampfit (Molecular Devices Inc.) using threshold detection (at least 2.5X baseline RMS with no clear synaptic events) (47). Histogram and accumulative graphs were constructed. The network oscillation data were analyzed with both Clampfit (for spike histogram and autocorrelation function) and MATLAB to obtain autocorrelograms. Numerical data were reported as mean ± S.E. and statistical differences were determined by the Student’s t-test.
Conflict of Interest Statement
None declared.
Supplementary Material
Acknowledgements
This work was supported by the National Institutes of Health [K08 NS083710 to R.P.C.] and National Institute of General Medical Sciences [T32GM007347 to L.K.K.]. The C57BL/6 N-Depdc5tm1c(EUCOMM)Hmgu mice were obtained from the MRC Harwell Institute which distributes these mice on behalf of the European Mouse Mutant Archive (www.infrafrontier.eu). The MRC Harwell Institute is also a member of the International Mouse Phenotyping Consortium (IMPC) which funded the generation of the C57BL/6 N-Depdc5tm1c(EUCOMM)Hmgu mice. Funding and associated primary phenotypic information may be found at www.mousephenotype.org.
Abbreviations
DEPDC5, DEP domain-containing protein 5; DMEM, Dulbecco’ s modified Eagle’ s medium; FCD, focal cortical dysplasia; FGF2, fibroblast growth factor 2; GAP, GTPase activating protein; GATOR1, GAP activity toward Rags; iPSC, induced pluripotent stem cell; mTOR, mechanistic target of rapamycin; mTORC1, mechanistic target of rapamycin complex 1; NPRL2, nitrogen permease regulator-like 2; NPRL3, nitrogen permease regulator-like 3; P# , postnatal day of life; PBS, phosphate buffered saline; PFA, paraformaldehyde; p4E-BP1, phosphorylated eukaryotic translation initiation factor 4E (eIF4E)-binding protein 1; pAkt, phosphorylated Akt; pS6, phosphorylated S6 ribosomal protein; SUDEP, sudden unexpected death in epilepsy; TSC, tuberous sclerosis complex.
References
- 1. Carvill G.L., Crompton D.E., Regan B.M., McMahon J.M., Saykally J., Zemel M., Schneider A.L., Dibbens L., Howell K.B., Mandelstam S. et al. (2015) Epileptic spasms are a feature of DEPDC5 mTORopathy. Neurol. Genet., 1, e17. [DOI] [PMC free article] [PubMed] [Google Scholar]
- 2. Dibbens L.M., Vries B., Donatello S., Heron S.E., Hodgson B.L., Chintawar S., Crompton D.E., Hughes J.N., Bellows S.T., Klein K.M. et al. (2013) Mutations in DEPDC5 cause familial focal epilepsy with variable foci. Nat. Genet., 45, 546–551. [DOI] [PubMed] [Google Scholar]
- 3. Scerri T., Riseley J.R., Gillies G., Pope K., Burgess R., Mandelstam S.A., Dibbens L., Chow C.W., Maixner W., Harvey A.S. et al. (2015) Familial cortical dysplasia type IIA caused by a germline mutation in DEPDC5. Ann. Clin. Transl. Neurol., 2, 575–580. [DOI] [PMC free article] [PubMed] [Google Scholar]
- 4. Scheffer I.E., Heron S.E., Regan B.M., Mandelstam S., Crompton D.E., Hodgson B.L., Licchetta L., Provini F., Bisulli F., Vadlamudi L. et al. (2014) Mutations in mammalian target of rapamycin regulator DEPDC5 cause focal epilepsy with brain malformations. Ann. Neurol., 75, 782–787. [DOI] [PubMed] [Google Scholar]
- 5. Baldassari S., Picard F., Verbeek N.E., Kempen M., Brilstra E.H., Lesca G., Conti V., Guerrini R., Bisulli F., Licchetta L. et al. (2019) The landscape of epilepsy-related GATOR1 variants. Genet. Med., 21, 398–408. [DOI] [PMC free article] [PubMed] [Google Scholar]
- 6. Baulac S., Ishida S., Marsan E., Miquel C., Biraben A., Nguyen D.K., Nordli D., Cossette P., Nguyen S., Lambrecq V. et al. (2015) Familial focal epilepsy with focal cortical dysplasia due to DEPDC5 mutations. Ann. Neurol., 77, 675–683. [DOI] [PubMed] [Google Scholar]
- 7. Ishida S., Picard F., Rudolf G., Noe E., Achaz G., Thomas P., Genton P., Mundwiller E., Wolff M., Marescaux C. et al. (2013) Mutations of DEPDC5 cause autosomal dominant focal epilepsies. Nat. Genet., 45, 552–555. [DOI] [PMC free article] [PubMed] [Google Scholar]
- 8. Picard F., Makrythanasis P., Navarro V., Ishida S., Bellescize J., Ville D., Weckhuysen S., Fosselle E., Suls A., De Jonghe P. et al. (2014) DEPDC5 mutations in families presenting as autosomal dominant nocturnal frontal lobe epilepsy. Neurology, 82, 2101–2106. [DOI] [PubMed] [Google Scholar]
- 9. Lal D., Reinthaler E.M., Schubert J., Muhle H., Riesch E., Kluger G., Jabbari K., Kawalia A., Baumel C., Holthausen H. et al. (2014) DEPDC5 mutations in genetic focal epilepsies of childhood. Ann. Neurol., 75, 788–792. [DOI] [PubMed] [Google Scholar]
- 10. Bagnall R.D., Crompton D.E., Petrovski S., Lam L., Cutmore C., Garry S.I., Sadleir L.G., Dibbens L.M., Cairns A., Kivity S. et al. (2016) Exome-based analysis of cardiac arrhythmia, respiratory control, and epilepsy genes in sudden unexpected death in epilepsy. Ann. Neurol., 79, 522–534. [DOI] [PubMed] [Google Scholar]
- 11. Nascimento F.A., Borlot F., Cossette P., Minassian B.A. and Andrade D.M. (2015) Two definite cases of sudden unexpected death in epilepsy in a family with a DEPDC5 mutation. Neurol. Genet., 1, e28. [DOI] [PMC free article] [PubMed] [Google Scholar]
- 12. Bar-Peled L., Chantranupong L., Cherniack A.D., Chen W.W., Ottina K.A., Grabiner B.C., Spear E.D., Carter S.L., Meyerson M. and Sabatini D.M. (2013) A tumor suppressor complex with GAP activity for the rag GTPases that signal amino acid sufficiency to mTORC1. Science, 340, 1100–1106. [DOI] [PMC free article] [PubMed] [Google Scholar]
- 13. D'Gama A.M., Geng Y., Couto J.A., Martin B., Boyle E.A., LaCoursiere C.M., Hossain A., Hatem N.E., Barry B.J., Kwiatkowski D.J. et al. (2015) Mammalian target of rapamycin pathway mutations cause hemimegalencephaly and focal cortical dysplasia. Ann. Neurol., 77, 720–725. [DOI] [PMC free article] [PubMed] [Google Scholar]
- 14. D'Gama A.M., Woodworth M.B., Hossain A.A., Bizzotto S., Hatem N.E., LaCoursiere C.M., Najm I., Ying Z., Yang E., Barkovich A.J. et al. (2017) Somatic mutations activating the mTOR pathway in dorsal Telencephalic progenitors cause a continuum of cortical Dysplasias. Cell Rep., 21, 3754–3766. [DOI] [PMC free article] [PubMed] [Google Scholar]
- 15. Yuskaitis C.J., Rossitto L.-A., Gurnani S., Bainbridge E., Poduri A. and Sahin M. (2019) Chronic mTORC1 inhibition rescues behavioral and biochemical deficits resulting from neuronal Depdc5 loss in mice. Hum. Mol. Genet., 28, 2952–2964. [DOI] [PMC free article] [PubMed] [Google Scholar]
- 16. Marsan E., Ishida S., Schramm A., Weckhuysen S., Muraca G., Lecas S., Liang N., Treins C., Pende M., Roussel D. et al. (2016) Depdc5 knockout rat: a novel model of mTORopathy. Neurobiol. Dis., 89, 180–189. [DOI] [PubMed] [Google Scholar]
- 17. Hughes J., Dawson R., Tea M., McAninch D., Piltz S., Jackson D., Stewart L., Ricos M.G., Dibbens L.M., Harvey N.L. et al. (2017) Knockout of the epilepsy gene Depdc5 in mice causes severe embryonic dysmorphology with hyperactivity of mTORC1 signalling. Sci. Rep., 7, 12618. [DOI] [PMC free article] [PubMed] [Google Scholar]
- 18. Ribierre T., Deleuze C., Bacq A., Baldassari S., Marsan E., Chipaux M., Muraca G., Roussel D., Navarro V., Leguern E. et al. (2018) Second-hit mosaic mutation in mTORC1 repressor DEPDC5 causes focal cortical dysplasia–associated epilepsy. J. Clin. Invest., 128, 2452–2458. [DOI] [PMC free article] [PubMed] [Google Scholar]
- 19. Dawson R.E., Nieto Guil A.F., Robertson L.J., Piltz S.G., Hughes J.N. and Thomas P.Q. (2019) Functional screening of GATOR1 complex variants reveals a role for mTORC1 deregulation in FCD and focal epilepsy. Neurobiol. Dis., 134, 104640. [DOI] [PubMed] [Google Scholar]
- 20. Yuskaitis C.J., Jones B.M., Wolfson R.L., Super C.E., Dhamne S.C., Rotenberg A., Sabatini D.M., Sahin M. and Poduri A. (2018) A mouse model of DEPDC5-related epilepsy: neuronal loss of Depdc5 causes dysplastic and ectopic neurons, increased mTOR signaling, and seizure susceptibility. Neurobiol. Dis., 111, 91–101. [DOI] [PMC free article] [PubMed] [Google Scholar]
- 21. Carson R.P., Van Nielen D.L., Winzenburger P.A. and Ess K.C. (2012) Neuronal and glia abnormalities in Tsc1-deficient forebrain and partial rescue by rapamycin. Neurobiol. Dis., 45, 369–380. [DOI] [PMC free article] [PubMed] [Google Scholar]
- 22. Magri L., Cambiaghi M., Cominelli M., Alfaro-Cervello C., Cursi M., Pala M., Bulfone A., Garcia-Verdugo J.M., Leocani L., Minicucci F. et al. (2011) Sustained activation of mTOR pathway in embryonic neural stem cells leads to development of tuberous sclerosis complex-associated lesions. Cell Stem Cell, 9, 447–462. [DOI] [PubMed] [Google Scholar]
- 23. Gorski J.A., Talley T., Qiu M., Puelles L., Rubenstein J.L. and Jones K.R. (2002) Cortical excitatory neurons and glia, but not GABAergic neurons, are produced in the Emx1-expressing lineage. J. Neurosci., 22, 6309–6314. [DOI] [PMC free article] [PubMed] [Google Scholar]
- 24. Kwon C.-H., Luikart B.W., Powell C.M., Zhou J., Matheny S.A., Zhang W., Li Y., Baker S.J. and Parada L.F. (2006) Pten regulates neuronal arborization and social interaction in mice. Neuron, 50, 377–388. [DOI] [PMC free article] [PubMed] [Google Scholar]
- 25. Zhou J., Blundell J., Ogawa S., Kwon C.H., Zhang W., Sinton C., Powell C.M. and Parada L.F. (2009) Pharmacological inhibition of mTORC1 suppresses anatomical, cellular, and behavioral abnormalities in neural-specific Pten knock-out mice. J. Neurosci., 29, 1773–1783. [DOI] [PMC free article] [PubMed] [Google Scholar]
- 26. Roy A., Skibo J., Kalume F., Ni J., Rankin S., Lu Y., Dobyns W.B., Mills G.B., Zhao J.J., Baker S.J. et al. (2015) Mouse models of human PIK3CA-related brain overgrowth have acutely treatable epilepsy. Elife, 4, e12703. [DOI] [PMC free article] [PubMed] [Google Scholar]
- 27. Pinel J.P. and Rovner L.I. (1978) Electrode placement and kindling-induced experimental epilepsy. Exp. Neurol., 58, 335–346. [DOI] [PubMed] [Google Scholar]
- 28. Meikle L., Pollizzi K., Egnor A., Kramvis I., Lane H., Sahin M. and Kwiatkowski D.J. (2008) Response of a neuronal model of tuberous sclerosis to mammalian target of rapamycin (mTOR) inhibitors: effects on mTORC1 and Akt signaling lead to improved survival and function. J. Neurosci., 28, 5422–5432. [DOI] [PMC free article] [PubMed] [Google Scholar]
- 29. McCormick D.A. and Contreras D. (2001) On the cellular and network bases of epileptic seizures. Annu. Rev. Physiol., 63, 815–846. [DOI] [PubMed] [Google Scholar]
- 30. Beenhakker M.P. and Huguenard J.R. (2009) Neurons that fire together also conspire together: is normal sleep circuitry hijacked to generate epilepsy? Neuron, 62, 612–632. [DOI] [PMC free article] [PubMed] [Google Scholar]
- 31. Kang J.Q., Shen W., Zhou C., Xu D. and Macdonald R.L. (2015) The human epilepsy mutation GABRG2(Q390X) causes chronic subunit accumulation and neurodegeneration. Nat. Neurosci., 18, 988–996. [DOI] [PMC free article] [PubMed] [Google Scholar]
- 32. Swaminathan A., Hassan-Abdi R., Renault S., Siekierska A., Riché R., Liao M., De Witte P.A.M., Yanicostas C., Soussi-Yanicostas N., Drapeau P. et al. (2018) Non-canonical mTOR-independent role of DEPDC5 in regulating GABAergic network development. Curr. Biol., 28, 1924–1937.e5. [DOI] [PubMed] [Google Scholar]
- 33. Carson R.P., Kelm N.D., West K.L., Does M.D., Fu C., Weaver G., McBrier E., Parker B., Grier M.D. and Ess K.C. (2015) Hypomyelination following deletion of Tsc2 in oligodendrocyte precursors. Ann. Clin. Transl. Neurol., 2, 1041–1054. [DOI] [PMC free article] [PubMed] [Google Scholar]
- 34. Lanerolle N.C., Lee T.S. and Spencer D.D. (2010) Astrocytes and epilepsy. Neurotherapeutics, 7, 424–438. [DOI] [PMC free article] [PubMed] [Google Scholar]
- 35. Hu S., Knowlton R.C., Watson B.O., Glanowska K.M., Murphy G.G., Parent J.M. and Wang Y. (2018) Somatic Depdc5 deletion recapitulates electroclinical features of human focal cortical dysplasia type IIA. Ann. Neurol., 84, 140–146. [DOI] [PMC free article] [PubMed] [Google Scholar]
- 36. Armour E.A., Carson R.P. and Ess K.C. (2012) Cystogenesis and elongated primary cilia in Tsc1-deficient distal convoluted tubules. Am. J. Physiol. Renal Physiol., 303, F584–F592. [DOI] [PMC free article] [PubMed] [Google Scholar]
- 37. Fu C., Cawthon B., Clinkscales W., Bruce A., Winzenburger P. and Ess K.C. (2012) GABAergic interneuron development and function is modulated by the Tsc1 gene. Cereb. Cortex, 22, 2111–2119. [DOI] [PMC free article] [PubMed] [Google Scholar]
- 38. Carson R.P., Fu C., Winzenburger P. and Ess K.C. (2013) Deletion of Rictor in neural progenitor cells reveals contributions of mTORC2 signaling to tuberous sclerosis complex. Hum. Mol. Genet., 22, 140–152. [DOI] [PMC free article] [PubMed] [Google Scholar]
- 39. Ess K.C., Kamp C.A., Tu B.P. and Gutmann D.H. (2005) Developmental origin of subependymal giant cell astrocytoma in tuberous sclerosis complex. Neurology, 64, 1446–1449. [DOI] [PubMed] [Google Scholar]
- 40. Grier M.D., West K.L., Kelm N.D., Fu C., Does M.D., Parker B., McBrier E., Lagrange A.H., Ess K.C. and Carson R.P. (2017) Loss of mTORC2 signaling in oligodendrocyte precursor cells delays myelination. PLoS One, 12, e0188417. [DOI] [PMC free article] [PubMed] [Google Scholar]
- 41. Zeng L.H., Rensing N.R., Zhang B., Gutmann D.H., Gambello M.J. and Wong M. (2011) Tsc2 gene inactivation causes a more severe epilepsy phenotype than Tsc1 inactivation in a mouse model of tuberous sclerosis complex. Hum. Mol. Genet., 20, 445–454. [DOI] [PMC free article] [PubMed] [Google Scholar]
- 42. O'Meara R.W., Ryan S.D., Colognato H. and Kothary R. (2011) Derivation of enriched oligodendrocyte cultures and oligodendrocyte/neuron myelinating co-cultures from post-natal murine tissues. J. Vis. Exp., 54, 3324. [DOI] [PMC free article] [PubMed] [Google Scholar]
- 43. Sandhir R., Onyszchuk G. and Berman N.E. (2008) Exacerbated glial response in the aged mouse hippocampus following controlled cortical impact injury. Exp. Neurol., 213, 372–380. [DOI] [PMC free article] [PubMed] [Google Scholar]
- 44. Schofield C.M., Kleiman-Weiner M., Rudolph U. and Huguenard J.R. (2009) A gain in GABAA receptor synaptic strength in thalamus reduces oscillatory activity and absence seizures. Proc. Natl. Acad. Sci., 106, 7630–7635. [DOI] [PMC free article] [PubMed] [Google Scholar]
- 45. Zhou C., Lippman J.J., Sun H. and Jensen F.E. (2011) Hypoxia-induced neonatal seizures diminish silent synapses and long-term potentiation in hippocampal CA1 neurons. J. Neurosci., 31, 18211–18222. [DOI] [PMC free article] [PubMed] [Google Scholar]
- 46. Krosigk M., Bal T. and McCormick D.A. (1993) Cellular mechanisms of a synchronized oscillation in the thalamus. Science, 261, 361–364. [DOI] [PubMed] [Google Scholar]
- 47. Zhou C., Huang Z., Ding L., Deel M.E., Arain F.M., Murray C.R., Patel R.S., Flanagan C.D. and Gallagher M.J. (2013) Altered cortical GABAA receptor composition, physiology, and endocytosis in a mouse model of a human genetic absence epilepsy syndrome. J. Biol. Chem., 288, 21458–21472. [DOI] [PMC free article] [PubMed] [Google Scholar]
Associated Data
This section collects any data citations, data availability statements, or supplementary materials included in this article.