

Abstract
Tuberous sclerosis complex (TSC) is a rare, autosomal dominant genetic syndrome that confers significantly increased risk for autism spectrum disorder (ASD), with 50–60% of infants with TSC meeting criteria for ASD by 3 years of age. In a previous study of the current longitudinal cohort, we found that infants with TSC who develop ASD (TSC/ASD) evidence decreased cognitive abilities that diverge from infants with TSC and no ASD (TSC/no ASD). We extended this work by asking whether TSC/ASD infants (n=13) differed from TSC/no ASD infants (n=10) and infants with low developmental risk and no ASD (LR; n=21) in their social communication functioning during the first year of life. We measured early ASD symptoms with the Autism Observation Scale for Infants (AOSI) at 9 and 12 months of age. At both ages, infants in the TSC/ASD group had significantly higher AOSI total scores than infants in the TSC/no ASD and LR groups, which were not fully explained by differences in cognitive abilities. Several items on the AOSI at both ages were predictive of ASD outcome, particularly those representing core social communication deficits (e.g., social referencing). Our findings signal the need for further study of this population within the first year and provide strong justification for early identification and early intervention targeting social communication skills in infants with TSC.
Keywords: tuberous sclerosis complex, autism spectrum disorder, Autism Observation Scale for Infants, high-risk infants, early risk markers
Lay Summary:
We examined early signs of autism spectrum disorder (ASD) in infants with tuberous sclerosis complex (TSC), approximately 50% of whom will meet criteria for ASD by age 3. Infants with TSC and ASD showed deficits in social communication behaviors by 9 months of age that were clearly distinguishable from behaviors in infants with TSC who do not develop ASD and low risk infants. Results support the importance of early ASD screening and intervention for infants with TSC.
Introduction
Tuberous sclerosis complex (TSC) is a rare autosomal dominant genetic syndrome associated with a mutation in either the TSC1 or TSC2 gene, resulting in benign hamartomas in a variety of organ systems, including the brain. While substantial variability in neurodevelopmental outcomes exists among infants with TSC, up to 90% of individuals with TSC experience TSC-associated neuropsychiatric disorders, such as intellectual disability, attention deficit/hyperactivity disorder, and autism spectrum disorder [ASD;Curatolo, Moavero, & de Vries, 2015;de Vries et al., 2015]. TSC is one of the most penetrant single gene disorders for ASD, with 50–60% of children with TSC meeting diagnostic criteria for ASD [Jeste et al., 2016]. Moreover, TSC is often diagnosed prenatally or in the early postnatal period through the identification of either cardiac or brain hamartomas [Datta, Hahn, & Sahin, 2008]. Given the strong association with ASD and the capacity to diagnose TSC prior to the onset of atypical development, TSC has been considered an ideal model to prospectively investigate the emergence of ASD within the first years of life [Davis, Peters, Krueger, & Sahin, 2015;Tye, Varcin, Bolton, & Jeste, 2016;Underwood, 2016]. Furthermore, from a clinical standpoint, early diagnosis and high prevalence of ASD necessitates early screening in this population to facilitate referral to early intervention services.
Borrowing from the study design of infants with older siblings with ASD (high-risk siblings), we conducted a prospective, longitudinal study of infants with TSC over the first 3 years of life. In previous work with the current sample, we showed that infants with TSC who developed ASD (TSC/ASD) evidenced lower cognitive abilities at 12 months compared to infants with TSC who did not develop ASD [Jeste et al., 2014]. TSC/ASD infants also exhibited a greater divergence from TSC/no ASD in their cognitive development over the second and third years of life [TSC/no ASD; Jeste et al., 2014]. These findings highlighted the strong overlap between developmental delays and ASD in infants with TSC and raised the question of whether ASD in TSC actually reflects global cognitive delays rather than specific deficits in social communication. To examine the specificity of the ASD diagnosis, we compared the social communication profiles of TSC/ASD toddlers to those of toddlers with non-syndromic ASD [Jeste et al., 2016]. We found that TSC/ASD toddlers shared a pattern of social communication deficits strikingly similar to non-syndromic ASD, yet distinct from TSC/no ASD toddlers [Jeste et al., 2016]. This phenotypic overlap occurred even in the context of developmental delays and epilepsy in the TSC group. It is unclear, however, when these social communication deficits first emerged in these TSC/ASD infants.
The Autism Observation Scale for Infants (AOSI) is a measure that was developed to identify early signs of ASD in high-risk siblings from 6 to 18 months of age [Zwaigenbaum et al., 2005]. The AOSI has been shown to differentiate high-risk siblings with ASD from high-risk siblings without ASD and low-risk controls at 12 and 14 months of age [Gammer et al., 2015;Zwaigenbaum et al., 2005]. Specifically, at 12–14 months, AOSI items related to social communication (e.g., eye contact), visual attention, sensory behaviors, and response to name have been shown to differentiate infants based on ASD outcome [Gammer et al., 2015;Zwaigenbaum et al., 2005]. To date, the AOSI has not predicted ASD outcome in high-risk siblings prior to 12 months of age [Gammer et al., 2015;Zwaigenbaum et al., 2005]. While it is evident that the AOSI is a promising measure of emerging ASD symptoms in high-risk siblings by one year of age, it is not clear whether the AOSI would be similarly clinically useful in other high-risk infant groups, particularly those at even greater risk for global developmental delays and ASD, such as TSC [although see Capal et al., 2017].
In the current study, we asked whether delays in social communication as measured by the AOSI, may be observed within the first year of life in infants with TSC and whether these delays were related to a later diagnosis of ASD. First, we examined whether TSC/ASD infants differ from TSC/no ASD infants and infants with low risk for ASD (LR controls) in their social communication functioning at 9 and 12 months of age, after controlling for differences in cognitive abilities. Second, we conducted an exploratory item-level analysis to investigate which AOSI items best differentiated TSC/ASD infants from TSC/no ASD infants and LR controls. Based on our previous work within this sample, we hypothesized that TSC/ASD infants would show evidence of social communication deficits within the first year of life, as indicated by higher total scores on the AOSI at 9 and 12 months, when compared to TSC/no ASD infants and LR controls. Additionally, based on our previous work demonstrating specific delays in nonverbal cognition in infants with TSC and ASD [Jeste et al., 2014], we expected that these infants would have elevations on AOSI markers of attentional processes and motor domains in addition to social communication domains.
Method
Participants
Infants were enrolled in a multi-site, longitudinal study examining early behavior and brain development in TSC. Infants with TSC were recruited through specialty clinics, newborn nurseries, pediatricians’ offices, and the Tuberous Sclerosis Alliance, and LR controls were recruited through institutional review board (IRB)-approved infant databases, all in the greater Los Angeles and Boston areas. Exclusion criteria for the LR infants included prematurity (<37 weeks gestational age), birth trauma, developmental concerns, or close family history of ASD or intellectual disability. TSC diagnoses were based on clinical presentation (Northrup et al., 2013), with clinical genetics reports available for 31/44 (70%) of the total TSC sample.
Inclusion criteria for the current study included availability of AOSI data at 9 and/or 12 months, measures of cognitive functioning at 9 and/or 12 months, and clinical outcome data at 18, 24, and/or 36 months. Diagnosis of ASD was made based on the Autism Diagnostic Observation Schedule [ADOS; Lord et al., 2000] and clinical best estimate. At one of the outcome visits (the most recent available) infants were classified as: TSC/ASD (n=13), TSC/no ASD (n=10), or LR control (n=21). Of these infants, 17 infants were missing 9-month AOSI data due to enrollment after the 9-month time point; thus, 27 (61%) infants from the total sample (LR n=17, TSC/no ASD n=4, TSC/ASD n=6) were included in 9-month analyses. Participant information is presented in Table 1.
Table 1.
Participant Information by Outcome Group
| Demographic variable n (%) | Total | LR control | TSC/no ASD | TSC/ASD | P |
|---|---|---|---|---|---|
| ASD outcome | 44 | 21 (48%) | 10 (23%) | 13 (30%) | |
| Gender | 0.20 | ||||
| Male | 25 (57%) | 9 (43%) | 7 (70%) | 9 (69%) | |
| Female | 19 (43%) | 12 (57%) | 3 (30%) | 4 (31%) | |
| Race/ethnicity | 0.04* | ||||
| White/Caucasian | 31 (74%) | 19 (90%) | 4 (44%) | 8 (67%) | |
| Hispanic/Latino | 6 (14%) | 2 (22%) | 2 (22%) | 2 (17%) | |
| Black/African-American | 3 (7%) | 0 (0%) | 1 (11%) | 2 (17%) | |
| Asian/Pacific Islander | 2 (5%) | 0 (0%) | 2 (22%) | 0 (0%) | |
| Maternal education | 0.40 | ||||
| High school diploma | 3 (7%) | 0 (0%) | 1 (11%) | 2 (15%) | |
| Associate degree/some college | 7 (16%) | 3 (14%) | 1 (11%) | 3 (23%) | |
| 4-year college/some graduate | 17 (40%) | 8 (38%) | 3 (33%) | 6 (46%) | |
| Advanced/professional degree | 16 (37%) | 10 (48%) | 4 (44%) | 2 (15%) | |
| Seizure information | |||||
| Past/current seizures | 0 (0%) | 8 (80%) | 11 (92%) | 0.43 | |
| Infantile spasms | n/a | 4 (50%) | 9 (75%) | 0.25 | |
| Age (mos) of onset M (SD) | n/a | 3.63 (1.60) | 3.13 (2.87) | 0.67 |
Note.
Significant at P < 0.05 level. ASD outcome based on 18-, 24- or 36-month ADOS and clinical judgment. Chi-square tests examined associations between participant characteristics and group. t-test examined group difference in age of seizure onset. One TSC/no ASD and one TSC/ASD infant were missing race/ethnicity data. One TSC/no ASD infant was missing maternal education data. One TSC/ASD infant and two TSC/no ASD infants were missing infantile spasm data. One TSC/ASD infant was missing seizure onset data.
Overall, infants in the sample were predominantly Caucasian and had mothers with high levels of education. Gender and maternal education did not significantly differ between groups. Race/ethnicity, however, differed by group; there were more Caucasian infants in the LR group than the TSC groups. Of the infants with available seizure data, 8 of 10 infants (80%) in the TSC/no ASD group and 11 of 12 infants (92%) in the TSC/ASD group had experienced at least one seizure by 9 months of age. The average age of seizure onset did not differ between the TSC/no ASD and TSC/ASD groups and there were no significant differences between the groups in the number of infants who had experienced seizures or infantile spasms (see Table 1). No infants in the LR group had any reports of seizures during the course of the study. Of the infants with TSC in the current sample, 56.5% were classified as having ASD. None of the LR controls evidenced significant ASD symptoms at outcome.
Procedure
Prior to data collection, IRB approval was obtained from both study sites (UCLA IRB no. 11–002349; BCH IRB no. P00001144) and informed consent was obtained from all families. For the current study, infants visited the laboratory for an assessment of their social communication functioning (AOSI) and cognitive abilities (Mullen Scales of Early Learning [MSEL]; Mullen, 1995) at 9 and/or 12 months of age. At 18, 24, and/or 36 months, infants visited the laboratory for an outcome assessment to assess cognitive abilities (MSEL) and determine ASD outcome (ADOS). Outcome assessments were administered by trained clinicians or research staff who were experienced working with young children. Children were classified as having ASD on the basis of their ADOS revised algorithm scores [Gotham, Risi, Pickles, & Lord, 2007] exceeding the clinical cutoff for ASD and expert clinical judgment. If a child attended multiple clinical outcome visits, the most recent ADOS score was used to determine their ASD classification. Outcome classification was determined based on the 18-month assessment for 9% of the infants (LR n=3, TSC/no ASD n=0, TSC/ASD n=1), the 24-month assessment for 25% of the infants (LR n=6, TSC/no ASD n=0, TSC/ASD n=5), and the 36-month assessment for 66% of the infants (LR n=12, TSC/no ASD n=10, TSC/ASD n=7). Of these cases, 33 (75%) had an ADOS at more than one time point;29 (88%) of these infants had classifications that were in agreement across the 2–3 available time points, suggesting a high level of diagnostic stability.
Measures
Autism Observation Scale for Infants (AOSI).
The AOSI is a semi-structured, examiner-administered observational measure of early ASD symptomatology intended for infants ranging in age from 6 to 18 months [Bryson, Zwaigenbaum, McDermott, Rombough, & Brian, 2008;Zwaigenbaum et al., 2005]. The AOSI has been shown to provide reliable data [Bryson et al., 2008] that relates to later ASD symptoms and diagnosis [Gammer et al., 2015; Zwaigenbaum et al., 2005]. Infants are seated across a table from an examiner with a standard set of objects that are used across seven activities. Infants’ responses to specific presses and observations made by the examiner throughout the assessment are used to code 19 items. Each item is given a score of 0–2 or 0–3, with a 0 representing typical behavior and a 1–3 indexing atypical behavior with varying levels of severity. The AOSI was administered by research-reliable examiners at both sites. Infants’ 9-month and 12-month AOSI total scores (max score=44) and item-level data were used in analyses.
Mullen Scales of Early Learning (MSEL).
The MSEL is a standardized measure of early cognitive abilities for children from birth to 68 months of age (Mullen, 1995). The MSEL examines five developmental domains: gross motor, fine motor, visual reception, receptive language, and expressive language, and yields an Early Learning Composite (ELC; M=100, SD=15) that represents a child’s cognitive ability across the latter four subscales. Given the previously documented group differences in MSEL scores in the larger sample [Jeste et al., 2014], ELC was included as a covariate in primary analyses.
Analysis Plan
To retain participants with data at only 9 or 12 months, each age was examined separately. Following preliminary analyses, analysis of covariance (ANCOVA) models were conducted to assess group differences in 9-month and 12-month AOSI total scores,1 while controlling for MSEL ELC. Significant main effects of group were followed up with t-tests examining differences between each group pair (TSC/ASD vs. TSC/no ASD, TSC/ASD vs. LR, TSC/no ASD vs. LR). False discovery rate (FDR) correction [Benjamini & Hochberg, 1995] was applied to correct for multiple comparisons in post hoc analyses within each age. We then conducted a series of Mann-Whitney non-parametric tests to contrast individual AOSI items between groups within each age. The TSC/no ASD and LR groups were combined for item-level analyses. FDR correction was applied to correct for multiple comparisons in item-level analyses within each age.
Results
Preliminary Analyses
Preliminary analyses assessed inter-correlations among study variables, gender differences in AOSI, and group differences in MSEL (see Table 2). The 9-month and 12-month AOSI and MSEL scores were highly correlated over time, both within and across assessments. AOSI scores did not differ by gender;therefore, gender was not included as a covariate in analyses. The TSC/ASD group had significantly lower MSEL ELC scores compared to the LR group at 9 months, P < 0.01. At 12 months, all groups differed significantly from each other, with the TSC/ASD group evidencing the lowest scores (P < 0.001 vs. LR, P < 0.01 vs. TSC/no ASD), followed by the TSC/no ASD group (P < 0.01 vs. LR), and the LR group who had the highest scores. These results justified our planned inclusion of MSEL ELC score as a covariate in our primary analysis.
Table 2.
Results of Preliminary Analyses
| Variable | 1 | 2 | 3 | 4 |
|---|---|---|---|---|
| 1. 9-month AOSI score | – | .83*** | .61** | −.81*** |
| 2. 12-month AOSI score | – | .66*** | −.66*** | |
| 3. 9-month MSEL score | – | .80*** | ||
| 4. 12-month MSEL score | ||||
| Variable M (SD) | Male | Female | ||
| 9-month AOSI score | 8.07 (6.72) | 6.08 (6.13) | ||
| 12-month AOSI score | 5.68 (5.84) | 5.37 (5.40) | ||
| Variable M (SD) | LR control | TSC/no ASD | TSC/ASD | |
| 9-month MSEL score ** | 110.82 (14.61)a | 89.75 (20.25) | 76.80 (22.99)b | |
| 12-month MSEL score *** | 107.10 (10.29)a | 87.50 (16.53)b | 68.39 (14.49)c | |
| 9-month AOSI score*** | 4.47 (2.62)a | 3.50 (3.87)a | 17.00 (5.51)b | |
| 12-month AOSI score** | 3.29 (3.32)a | 2.80 (2.57)a | 11.31 (6.13)b | |
Note. Sample size for correlations ranged from n=26–27. MSEL score from 12 months was used in primary analyses for one infant missing 9-month MSEL. AOSI=Autism Observation Scale for Infants. AOSI total score used in analyses. MSEL=Mullen Scales of Early Learning. ELC=Early Learning Composite. ELC used in analyses. Group differences in MSEL scores examined with ANOVAs. Gender differences in AOSI scores examined with t-tests.
Denote significant differences between groups in post hoc analyses.
P < 0.01
P < 0.001
Group Differences in AOSI Scores
At 9 months, AOSI scores significantly differed by group, F(2, 23)=15.63, P < 0.001, partial η2=.58, after covarying MSEL ELC score, F(1, 23)=6.02, P < 0.05, partial η2=.21. Post hoc analyses revealed that the TSC/ASD group had significantly higher AOSI scores than the LR group t(5.82)=−5.36, P=0.004 (equal variances not assumed), and the TSC/no ASD group, t(8)=−4.22, P=0.004. The LR and TSC/no ASD groups did not differ, t(19)=.61, P=0.55.
At 12 months, AOSI scores again differed by group, F(2, 40)=5.76, P < 0.01, partial η2=.22, after covarying MSEL ELC score, F(1, 40)=9.66, P < 0.01, partial η2=.20. Post hoc analyses revealed that the TSC/ASD group had significantly higher AOSI scores than the LR group, t(16.43)=−4.34, P < 0.001 (equal variances not assumed), and the TSC/no ASD group, t(16.94)=−4.51, P < 0.001 (equal variances not assumed). The LR and TSC/no ASD groups did not differ, t(29)=.41, P=0.69. Descriptive information is presented in Table 2 and Figure 1.
Figure 1.
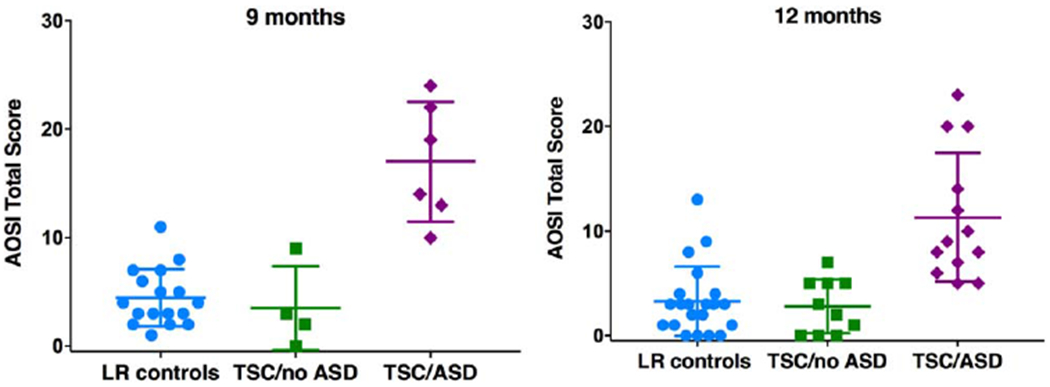
AOSI total, scores by ASD outcome group at 9 and 12 months of age.
AOSI Item-Level Analyses
Several AOSI items significantly differentiated the TSC/ASD group from the combined TSC/no ASD and LR (no ASD) group at 9 and 12 months, following correction for multiple comparisons (see Table 3 and Fig. 2). A total of 11 AOSI items at 9 months and 7 AOSI items at 12 months differentiated the groups based on ASD outcome. Higher scores (greater impairment) in Social Referencing, Engagement of Attention, Eye Contact, Social Interest and Shared Affect, and Motor Control and Behavior were more commonly present in the TSC/ASD group than the no ASD group at both ages. At 9 months only, Anticipatory Responses, Reciprocal Social Smile, Coordination of Gaze and Action, Differential Response to Facial Emotion, Disengagement of Attention, and Reactivity significantly differentiated the groups. At 12 months only, Orients to Name, Social Babbling, and Atypical Sensory Behaviors were higher in the TSC/ASD group than the no ASD group. Social Referencing appeared to be the strongest predictor of ASD outcome, with the largest effect size at 9 months (Cohen’s d=2.56) and second largest at 12 months (Cohen’s d=1.22).
Table 3.
AOSI Item-Level Analysis Results
| 9 months |
12 months |
|||
|---|---|---|---|---|
| AOSI Item | P | Cohen’s d | P | Cohen’s d |
| 1. Visual tracking | 0.06 | .95 | 0.11 | .53 |
| 2. Disengagement of attention | <0.01** | 1.33 | 0.07 | .71 |
| 3. Orients to name | 0.10 | .86 | 0.006** | 1.07 |
| 4. Differential response to emotion | <0.01** | 1.28 | 0.12 | .56 |
| 5. Anticipatory responses | <0.001*** | 1.76 | 0.06 | .67 |
| 6. Imitation of action | 0.10 | .78 | 0.11 | .53 |
| 7. Social babbling | 0.11 | .81 | 0.005** | 1.26 |
| 8. Eye contact | <0.01** | 1.35 | 0.006** | .93 |
| 9. Reciprocal social smile | 0.004** | 1.90 | 0.12 | .45 |
| 10. Coordination of gaze/action | 0.004** | 1.16 | 0.07 | .59 |
| 11. Reactivity | 0.04* | 1.08 | 0.56 | .37 |
| 12. Social interest/shared affect | 0.02* | 1.32 | 0.008** | .94 |
| 13. Transitions | 0.47 | .45 | 0.69 | .05 |
| 14. Motor control/behavior | 0.03* | 1.13 | 0.005** | 1.04 |
| 15. Atypical motor behaviors | 0.37 | .36 | 0.06 | .69 |
| 16. Atypical sensory behaviors | 0.08 | .72 | 0.04* | .76 |
| 17. Engagement of attention | <0.001*** | 1.58 | <0.001*** | 1.05 |
| 18. Insistence on particular objects | 1.00 | n/a | 0.66 | .17 |
| 19. Social referencing | <0.001*** | 2.56 | <0.001*** | 1.22 |
Note. P values reflect results from Mann-Whitney non-parametric tests (chosen due to violations of normality and homogeneity of variance assumptions of GLM tests), which contrasted the TSC/ASD group with the combined TSC/no ASD and LR (no ASD) group. At 9 months, 27 infants (ASD n=6, no ASD n=21) included in analyses. At 12 months, 44 infants (ASD n=13, no ASD n=31) included in analyses.
Significant at P < 0.05 level (corrected),
Significant at P < .01 level (corrected),
Significant at P < 0.001 level (corrected).
Figure 2.
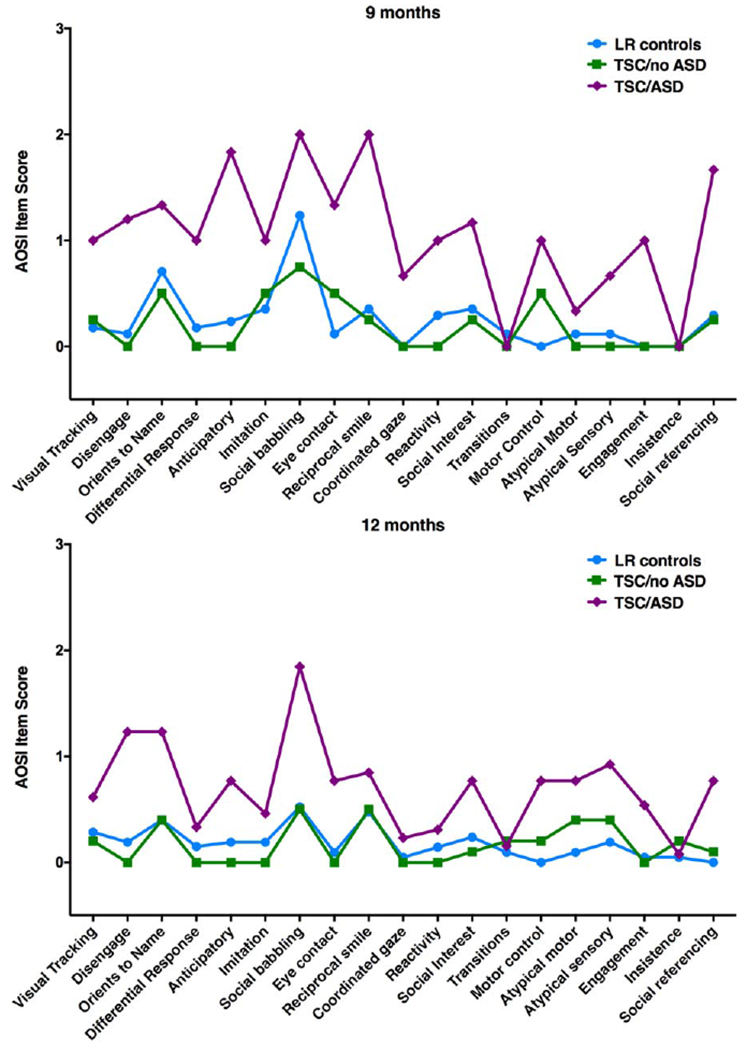
AOSI item profiles by ASD outcome group at 9 and 12 months of age. AOSI items were rated on 0–2 or 0–3 scale.
Discussion
We found that atypical social communication skills emerge with in the first year of life in infants with TSC. At 9 months of age, TSC/ASD infants showed significantly elevated scores on the AOSI compared to TSC/no ASD infants and LR controls. Elevated AOSI scores in TSC/ASD infants were not fully explained by differences in cognitive abilities. We also explored whether particular AOSI items differentiate TSC/ASD infants from the TSC and LR infants without ASD. We found that several items on the AOSI at 9 and 12 months of age were predictive of ASD outcome, particularly those representing core social communication deficits (e.g., social referencing). These findings suggest that infants with TSC who develop ASD are quite distinct in their social development within the first year of life compared to infants with TSC who do not develop ASD and infants at low risk for atypical development.
The AOSI was developed and has primarily been studied in a different autism risk group, namely infants at high familial risk based on the presence of an older sibling with ASD [Bryson et al., 2008;Zwaigenbaum et al., 2005]. Nearly 20% of high-risk siblings will meet criteria for ASD by age 3 [Ozonoff et al., 2011], and another approximately 20% will show evidence of subclinical symptoms of ASD or developmental delays that are indicative of a broader autism phenotype [Charman et al., 2016;Messinger et al., 2013]. The AOSI total score has distinguished high-risk siblings who develop ASD from infants without ASD at 12 and 14 months of age, but not prior to 1 year [Gammer et al., 2015;Zwaigenbaum et al., 2005]. Here, we found that the AOSI was also sensitive to emerging ASD symptoms within the first year in infants with TSC, even in the context of comorbid cognitive delays and epilepsy. This finding highlights the robustness of the AOSI as an early ASD screening device in infants across risk groups and with comorbid developmental delays.
In order to more deeply examine the profile of behaviors that were most predictive of eventual ASD classification, we conducted an individual AOSI item analysis. Many of the items that best distinguished infants with ASD outcomes reflected the very early emergence of measurable deviations from typical social development. For instance, TSC/ASD infants were more likely than TSC and LR infants without ASD, at both 9 and 12 months, to show substantial deficits in social referencing, eye contact, and social interest and shared enjoyment—core aspects of the ASD phenotype. There were also behavioral differences in social communication functioning that were specific to each age, such as orienting to name and social babbling at 12 months, which likely reflect the changing expectations and emergence of developmentally relevant social behaviors as infants grow older. TSC/ASD infants were also more likely to evidence “sticky attention” and impaired motor control at both ages, supporting the need to further examine the relation between ASD and other core developmental domains in genetically enriched groups, such as TSC, where global developmental delay and ASD often co-occur. Although early impairment in these core developmental domains may provide a shared basis for multiple aspects of atypical neurodevelopmental outcomes, divergence in development of social communication skills also seems to unfold early in infancy in TSC.
Our results may support the notion that infants with emerging ASD share common indices of atypical social communication skills regardless of their mechanism of risk (in this case, single gene disorder vs. familial risk). In studies of high-risk siblings, by late infancy (12–14 months), high-risk siblings with ASD outcomes also show deficits in core social behaviors, such as social referencing or orienting to name [Gammer et al., 2015; Zwaigenbaum et al., 2005]. Earlier in infancy (7 months), infants who show deficits in social referencing and visual tracking are more likely to have ASD outcomes [Gammer et al., 2015; although see Zwaigenbaum et al., 2005]. In the current study, albeit in a small preliminary sample, we found compelling evidence of widespread deficits in these core areas of social communication in TSC/ASD infants. Despite strict control for multiple comparisons, a total of 14 items on the AOSI, including 11 items at 9 months of age, clearly differentiated TSC/ASD infants from both LR controls and TSC/no ASD infants.
Our results further support a prototypical ASD phenotypic profile in infants and children with TSC, consistent with our examination of social communication profiles, as measured through ADOS items, in this sample at later ages [Jeste et al., 2016]. Here, we did not directly compare infants with TSC with other risk groups, but the fact that behavioral markers from the AOSI differentiated subgroups in TSC reinforces the value of TSC as a genetically defined model for the early emergence of ASD. The convergence of autism symptoms across risk groups (TSC and high-risk siblings) and diagnostic groups (TSC/ASD and nonsyndromic ASD) raises a critical question: Are the core symptoms of ASD preserved across the heterogeneous genetic and neurobiological causes of ASD? The answer is most likely no, as studies in other syndromic forms of ASD have identified distinct profiles in social communication skills that may be rooted in other core developmental delays, such as motor deficits or overall cognitive impairment [DiStefano et al, 2016]. However, in most syndromic forms of ASD, behavioral diagnoses precede genetic testing, precluding prospective natural history studies of early infancy. In TSC, we have a unique opportunity to study the unfolding of ASD in early infancy because genetic diagnosis precedes neuro-developmental outcomes, and we find delays and deficits as early as we can reliably measure social communication and cognitive profiles.
In order to better disentangle the exact timing and mechanism of these earliest signs of atypical development in TSC, we need to investigate the neural and genetic mechanisms that underlie these early behavioral deficits. These studies must be rooted in the examination of neural circuitry, as both preclinical and clinical studies of TSC confirm aberrant long range and local neural connectivity, abnormal axon guidance, and delayed myelination in TSC [Im et al., 2016;Krishnan et al., 2010;Makki, Chugani, Janisse, & Chugani, 2007; Meikle et al., 2007;Peters et al., 2012;Nie et al., 2010]. Large scale imaging studies in high-risk siblings have shown that early disruptions in brain development precede atypical behaviors, with findings demonstrating differences in basic processes such as long range connections, functional connectivity, corpus callosum volume and structure, and cortical surface volume [Emerson et al., 2017; Hazlett et al., 2017; Wolff et al., 2012, 2015]. Whether the neurobiological processes in TSC converge with infants with familial risk (or other high risk groups) must be examined through direct comparisons of these groups. Given the differences in underlying genetic mechanisms across risk groups, we propose that neuroimaging of these infants (through EEG and MRI) will capture the heterogeneity in the neural pathways that ultimately lead to converging behaviors.
An interesting deviation of the current study from the high-risk sibling literature is that we did not find evidence of subtle social communication deficits in the infants with TSC who did not have ASD outcomes, a finding that is also consistent with our previous examination of later ADOS profiles in these children [Jeste et al., 2016]. So, despite evidence of early cognitive deficits [Jeste et al., 2014], the social communication development of many infants with TSC does not deviate from typically developing infants in a substantial way, at least early in life. This finding lies in contrast with studies of other syndromic forms of ASD, such as Fragile X Syndrome, where infants who did not develop ASD evidenced elevations on the AOSI at 9 months [Hogan et al., 2017]. The spared social communication development of TSC/no ASD infants, therefore, provides a unique opportunity to examine resilience, or the biological, behavioral, and environmental factors that may protect some infants with TSC from adverse neurodevelopmental outcomes. Understanding these mechanisms of resilience could greatly inform strategies to alter developmental trajectories in those infants demonstrating red flags for ASD.
Our results, as well as comparable findings from a recent report on the use of the AOSI in infants with TSC [Capal et al., 2017], strongly justify the need for and utility of ASD screening of infants with TSC within the first year of life. The infants with TSC who later developed ASD showed a clear pattern of differentiation in their social communication development by 9 months of age from infants with TSC who did not develop ASD. Given the benefits of early intervention [Dawson et al., 2010; Green et al., 2015;Green et al., 2017] and our evidence of deficits in core areas of social communication development, it is essential that we design rigorous, large-scale studies of early screening and intervention for infants with TSC in the first year of life. Moreover, future studies should investigate whether current early interventions for toddlers with ASD are similarly effective in children with TSC.
While our study is an important first step in describing the emergence of social communication deficits in infants with TSC, it has limitations that should be acknowledged. Given the rare nature of TSC, our sample size was small, especially at these early ages. While the current findings were robust enough to overcome sample size limitations, results should be interpreted with caution and require replication within a larger sample. Given the small sample size, we were unable to determine which AOSI items were most specific to ASD, above and beyond group differences in cognitive ability. To maximize sample size, we included infants whose outcome classifications were determined prior to 36 months (34% of sample). Given the reduced stability of diagnoses made prior to 3 years, it is possible that some of these infants may have been classified differently if we had the opportunity to re-assess them at an older age. Finally, given the clear evidence of social communication deficits at 9 months, it is likely that TSC/ASD infants show behavioral differences even earlier in life. Future studies of this population should make a concerted effort to study the brain and behavioral development of these infants within the first nine months of life.
In sum, this study examined whether infants with TSC who later developed ASD differed from infants with TSC who did not develop ASD and low-risk controls in their social communication functioning during the first year of life. We found robust evidence that TSC/ASD infants show clear social communication deficits, as measured by the AOSI, by 9 months of age. These deficits were characterized by deviations in core areas of social development, including social referencing and shared enjoyment. Our findings signal the need for further study of this population within the first year and provide compelling evidence of the need for early intervention targeting social communication skills in infants with TSC.
Acknowledgments
The research reported in this article was supported by grants from the Department of Defense (DOD CDMRP TSCRP: 2011-2014) and the UCLA CTRC (UL1TR000124). The authors acknowledge the contributions of Scott Huberty and Lauren Baczewski, along with the broader TSC study team, in recruitment and data collection. We thank the families who participated in this research.
Grant sponsor: Department of Defense; Grant number: DOD CDMRP TSCRP: 2011-2014; Grant sponsor: UCLA CTRC; Grant number: UL1TR000124.
Conflict of Interest
S.S.J. serves as a consultant for Roche Pharmaceuticals and on the professional advisory board for the Tuberous Sclerosis Alliance. J.W. also serves on the professional advisory board for the Tuberous Sclerosis Alliance, and has received honoraria from and serves on the scientific advisory board and the speakers’ bureau for Novartis Pharmaceuticals Inc. and Lundbeck. M.S. receives research support from Novartis, Roche, Pfizer and LAM Therapeutics and has served on the Scientific Advisory Board of Sage Therapeutics. The remaining authors (N.M.M., K.J.V., R.B., C.A.N.) do not have any conflicts of interest associated with this study.
Footnotes
Results were equivalent when AOSI number of markers was used as the dependent variable.
Contributor Information
Nicole M. McDonald, UCLA Semel Institute of Neuroscience and Human Behavior, David Geffen School of Medicine, 760 Westwood Plaza, Los Angeles, CA 90095.
Kandice J. Varcin, Telethon Kids Institute, University of Western Australia, 100 Roberts Road, Subiaco, WA 6008, Australia.
Rujuta Bhatt, UCLA Semel Institute of Neuroscience and Human Behavior, David Geffen School of Medicine, 760 Westwood Plaza, Los Angeles, CA 90095.
Joyce Y. Wu, Division of Pediatric Neurology, UCLA Mattel Children’s Hospital, David Geffen School of Medicine, 10833 Le Conte Ave, MDCC Room 22-474, Los Angeles, CA 90095
Mustafa Sahin, Department of Neurology, Boston Children’s Hospital, Translational Neuroscience Center, 300 Longwood Avenue, Boston, MA 02115.
Charles A. Nelson, III, Division of Developmental Medicine, Boston Children’s Hospital, Harvard Medical School & Harvard Graduate School of Education, Harvard University, 1 Autumn Street, Boston, MA 02215.
Shafali S. Jeste, UCLA Semel Institute of Neuroscience and Human Behavior, David Geffen School of Medicine, 760 Westwood Plaza, Los Angeles, CA 90095
References
- Benjamini Y, & Hochberg Y (1995). Controlling the false discovery rate: A practical and powerful approach to multiple testing. Journal of the Royal Statistical Society. Series B (Methodological), 57, 289–300. [Google Scholar]
- Bryson SE, Zwaigenbaum L, McDermott C, Rombough V, & Brian J (2008). The Autism Observation Scale for Infants: Scale development and reliability data. Journal of Autism and Developmental Disorders, 38, 731–738. [DOI] [PubMed] [Google Scholar]
- Capal JK, Horn PS, Murray DS, Byars AW, Bing NM, Kent B, … Darcy A (2017). Utility of the autism observation scale for infants in early identification of autism in tuberous sclerosis complex. Pediatric Neurology. [DOI] [PMC free article] [PubMed] [Google Scholar]
- Charman T, Young GS, Brian J, Carter A, Carver LJ, Chawarska K, … Zwaigenbaum L (2016). Non-ASD outcomes at 36 months in siblings at familial risk for autism spectrum disorder (ASD): A baby siblings research consortium (BSRC) study. Autism Research, 10, 169–178. [DOI] [PMC free article] [PubMed] [Google Scholar]
- Curatolo P, Moavero R, & de Vries PJ (2015). Neurological and neuropsychiatric aspects of tuberous sclerosis complex. Lancet Neurology, 14, 733–745. [DOI] [PubMed] [Google Scholar]
- Datta AN, Hahn CD, & Sahin M (2008). Clinical presentation and diagnosis of tuberous sclerosis complex in infancy. Journal of Child Neurology, 23, 268–273. [DOI] [PubMed] [Google Scholar]
- Davis PE, Peters JM, Krueger DA, & Sahin M (2015). Tuberous sclerosis: A new frontier in targeted treatment of autism. Neurotherapeutics, 12, 572–583. [DOI] [PMC free article] [PubMed] [Google Scholar]
- Dawson G, Rogers S, Munson J, Smith M, Winter J, Greenson J, … Varley J (2010). Randomized, controlled trial of an intervention for toddlers with autism: The Early Start Denver Model. Pediatrics, 125, e17–e23. [DOI] [PMC free article] [PubMed] [Google Scholar]
- de Vries PJ, Whittemore VH, Leclezio L, Byars AW, Dunn D, Ess KC, … Jansen A (2015). Tuberous sclerosis associated neuropsychiatric disorders (TAND) and the TAND Checklist. Pediatric Neurology, 52, 25–35. [DOI] [PMC free article] [PubMed] [Google Scholar]
- DiStefano C, Gulsrud A, Huberty S, Kasari C, Cook E, Reiter LT, … Jeste SS (2016). Identification of a distinct developmental and behavioral profile in children with Dup15q syndrome. Journal of Neurodevelopmental Disorders, 8, 19. [DOI] [PMC free article] [PubMed] [Google Scholar]
- Emerson RW, Adams C, Nishino T, Hazlett HC, Wolff JJ, Zwaigenbaum L, … Piven J (2017). Functional neuroimaging of high-risk 6-month-old infants predicts a diagnosis of autism at 24 months of age. Science Translational Medicine, 9. [DOI] [PMC free article] [PubMed] [Google Scholar]
- Gammer I, Bedford R, Elsabbagh M, Garwood H, Pasco G, Tucker L, … Charman T. (2015). Behavioural markers for autism in infancy: Scores on the Autism Observational Scale for Infants in a prospective study of at-risk siblings. Infant Behavior and Development, 38, 107–115. [DOI] [PMC free article] [PubMed] [Google Scholar]
- Gotham K, Risi S, Pickles A, & Lord C (2007). The Autism Diagnostic Observation Schedule: Revised algorithms for improved diagnostic validity. Journal of Autism and Developmental Disorders, 37, 613–627. [DOI] [PubMed] [Google Scholar]
- Green J, Charman T, Pickles A, Wan MW, Elsabbagh M, Slonims V, … Johnson MH. (2015). Parent-mediated intervention versus no intervention for infants at high risk of autism: A parallel, single-blind, randomised trial. The Lancet Psychiatry, 2, 133–140. [DOI] [PMC free article] [PubMed] [Google Scholar]
- Green J, Pickles A, Pasco G, Bedford R, Wan MW, Elsabbagh M, … Johnson MH. (2017). Randomised trial of a parent-mediated intervention for infants at high risk for autism: Longitudinal outcomes to age 3 years. Journal of Child Psychology and Psychiatry. doi: 10.1111/jcpp.12728. [DOI] [PMC free article] [PubMed] [Google Scholar]
- Hazlett HC, Gu H, Munsell BC, Kim SH, Styner M, Wolff JJ, … Piven J (2017). Early brain development in infants at high risk for autism spectrum disorder. Nature, 542, 348–351. [DOI] [PMC free article] [PubMed] [Google Scholar]
- Hogan AL, Caravella KE, Ezell J, Rague L, Hills K, & Roberts JE (2017). Autism spectrum disorder symptoms in infants with fragile X syndrome: A prospective case series. Journal of Autism and Developmental Disorders, 47, 16281644. [DOI] [PMC free article] [PubMed] [Google Scholar]
- Im K, Ahtam B, Haehn D, Peters JM, Warfield SK, Sahin M, & Ellen Grant P (2016). Altered structural brain networks in tuberous sclerosis complex. Cerebral Cortex, 26, 2046–2058. [DOI] [PMC free article] [PubMed] [Google Scholar]
- Jeste SS, Varcin KJ, Hellemann GS, Gulsrud AC, Bhatt R, Kasari C, … Nelson CA (2016). Symptom profiles of autism spectrum disorder in tuberous sclerosis complex. Neurology, 87, 766–772. [DOI] [PMC free article] [PubMed] [Google Scholar]
- Jeste SS, Wu JY, Senturk D, Varcin K, Ko J, McCarthy B, … Nelson CA. (2014). Early developmental trajectories associated with ASD in infants with tuberous sclerosis complex. Neurology, 83, 160–168. [DOI] [PMC free article] [PubMed] [Google Scholar]
- Krishnan ML, Commowick O, Jeste SS, Weisenfeld N, Hans A, Gregas MC, … Waarfield SK. (2010). Diffusion features of white matter in tuberous sclerosis with tractography. Pediatric Neurology, 42, 101–106. [DOI] [PMC free article] [PubMed] [Google Scholar]
- Lord C, Risi S, Lambrecht L, Cook EH Jr., Leventhal BL, DiLavore PC, … Rutter (2000). The autism diagnostic observation schedule-generic: A standard measure of social and communication deficits associated with the spectrum of autism. Journal of Autism and Developmental Disorders, 30, 205–223. [PubMed] [Google Scholar]
- Makki MI, Chugani DC, Janisse J, & Chugani HT (2007). Characteristics of abnormal diffusivity in normal-appearing white matter investigated with diffusion tensor MR imaging in tuberous sclerosis complex. American Journal of Neuroradiology, 28, 1662–1667. [DOI] [PMC free article] [PubMed] [Google Scholar]
- Messinger D, Young GS, Ozonoff S, Dobkins K, Carter A, Zwaigenbaum L, … Sigman M (2013). Beyond autism: A baby sibling’s research consortium study of high-risk children at three years of age. Journal of the American Academy of Child & Adolescent Psychiatry, 52, 300–308e301. [DOI] [PMC free article] [PubMed] [Google Scholar]
- Meikle L, Talos DM, Onda H, Pollizzi K, Rotenberg A, Sahin M, … Kwiatkowski DJ. (2007). A mouse model of tuberous sclerosis: Neuronal loss of TSC1 causes dysplastic and ectopic neurons, reduced myelination, seizure activity, and limited survival. Journal of Neuroscience, 27, 5546–5558. [DOI] [PMC free article] [PubMed] [Google Scholar]
- Nie D, Di Nardo A, Han JM, Baharanyi H, Kramvis I, Huynh T, … Sahin M (2010). TSC2-Rheb signaling regulates EphA-mediated axon guidance. Nature Neuroscience, 13, 163–172. [DOI] [PMC free article] [PubMed] [Google Scholar]
- Northrup H, Krueger DA, & International Tuberous Sclerosis Complex Consensus, G. (2013). Tuberous sclerosis complex diagnostic criteria update: Recommendations of the 2012 Iinternational Tuberous Sclerosis Complex Consensus Conference. Pediatric Neurology, 49, 243–254. [DOI] [PMC free article] [PubMed] [Google Scholar]
- Ozonoff S, Young GS, Carter A, Messinger D, Yirmiya N, Zwaigenbaum L, … Stone WL. (2011). Recurrence risk for autism spectrum disorders: A Baby Siblings Research Consortium study. Pediatrics, 128, e488–e495. [DOI] [PMC free article] [PubMed] [Google Scholar]
- Peters JM, Sahin M, Vogel-Farley VK, Jeste SS, Nelson CA 3rd, Gregas MC, … Warfield SK. (2012). Loss of white matter microstructural integrity is associated with adverse neurological outcome in tuberous sclerosis complex. Academic Radiology, 19, 17–25. [DOI] [PMC free article] [PubMed] [Google Scholar]
- Tye C, Varcin K, Bolton P, & Jeste SS (2016). Early developmental pathways to autism spectrum disorder in tuberous sclerosis complex. Advances in Autism, 2, 84–93. [Google Scholar]
- Underwood L (2016). Advances in tuberous sclerosis complex (TSC) research. Advances in Autism, 2, 59–69. [Google Scholar]
- Wolff JJ, Gu H, Gerig G, Elison JT, Styner M, Gouttard S, … Piven J (2012). Differences in white matter fiber tract development present from 6 to 24 months in infants with autism. American Journal of Psychiatry, 169, 589–600. [DOI] [PMC free article] [PubMed] [Google Scholar]
- Wolff JJ, Gerig G, Lewis JD, Soda T, Styner MA, Vachet C, … Piven J (2015). Altered corpus callosum morphology associated with autism over the first 2 years of life. Brain, 138, 2046–2058. [DOI] [PMC free article] [PubMed] [Google Scholar]
- Zwaigenbaum L, Bryson S, Rogers T, Roberts W, Brian J, & Szatmari P (2005). Behavioral manifestations of autism in the first year of life. International Journal of Developmental Neuroscience, 23, 143–152. [DOI] [PubMed] [Google Scholar]