

Abstract
Biomaterials in regenerative medicine are designed to mimic and modulate tissue environments to promote repair. Biologic scaffolds (derived from decellularized tissue extracellular matrix) promote a wound-healing (proregenerative) immune phenotype and are used clinically to treat tissue loss, including in the context of tumor resection. It is unknown whether a biomaterial microenvironment that encourages tissue formation may also promote tumor development. We implanted a urinary bladder matrix (UBM) scaffold, which is used clinically for wound management, with syngeneic cancer cell lines in mice to study how wound-healing immune responses affect tumor formation and sensitivity to immune checkpoint blockade. The UBM scaffold created an immune microenvironment that inhibited B16-F10 melanoma tumor formation in a CD4+ T cell-dependent and macrophage-dependent manner. In-depth immune characterization revealed an activated type 2-like immune response that was distinct from the classical tumor microenvironment, including activated type 2 T helper T cells, a unique macrophage phenotype, eosinophil infiltration, angiogenic factors, and complement. Tumor growth inhibition by PD-1 and PD-L1 checkpoint blockade was potentiated in the UBM scaffold immune microenvironment. Engineering the local tumor microenvironment to promote a type 2 wound-healing immune signature may serve as a therapeutic target to improve immunotherapy efficacy.
INTRODUCTION
Regenerative medicine therapies are designed to repair and replace damaged tissues. However, a lingering question in the field is whether promoting new tissue development may also encourage cancer progression (1, 2). Biologic scaffold materials derived from the complex extracellular matrix (ECM) of tissues have been shown to promote tissue repair in numerous preclinical models and over decades of clinical practice (3). Composed of the numerous structural and signaling elements of mammalian ECM, these scaffolds facilitate wound-healing processes such as cell proliferation, angiogenesis, stem cell recruitment, and modulation of the innate and adaptive immune system (3–6) to promote nonfibrotic tissue formation (7). Biologic scaffolds are especially relevant in surgical oncology where tissue-derived matrices have been implanted to replace and reconstruct tissue voids that are left in patients after tumor resection. Mastectomy after breast cancer, dura repair after meningioma, and reepithelialization after esophageal cancer resection are clinical examples of surgical interventions that have used biologic scaffolds to aid in repair (8–12). Although these applications potentially place scaffold materials in close proximity to residual cancer cells at resection margins, little is known about whether a prohealing environment—specifically, a biologic scaffold microenvironment—influences tumor formation.
Although favorable to tissue reconstruction, many wound-healing processes play prominent roles in the progression of solid tumors (13). Fibroblasts, endothelial cells, and immune cells are necessary for tissue healing but can be co-opted to enable tumor progression (14) Immune cells in particular can play opposing roles in a tumor: clearance of cancer cells versus promotion of tumor growth. Pro-inflammatory type 1 immune responses are traditionally thought to be the most relevant to tumor clearance (15), and many cancer immunotherapies are designed to augment type 1 immune responses that involve cytotoxic T cells, type 1 T helper (TH1) cells, and Ml macrophages to eliminate tumors. However, the biologic scaffold microenvironment is characterized by TH2-skewed T cells and an intense myeloid cell infiltrate that includes M2 macrophage polarization (6, 16). These elements of type 2 immunity are often associated with a tumor-permissive environment (17). Contrary to this assumption, ECM materials have not been shown to promote tumor formation in experimental animal models (18) nor in humans, despite a type 2 immune bias. This suggests that the biologic scaffold microenvironment may have tumor-suppressive characteristics. Furthermore, as immune-stimulating cancer immunotherapy such as immune checkpoint inhibition becomes more prevalent as a neoadjuvant to surgery, it will be necessary to understand whether amplifying the prohealing ECM immune response is productive in a cancer environment. A scaffold environment that can both promote healing after tumor resection and aid in cancer therapy would advance surgical oncology and reconstruction practices.
Few studies have examined ECM materials in the cancer environment, and it remains unknown what aspects of the ECM immune microenvironment influence tumor progression. The present study investigates a U.S. Food and Drug Administration-cleared proregenerative urinary bladder ECM (UBM) material for its effect on tumor formation, the immunophenotypic determinants of biologic scaffold cancer response, and potential interactions with checkpoint blockade immunotherapy.
RESULTS
UBM implantation inhibits tumor formation of syngeneic cancer cell lines
UBM is a biologic scaffold composed of the decellularized basement membrane and tunica propria layers of porcine urinary bladder with a previously defined structure and proteomic composition (19, 20). Sheets of UBM can be comminuted into small particles that retain a lamellar microscale sheet architecture with sizes ranging between 20 and 150 μm in largest diameter (Fig. 1A). UBM particles are hydrated and suspended in saline solution as an injectable formulation to fill and repair three-dimensional tissue defects. Biologic scaffolds have been prepared from numerous mammalian (allogeneic and xenogeneic) sources (6); however, appropriately processed ECM materials apparently elicit comparable repair outcomes in many instances (7).
Fig. 1. Tissue-derived UBM particles inhibit tumor formation in a CD4+ T cell-dependent manner.

(A) Scanning electron microscopy (SEM; top view and side view) of decellularized bladder (UBM) particles. UBM particles were hydrated and injected with cancer cell lines into mice to monitor the effect the UBM microenvironment on tumor formation. Tumor volume and survival in (B) B16-F10 melanoma (C57BL/6 mice; n = 5) and (C) CT26 colon carcinoma (BALB/c mice; n = 5). (D) Bioluminescence imaging of luciferase-expressing B16-F10 melanoma cells 1 to 5 days after implantation with saline or UBM in mice. (E) Histologic and macroscopic appearance of B16–F10 tumors at a similar external size (200 mm3) with saline or UBM implantation [hematoxylin and eosin (H&E) stain; 50x mosaic images left; 200x bottom right]. Tumors are denoted by arrowheads (50x mosaics) and the “Tu” label (200x images). UBM particles are enclosed by a dashed line and the “UBM” label. (F) Immunofluorescence staining for CD3+ T cells (red) and B220+ B cells (green) with 4′,6-diamidino-2-phenylindole (DAPI) counterstain (blue) after 7 days. (n = 3 animals; 200x). (G) CD4 (green) and CD3 (red) T cell costaining within the UBM microenvironment after 7 days (200x). (H) Flow cytometry quantifying the proportions of CD4+ and CD8+ T cells after 7 days (n = 5, means ± SE). (I) Flow cytometry of FoxP3 expression in tumor CD4+ T cells [and UBM fluorescence minus one (FMO)/isotype control], quantified (J) in tumors and tumor draining lymph nodes (DLNs) 7 days after injection (n = 5, means ± SE). (K) B16–F10 tumor growth and survival in wild-type (WT), Rag1−/−, and CD4+ T cell repopulated Rag1−/− mice with UBM or saline delivery (n = 5, means ± SE). Flow cytometry: *P < 0.05, ***P < 0.001, ****P < 0.0001, Student’s t test (saline versus UBM). Tumor volume: *P < 0.05 (WT saline versus WT UBM), †P < 0.05 (Rag1−/− UBM versus Rag1−/− + CD4 UBM), two-way repeated measures analysis of variance (ANOVA) with post hoc Tukey test at each time point before sacrifice. Survival: *P < 0.05, log-rank test of each group compared to WT saline with the Sidak correction (significance indicators in legend).
Biologic scaffolds such as UBM support a prohealing microenvironment when implanted in vivo (21, 22), and we sought to determine how this fundamental biomaterial response influences tumor formation. Because our objective was to specifically understand tumor formation within the biologic scaffold microenvironmental niche, we modified a subcutaneous tumor model to reproducibly interrogate several material and tumor types. Cancer cell lines were mixed with UBM particles or a saline control and injected subcutaneously into the flanks of syngeneic mouse strains (Fig. 1A). UBM particles consistently delayed tumor formation when coimplanted with syngeneic cancer cell lines: B16–F10 melanoma (Fig. 1B), CT26 colon carcinoma (Fig. 1C), and 4T1 breast cancer (fig. S1, A and B) were delayed to varying extents, indicating that tumor growth inhibition was not cell line or mouse strain dependent. This delay resulted in increased survival times by approximately 6 days in the B16–F10 model (21.2 ± 0.5 days for saline versus 28.8 ± 1.3 days for UBM), 10 days in the CT26 model (22.2 ± 1.0 days for saline versus 32.4 ± 2.8 days for UBM), and 4 days in the 4T1 model (16 ± 1.4 days for saline versus 20.4 ± 1.2 days for UBM) (Fig. 1, B and C, and fig. S1A). Bioluminescence imaging of luciferase-expressing B16–F10 cells conducted before tumors were palpable showed similar cancer cell engraftment and growth during the initial 5 days after UBM or saline delivery (Fig. 1D). Inhibition of tumor formation was also observed to varying extents in other ECM materials, including porcine small intestinal submucosa (23) and human acellular adipose tissue (AAT) (24) (fig. S1, C and D), suggesting that there are common factors driving tumor inhibition regardless of species or source tissue of the biologic scaffold. We excluded cytotoxicity as a direct cause of inhibition because neither B16–F10 viability nor adhesion was affected by UBM-coated wells (25) in vitro (fig. S1E), consistent with bioluminescence imaging that showed live-cell engraftment after 1 day in vivo (Fig. 1D).
We evaluated other tumor models, such as an orthotopic resection model where 4T1 breast cancer tumors were surgically removed from the mammary fat pad of female BALB/c mice and replaced with either UBM particles or saline (fig. S2A). UBM implantation did not promote regrowth at the primary tumor location or lung metastasis (Fig. 2, B to E). However, regrowth near the primary tumor site occurred within tissues that 4T1 cells had invaded, such as the dermis and body wall, rather than in direct proximity to the UBM implant. To further study the immune profile and cancer cell response in a UBM microenvironment, we focused on the more reproducible UBM coinjection model with the B16-F10 melanoma cell line for subsequent experiments.
Fig. 2. T cells isolated from the UBM B16-F10 tumor microenvironment have an activated T H2 and myeloid-regulating phenotype.

T cells were sorted from UBM or saline-delivered B16–F10 tumors for multiplex gene expression analysis using the NanoString platform. (A) Volcano plot of genes differentially regulated in UBM- associated T cells compared to saline 14 days after injection. Significantly different regulation was determined from false discovery rate-adjusted P values. (B) Normalized counts of TH2-associated (Il4 and Il13) and myeloid-regulating (Csf1 and Cd40lg) gene transcripts between 7 and 21 days after injection (n = 3 to 4 except 7-day saline pooled from three animals, means ± SD). (C) Differential expression of TH2-related, T cell activation, and cytotoxic gene sets in UBM relative to saline 14 days after injection. (D) Intracellular cytokine staining of IL-4 and IFN-γ in CD4+ T cells from saline and UBM B16-F10 tumors 14 days after injection compared to FMO controls (n = 5, means ± SE). (E) T cell (CD3+NK1.1−), NKT cell (CD3+NK1.1+), and NK cell (CD3−NK1.1+) density in tumors and implants (cells/mm3) 14 days after injection (n = 5, means ± SE). (F) Effect of exogenous IL-4c codelivery with saline or UBM on B16–F10 tumor formation and survival (10 mg of IL-4c per injection; n = 5, means ± SE). (G) Immunofluorescence histology of F4/80+ macrophages (green) and the nuclear proliferation marker Ki67 (red) in the UBM microenvironment after 7 days with DAPI counterstain (200x; dashed line indicates UBM implant border). Flow cytometry and gene transcript counts: *P < 0.05, **P < 0.01, ***P < 0.001, ****P < 0.0001, Student’s t test (saline versus UBM). Tumor volume: +P < 0.05 (saline versus UBM, saline + IL-4c, and UBM + IL-4c), two-way repeated measures ANOVA with post hoc Tukey test at each time point before sacrifice. Survival: *P < 0.05, **P < 0.01, log-rank test compared to WT saline with the Sidak correction (significance indicators in legend).
The UBM microenvironment increases lymphocyte recruitment compared to B16-F10 tumors
Histologic analysis of H&E-stained B16–F10 tumors shows extensive differences in immune cell recruitment and location in the UBM microenvironment compared to saline. Tumors were analyzed at similar external volumes (200 mm3), which occur at different time points for saline (day 10) and UBM delivery (16 days) because of differences in growth kinetics. Saline-delivered tumors displayed the typical B16–F10 melanoma morphology: a high density of melanocytes, tumor necrosis, and large but poorly developed blood vessels (Fig. 1E). In contrast, tumor formation with UBM coinjection was delayed and began as small tumor nodules (Fig. 1E, arrowheads) among UBM particles (Fig. 1E, dashed line), with a dense immune cell infiltrate at the tumor-UBM interface. Histology confirmed that the UBM material was present for at least 2 weeks, indicating that external tumor volume measurements are an overestimation of tumor size that includes the volume occupied by the UBM implant itself.
Adaptive immunity is a vital component of cancer immune surveillance and was recently shown to be required for ECM-facilitated muscle wound healing (6). We found a greater density of CD3+ T cells recruited to the host-UBM interface after 7 days compared to classical B16–F10 tumors delivered with saline, which were largely nonimmunogenic (Fig. 1F). B220+ B cells were also more numerous in response to UBM than saline-delivered tumors, although to a lesser extent than T cells. Additional histologic phenotyping (Fig. 1G) revealed that many of the T cells in the UBM microenvironment were CD4+ and constituted a greater proportion of the T cell compartment in UBM (79.14 ± 3.5%) compared to saline (67.6 ± 1.0%) when quantified by flow cytometry (Fig. 1H). Immunosuppressive regulatory T cells (Tregs) are implicated in cancer immune escape and also express CD4; however, we found a decrease in the proportion of Tregs with UBM implantation. Tregs (CD4+FoxP3+) decreased from 19.22 to 6.33% of intratumoral CD4+ T cells with UBM implantation compared to saline (Fig. 1, I and J) and from 4.54 to 1.64% in the DLN after 7 days (Fig. 1J). Thus, T cells recruited to the UBM microenvironment are primarily CD4+ TH cells rather than immunosuppressive Tregs.
CD4+ T cells are required for tumor growth inhibition in the UBM microenvironment
Given the increased T cell recruitment to UBM, we sought to determine whether these cells played a role in delaying tumor growth. Tumor inhibition in the UBM microenvironment was completely ablated in Rag1−/− mice (Fig. 1K) that lack mature T cells and B cells, with identically rapid tumor growth rates regardless of UBM or saline delivery. However, intravenously transferring CD4+ T cells (>99% cell purity; fig. S3) into Rag1−/− mice before implantation rescued tumor inhibition in the UBM microenvironment (Fig. 1K) and corresponded to improved survival from 18.6 ± 0.4 days in Rag1−/− mice to 26 ± 2.1 days with CD4+ T cell transfer. These CD4+ T cell repopulation studies in Rag1−/− mice confirm that retarded tumor growth within the UBM microenvironment is not solely due to direct impairment of tumor cell viability or engraftment efficiency (because tumor growth is unaffected by UBM in immunodeficient Rag1−/− mice). Rather, the immune system is required for the UBM scaffold-induced delay in tumor formation, and T cells are instrumental in shaping the UBM microenvironment.
UBM-associated T cells have an activated TH2 phenotype compared to TILs
Our finding that the UBM microenvironment requires T cells for tumor inhibition led us to perform a detailed characterization of T cell phenotype using multiplexed gene expression analysis. T cells were sorted from coimplanted UBM and B16–F10 cells for gene expression analysis using the NanoString platform (see table S1 for the full dataset of 770 genes). Forty genes were differentially regulated in UBM-associated T cells compared to classical tumor-infiltrating lymphocytes (TILs) that developed with saline delivery (Fig. 2A). Many of the differentially regulated genes showed consistent expression across time points, including molecules that influence macrophage and dendritic cell function, such as Il4, Il13, Csf1 [encoding macrophage colony-stimulating factor (M-CSF)], and Cd40lg (Fig. 2B). UBM-associated T cells overexpressed numerous TH2-related genes (Fig. 2C) relative to TILs, with the greatest fold increases occurring in the Th2 cytokines Il4 (45-fold), Il5 (24-fold), and Il13 (18-fold). These TH2 cells were highly activated (Fig. 2C) as shown by increased expression of Cd69 (2.2-fold) and Il2ra (2.2-fold). Although Il2ra (encoding CD25) also characterizes Tregs, Foxp3 expression decreased (fourfold) and Cd4 increased (threefold) in UBM-associated T cells (fig. S4), which was consistent with our flow cytometry determination of TH cell accumulation rather than Tregs. Furthermore, several genes associated with cytotoxic responses were up-regulated such as Gzma (Granzyme A; 12-fold), Klra7 (fivefold), and Klrc2 (threefold) (Fig. 2C). Because CD8+ cytotoxic T cell proportions were not increased with UBM delivery, this may indicate increased activity of existing CD8+ T cells or an alternative T cell source for direct cancer cell killing such as natural killer T (NKT) cells.
Intracellular cytokine staining and flow cytometry of UBM-associated T cells showed increased interleukin-4 (IL-4) expression in UBM-associated CD4+ T cells compared to classical TILs after 14 days, validating the TH2 profile determined from gene expression analysis (Fig. 2D). UBM also recruited increased proportions and densities of natural killer (NK) cells (192.0 ± 48.2 cells/mm3 versus 64.8 ± 22.3 cells/mm3) and NKT cells (58.1 ± 15.9 cells/mm3 versus 7.6 ± 2 cells/mm3) compared to saline tumors (Fig. 2E and fig. S5, A to C). Most of the CD4+ T cells within the tumor were antigen-experienced (CD44+) regardless of saline or UBM delivery (fig. S5D); however, the proportion of CD44+CD4+ cells in the DLN increased from 15.5 ± 1.6% with saline delivery to 21.7 ± 3.1% with UBM. Most of these CD4+ cells were CD62L−, indicating an effector memory phenotype (fig. S5E).
IL-4-induced inflammation impairs tumor formation
We then investigated whether the type 2 inflammatory response to UBM mediated by IL-4 could be replicated to inhibit tumor formation. We delivered B16–F10 cells with the canonical TH2/M2 agonist IL-4 in the form of a half-life stabilized IL-4 complex (IL-4c) (26). IL-4c alone impaired B16–F10 tumor growth (8-day increase in survival), which was similar to inhibition found in the UBM microenvironment (11-day increase in survival) (Fig. 2F). The combination of IL-4c and UBM, however, did not produce an additive benefit compared to either treatment alone, suggesting a redundant mechanism. Both IL-4 and M-CSF (encoded by Csf1) induce macrophage proliferation in vivo (26), and many of the F4/80+ macrophages that accumulated in the UBM microenvironment had also entered the cell cycle (Ki67+) (Fig. 2G). UBM-associated T cells highly express both IL-4 and Csf1, suggesting that they play a role in modulating the myeloid compartment within the UBM microenvironment.
UBM alters myeloid cell recruitment during B16–F10 tumor formation in a lymphocyte-dependent process
Previous studies have shown that tissue remodeling facilitated by biologic scaffolds (including UBM) is accompanied by robust myeloid cell recruitment (5,27). We found that subcutaneous injection of an acellular UBM scaffold (without B16–F10 cells) led to rapid cell infiltration (Fig. 3A), primarily by CD11b+ myeloid cells (Fig. 3B). To better understand the interplay between T cells and the myeloid compartment, we coinjected UBM and B16–F10 cells in both WT and lymphocyte-deficient Rag1−/− mice and performed flow cytometry of the myeloid cell infiltration (see fig. S6 for the full gating and population definitions). Although myeloid cells (CD45+CD11b+) were the dominant cell type within the WT UBM microenvironment, this myeloid presence was diminished in Rag1−/− mice (391,000 ± 191,000 cells versus 112,000 ± 66,000 cells; Fig. 3C). In-depth phenotyping by flow cytometry revealed that the composition of the UBM myeloid compartment strongly depended on lymphocytes (Fig. 3D). Seven days after injection, 69.0 ± 1.5% of CD11b+ cells in the UBM microenvironment in WT mice were eosinophils (Siglec-F+MHCII-), which corresponds to more than double the proportion found in WT mice with saline-delivered tumors (Fig. 3, D and E). Eosinophil recruitment to UBM was drastically reduced to 6.4 ± 1.4% in Rag1−/− mice. Few granulocytes (Ly6G+) were present within the WT UBM microenvironment (3.6 ± 0.2% of CD11b+ cells), although this proportion increased in Rag1−/− mice (11.0 ± 0.8%); the monocyte (Ly6C+) population followed a similar trend as granulocytes (Fig. 3, D and E).
Fig. 3. Myeloid cell recruitment and macrophage polarization in the UBM B16–F10 tumor microenvironment is lymphocyte dependent.

Myeloid cell infiltration was characterized 7 days after B16–F10 and UBM implantation in WT and Rag1−/− C57BL/6 mice. (A) SEM of cell infiltration in and around acellular UBM after implantation in WT mice. (B) Flow cytometry of CD11b+ myeloid cells in the UBM microenvironment and (C) the number of myeloid cells recruited to UBM in WT and Rag1−/− mice 7 days after injection (n = 5, means ± SE). (D) Flow cytometry plots of saline and UBM B16–F10 microenvironments in WT and Rag1−/− mice. (E) Myeloid cell quantification of eosinophil (Siglec-F+MHCII−), granulocyte (Ly6G+), and monocyte (Ly6C+) infiltration in WT and Rag1−/− mice [saline tumors pooled from five animals; n = 5 for UBM-delivered cells (means ± SE)]. (F) Mean fluorescence intensity (MFI) of the macrophage polarization markers CD86 (M1) and CD206 (M2) in F4/80+ and CD11c+ macrophage subpopulations [saline-delivered tumors in Rag1−/− mice were pooled from five animals; n = 4 for saline delivered in WT and n = 5 for UBM-delivered cells (means ± SE)]. (G) B16–F10 tumor growth after macrophage ablation with clodronate liposomes (ClodLipo) or control phosphate-buffered saline liposomes (PBSLipo). Liposomes were delivered before B16-F10 injection and maintained during tumor growth, and tumor volume and survival were monitored [n = 5 for PBSLipo groups and n = 3 for ClodLipo groups (means ± SE)]. Flow cytometry: *P < 0.05, **P < 0.01, ***P < 0.001, ****P < 0.0001, one-way ANOVA with post hoc Tukey test. The variance for saline tumors in Rag1−/− mice was estimated as equivalent to the measurement value. Tumor volume: Two-way repeated measures ANOVA with post hoc Tukey test at each time point before sacrifice. #P < 0.05 for saline + PBSLipo versus UBM + PBSLipo, saline + PBSLipo versus saline + ClodLipo, and UBM + PBSLipo versus UBM + ClodLipo.
Macrophage (F4/80+) and dendritic cell (CD11c+) myeloid subpopulations were analyzed for M1/M2 polarization using the M2- associated marker CD206 and the M1-associated marker CD86 in WT and Rag1−/− mice. F4/80+ macrophages (both F4/80+CD11c− and F4/80+CD11c+) in the UBM microenvironment increased CD206 expression fivefold compared to classical tumor-associated macrophages (TAMs) that occur with saline delivery, although this increase was greatly attenuated in Rag1−/− mice (Fig. 3, D and F). Instead, UBM macrophages in Rag1−/− mice assumed twofold greater CD86 expression compared to WT. Closer inspection revealed a double-positive population (CD206hiCD86+) in the UBM microenvironment of tumors from both WT and Rag1−/− mice (fig. S7A) but not saline control tumors. Dendritic cells (CD11c+F4/80−) were generally CD206loCD86+ in saline tumors, whereas CD86 expression decreased with UBM implantation. Major histocompatibility complex class II (MHCII) intensity was greatest in UBM-associated CD11c+ cells (both CD11c+F4/80+ and CD11c+F4/80−) with no difference between WT and Rag1−/− mice (fig. S7B). Overall, the greatest difference between UBM-associated macrophage and TAM surface marker expression was increased CD206 expression (Fig. 3, D and F, and fig. S7A), and the CD206hiCD86− population in particular was lost in Rag1−/− mice, suggesting that macrophage phenotype is regulated by lymphocytes.
UBM-associated macrophages are necessary for tumor inhibition
TAMs have been characterized as having an M2-like phenotype and are implicated in promoting tumor progression. Because we found that UBM-associated macrophages expressed the canonical M2 marker CD206 to an even greater extent than TAMs, we characterized the effect of macrophage ablation on tumor growth. Circulating macrophage progenitors were partially depleted by injecting clodronate liposomes (ClodLipo) before and after B16–F10/UBM coinjection (fig. S8A). Flow cytometry analysis of peripheral blood confirmed that Ly6Chi monocytes decreased by 86% with clodronate liposome injection (fig. S8B). Control PBS liposomes (PBSLipo) had no effect on tumor kinetics: Rapid tumor growth occurred with saline delivery, whereas tumor formation was delayed with UBM coinjection (Fig. 3G). Clodronate liposome treatment resulted in opposite effects when administered to saline- or UBM-delivered tumors. Macrophage depletion in saline-delivered tumors slowed tumor growth, whereas tumor inhibition was lost in the UBM microenvironment in the absence of macrophages, increasing the rate of tumor formation. The divergent effects of macrophage depletion suggest a phenotypic difference between UBM-associated macrophages and classical TAMs that participate in tumor inhibition versus tumor promotion, respectively.
UBM-associated macrophages have a complex M1/M2 and wound-healing phenotype that is distinct from TAMs
We further characterized UBM-associated macrophage involvement in tumor inhibition by performing multiplex gene expression analysis of sorted macrophages using the NanoString platform. Fourteen days after injection, more than 130 immune-related genes were differentially regulated in UBM-associated macrophages compared to classical TAMs (Fig. 4A; see table S2 for the full expression data). UBM was associated with large and sustained increases in M2 gene expression (such as Arg1 and Mrc1) and decreases in M1-related genes (such as Cd86 and Cd80) across time points (Fig. 4B). Chemo-kines such as Ccl8 (broad leukocyte recruitment) and Ccl24 (eosinophil recruitment) were also up-regulated in UBM over time (Fig. 4B). Although these factors support the increase in immune cell density found within the UBM microenvironment, they have different M1/M2 associations, arguing against a purely M1 or M2 phenotype.
Fig. 4. Macrophages isolated from the UBM B16–F10 microenvironment have a complex polarization phenotype.

Macrophages were sorted from UBM or saline- delivered B16–F10 tumors for gene expression analysis using the NanoString platform. (A) Volcano plot of genes differentially regulated in UBM-associated macrophages compared to saline B16-F10 tumors 14 days after injection. Significantly different regulation was determined from false discovery rate-adjusted P values. (B) Normalized counts of selected M2-associated (Arg1 and Mrc1), M1-associated (Cd86 and Cd80), and chemokine (Ccl8 and Ccl24) gene transcripts between 7 and 21 days after injection [n = 3 to 4 except 7-day saline pooled from three animals, mean ± SD). (C) Differential expression of M1- and M2-associated genes in UBM-associated macrophages 14 days after injection compared to saline delivery. (D) Immunofluorescence histology of the macrophage surface marker F4/80 (green) and the intracellular M2 marker Fizz1 (red) with DAPI counterstain. Examples of cells coexpressing F4/80 and Fizz1 are denoted with arrowheads (n = 2; 200x). (E) Differential expression of complement, angiogenesis, and cell regulation genes in UBM relative to saline B16–F10 tumor macrophages 14 days after injection (n = 4, means ± SE). Gene transcript counts: *P < 0.05, **P < 0.01, ****P < 0.0001, Student’s t test.
Macrophage phenotype is a functional state that is typically conceptualized with the M1/M2 polarization paradigm defined from in vitro stimulation. M1 macrophages result from interferon-γ (IFN-γ) and lipopolysaccharide exposure, whereas M2 (specifically M2a) macrophages result from IL-4 exposure. Thus, we defined genes differentially expressed in UBM as either M1 or M2 markers using a previously published RNA sequencing analysis of M1 and M2 stimulation (28). This analysis revealed a complex signature of M1 and M2 genes in UBM-associated macrophages compared to TAMs (Fig. 4C). Previous studies have concluded an M2 bias with biologic scaffold implantation (5, 27), and likewise, we found that many typical M2 genes such as Chil3, Arg1, and Cd163 are highly up-regulated in UBM-associated macrophages. Histologically, UBM-associated macrophages strongly expressed Fizz1 (an M2 marker) within the cytoplasm, whereas nearly all classical TAMs were Fizz1− (Fig. 4D). Several M1 genes were highly up-regulated in the UBM microenvironment, including Ccl8 (181-fold increase) and Ctsl (37-fold increase), whereas several M2 genes were strongly down-regulated, such as Ccl17 (29-fold decrease) and Ccl22 (7-fold decrease) (Fig. 4C). Overall, UBM-associated macrophages had an M2 bias in up-regulated genes (19 M2 genes versus 11 M1 genes) and an equal number of down-regulated M1 and M2 genes (10 genes each).
We also examined genes related to the host response to biomaterials (complement pathway), wound healing (angiogenesis), and antigen presentation, which were assigned M1/M2 designations as above (see fig. S9 for additional gene sets). UBM-associated macrophages consistently up-regulated complement and angiogenesis genes regardless of M1/M2 association (Fig. 4E). UBM macrophages down-regulated MHCII genes (M2 associated) but up-regulated MHCI genes (M1 associated) (Fig. 4E), although our flow cytometry data showed an increase in MHCII surface protein expression (fig. S7B). Each of these gene sets was uniformly regulated, suggesting that specific genetic programs were activated independently of the traditional M1/M2 signaling paradigm.
Synthetic particles impair B16-F10 tumor formation in a lymphocyte-independent manner
We compared UBM to synthetic adjuvant materials to determine whether the tumor-inhibiting microenvironment was unique to biologic scaffolds or was found in immune-stimulating particulate materials in general. Aluminum hydroxide (alum) and mesoporous silica particles are both well-characterized immune adjuvant materials (29–32) that inhibited tumor formation when coinjected with B16–F10 cells in WT mice compared to saline, increasing survival to 11 and 5 days, respectively (fig. S10, A and B). In contrast to the lack of UBM-initiated tumor inhibition in Rag1−/− mice, synthetic materials either did not affect (silica) or enhance (alum) tumor inhibition in the absence of adaptive immunity (fig. S10, A and B). Therefore, T cells are not necessary for tumor inhibition in the synthetic adjuvant material microenvironment, whereas they are critical to tumor inhibition with biologic scaffolds.
Myeloid cell recruitment in synthetic adjuvant materials differed substantially compared to both saline and UBM B16–F10 delivery (fig. S10, C and D). Granulocytes (Ly6G+) dominated the synthetic adjuvant material microenvironment (fig. S10D), accounting for 33 and 23% of myeloid cells in alum and silica implants, respectively. Monocytes (Ly6C+) represented the next largest population for these materials. Ly6G is a marker of immunosuppressive myeloid-derived suppressive cells (MDSCs) in the context of cancer, but it is also expressed by neutrophils, which are recruited to synthetic materials during the foreign body reaction (7, 33, 34). There were relatively few viable macrophages or dendritic cells within synthetic adjuvant materials, and thus, polarization markers were not assessed. UBM and synthetic material microenvironments differed from saline, and they also differed substantially from each other; synthetic materials induced a Ly6G+ cell-dominant response, whereas UBM was enriched for eosinophils and macrophages.
The primary features of the UBM and alum microenvironments were generated by the material alone without B16–F10 cells. UBM, alum, or saline was injected subcutaneously (without cells) in 4get mice, which have an enhanced green fluorescent protein (EGFP) reporter for tracking IL-4 expression. Only UBM-associated T cells robustly up-regulated IL-4 expression (fig. S11A) in both the DLN (10% of T cells EGFP+) and at the implant site (28% of T cells EGFP+). Compared to alum, the UBM microenvironment recruited more eosinophils that constitutively expressed IL-4 (>95% EGFP+), indicating that they may also contribute to driving the type 2 environment. Monocytes, macrophages, and B cells expressed relatively little IL-4 (<5% EGFP+; fig. S11B).
PD-1/PD-L1 immune checkpoint inhibition synergizes with the tumor inhibitory UBM microenvironment
CD4+ T cell-dependent tumor inhibition in the UBM scaffold microenvironment led us to investigate potential synergies with immune-activating cancer immunotherapy. We examined the combination of UBM coinjection with immune checkpoint blockade targeting PD-1 (programmed cell death protein 1), PD-L1 (programmed death- ligand 1), or PD-L2 (programmed death-ligand 2). PD-1 engagement with its ligands (PD-L1 or PD-L2) provides negative feedback to activated T cells, and blocking these inhibitory molecules could allow amplification of the UBM-mediated immune response (35). Monoclonal antibodies blocking either PD-1 or PD-L1 greatly slowed B16-F10 tumor growth when combined with UBM delivery compared to isotype controls, whereas blocking PD-L2 had no effect (Fig. 5, A and B). Mean survival increased from 23.8 ± 0.5 days with isotype to 34.4 ± 2.0 days and 32 ± 2.1 days with PD-1 and PD-L1 blockade, respectively, when combined with UBM delivery (Fig. 5C). In contrast, immune checkpoint blockade did not substantially affect tumor formation or growth with saline delivery alone. Therefore, the synergistic combination of PD-1/PD-L1 blockade with the UBM immune microenvironment is responsible for increased tumor inhibition.
Fig. 5. Synergistic tumor inhibition with UBM and immune checkpoint blockade immunotherapy.

B16–F10 delivery with saline or UBM was followed by treatment with monoclonal antibodies blocking PD-1, PD-L1, PD-L2, or isotype controls. (A) Individual tumor growth curves comparing the effect of anti-PD-1 treatment in the UBM microenvironment compared to saline (shaded region indicates the time range of terminal tumor growth in the UBM and isotype group). (B) Average tumor volume and (C) survival for treatments noted in (A) (n = 8 to 10, means ± SE). Arrowheads indicate treatment frequency. (D) Tumor volume when UBM or saline was delivered 1 day after B16-F10 cells, followed by anti-PD-1 treatment or isotype controls 4 days later. (E) Survival for delayed UBM implantation with anti-PD-1 treatment as noted in (D) (n = 5). (F) B16-F10 cell titration in the UBM microenvironment with anti-PD-1 treatment compared to saline (n = 5, means ± SE). Initial B16–F10 cell doses range between 1 × 10³ and 1 × 10⁶ cells per injection. Tumor volume: §P < 0.05 (UBM + isotype versus UBM + PD-1 or PD-L1), ****p < 0.0001 (all UBM treatments versus saline + isotype). For cell titration, ****p < 0.01 (UBM versus saline). Two-way repeated measures ANOVA with post hoc Tukey test at each time point before sacrifice. Survival: *P < 0.05, **P < 0.01, log-rank test with the Sidak correction.
We next examined checkpoint blockade using iterations of our model that better characterize clinical scenarios. We first tested delayed UBM implantation in which B16-F10 cells were allowed to engraft for 1 day before UBM or saline delivery to model residual cancer cell presence after tumor resection, in contrast to co-delivery where cells and UBM are in the same location. Although delayed UBM implantation with isotype controls had no effect on tumor formation, PD-1 blockade impaired tumor growth (Fig. 5D) and improved survival (Fig. 5E). We then varied the initial cancer cell dose delivered with UBM (1 × 10³ to 106 cells) and anti-PD-1 to model the effect of differing cancer burden after tumor resection. The highest cell dose (1 × 10⁶ cells) resulted in the most rapid tumor growth with saline delivery and the greatest inhibition with UBM (Fig. 5F and fig. S12). UBM delayed tumor growth at midlevel cell doses (1 × 10⁴ to 105) to a lesser extent. Tumors did not consistently form at the lowest cell dose of 1 × 10³ with saline delivery (60% tumor formation efficiency).
During the course of this study, 13 mice rejected initial cancer cell implantation. Rejection was an extremely rare occurrence in UBM without checkpoint blockade (less than 1% of mice); however, rejection frequency increased to more than 10% when combined with anti-PD-1 (fig. S13). We performed tumor rechallenge experiments to determine whether rejection was due to immune recognition and establishment of long-lasting immunological memory within the UBM scaffold microenvironment or was due to nonspecific cytotoxicity. Mice were injected with the same cell line (105 cells, which has 100% tumor formation efficiency in naive mice) at least 60 days after the initial inoculation. We found that protection on rechallenge was established when animals were primed by the combination of anti-PD-1 and UBM with a sufficient number of cancer cells (105 to 106 cells). Only these high cell doses (Fig. 5F) provided long-term protection on rechallenge, whereas tumors grew readily at the lowest 103 cell dose. Anti-PD-1 treatment was necessary for complete protection in the B16–F10 model (fig. S13B). Together, these data demonstrate that the UBM microenvironment is conducive to tumor cell-specific recognition and long-lasting immunological memory when combined with immunotherapy.
A UBM scaffold immune gene signature associates with improved survival in patients with melanoma
Our final objective was to determine whether features of the UBM scaffold immune phenotype also occur in human melanoma tumors, and if so, how this prohealing immune phenotype and the tumor microenvironment affect outcome. T cells and macrophages were necessary for UBM-mediated tumor inhibition, and extensive gene expression characterization revealed that these cells had distinct phenotypes compared to the classical tumor immune microenvironment. We therefore examined this UBM gene signature in patients with melanoma by interrogating The Cancer Genome Atlas (TCGA). Significantly up-regulated genes in T cells and macrophages from our NanoString analyses constituted a UBM gene signature (Fig. 6A) and each patient in the TCGA database was assigned an enrichment score (36) categorized as high, medium, or low similarity to the UBM signature (Fig. 6B). Differences in enrichment score among patients were driven by about 30 genes (Fig. 6B). Patients with melanoma having the highest scores (high homology to the UBM signature) had the greatest overall survival, suggesting that a prohealing immune phenotype in humans is associated with improved clinical outcomes (Fig. 6C).
Fig. 6. The UBM scaffold immune signature is associated with increased overall survival in patients with melanoma.
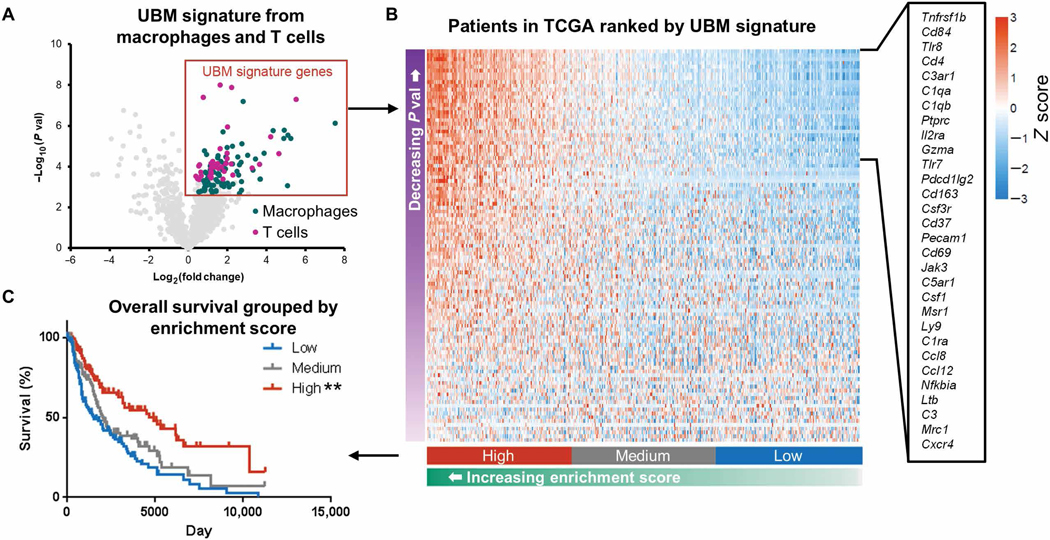
(A) A UBM immune gene signature was defined by genes that were up-regulated in T cells and macrophages from UBM-delivered B16-F10 tumors compared to saline in mice. Patients with melanoma in TCGA were assigned an enrichment score on the basis of their homology to the UBM immune signature and binned into discrete categories on the basis of their relative scoring ranks: top, middle, and bottom thirds. (B) Heat map of UBM scaffold immune signature gene expression in patients with melanoma. Genes with the greatest contribution to enrichment score are listed. (C) Melanoma patient survival when grouped by patient enrichment score. **P < 0.01, log-rank test with the Sidak correction (significance indicators in legend).
DISCUSSION
Biologic scaffolds composed of the ECM from decellularized tissues are increasingly found at the crossroads of tissue engineering and surgical oncology. Resection surgery is a standard first-line therapy for treating solid tumors, and biologic scaffolds are an effective tissue engineering therapy for reconstructing large-volume tissue voids (21). This strategy places a prohealing scaffold in proximity to residual neoplastic cells (8–11). We found that the ECM scaffold microenvironment inhibited tumor formation in multiple syngeneic cell lines across different mouse strains and when using different biologic scaffold sources. Early reports found that biologic scaffolds were not tumor promoting (18); here, we determined that a prohealing biologic scaffold microenvironment inhibits tumor formation through a process requiring immune cell participation. Consistent with our previous work in the context of muscle repair (5, 6, 19), UBM implantation induced a type 2 immune response consisting of IL-4–producing TH2 cells, CD206+ macrophages, and eosinophil accumulation. Antitumoral activity in a type 2 immune environment seemingly contradicts the classical view of tumor immunology. Traditional thinking holds that TH1-induced M1 macrophage and cytotoxic T cell effectors are the most adept at tumor killing, whereas TH2/M2-related cells are involved in immune suppression and tumor progression (15, 28). UBM-associated macrophages, however, are phenotypically distinct from traditional M2 cells and classical TAMs.
Traditional M1/M2 archetypes are often based on limited staining for select M2 markers such as CD206 or CD163. Although UBM-associated macrophages greatly up-regulate traditional M2 markers such as Mrc1 and Arg1 and down-regulate M1 genes such as Cd86, we found that this superficial analysis was misleading. Indepth characterization revealed that about a third of up-regulated genes such as Ccl8 are M1 associated and that half of the down-regulated genes are M2 associated. Thus, a binary M1/M2 model may not suffice for describing UBM macrophages and predicting antitumoral immunity, and a broader characterization of activation may be necessary. Similarly, we found that UBM-associated macrophages expressed prohealing factors such as angiogenic mediators that are typically thought to enable tumor growth but may be more indicative of macrophage activation status. Several genes expressed by UBM-associated macrophages correlated with improved survival in patients with melanoma when we queried TCGA, suggesting that prohealing tumor phenotypes may have potential value as markers to predict improved clinical outcomes. The UBM-associated macrophage phenotype and tumor inhibition were lost in the absence of CD4+ T cells, a phenomenon not observed for other adjuvant particulate materials such as alum or silica.
CD4+ TH cell involvement was necessary for orchestrating antitumoral immunity in the UBM microenvironment and for polarizing the myeloid compartment. Several populations were affected by UBM implantation; TH2 cells and a T cell population expressing cytotoxic markers (possibly NK1.1+ cells) increased, whereas relative proportions of Tregs decreased and CD8+ cytotoxic T cells remained approximately the same. TH2 cells are often associated with tumor tolerance; however, we found that IL-4 (delivered exogenously as IL-4c) was a promising effector for the UBM response. Several studies have shown that IL-4-secreting cancer cell vaccines drive inflammation that promotes local cancer rejection by myeloid cells and antitumor immune memory (37, 38). Likewise, we found evidence for specific tumor recognition and vaccine-like behavior in the UBM microenvironment when combined with anti-PD-1 immunotherapy. Animals that cleared B16-F10 cells with the combination of UBM and anti–PD-1 conferred long-lasting protection against subsequent rechallenge, suggesting a memory response. The UBM microenvironment may therefore act as an IL-4–stimulating adjuvant to increase immunogenicity of melanoma.
These experiments provide evidence that a prohealing immune phenotype induced by biologic scaffolds inhibits tumor formation; however, several questions remain. We previously showed that UBM consists of hundreds of proteins (19), and additional constituents (such as polysaccharides) have not been characterized, limiting our understanding of which components may be responsible for immune modulation. Although we identified CD4+ TH cells and macrophages as necessary contributors, the mechanism of tumor inhibition is unknown and may involve cancer cytotoxicity or disrupting protumor activity in support cells. We also did not explore whether Ly6G+ granulocytes were MDSCs or material-associated neutrophils, two cell types that share the same surface markers and require functional analyses to differentiate (39). In addition, although the coimplantation is reproducible and isolates material-driven effects, it only interrogates the acute phase of the local immune response. Further investigation is needed to understand how long-term biologic scaffold implantation affects tumor progression and whether there are systemic effects. Last, we extensively characterized a single biologic scaffold material and performed limited examination of others. Some elements of the UBM microenvironment (such as M2 macrophage marker expression) are representative of several biologic scaffold types (4–6, 16, 27). However, it is unknown whether the complex immune phenotype that we described for UBM is universal to similar materials and whether the observed variations in tumor inhibition with these materials can be predicted by differences in immune signatures.
Together, the UBM microenvironment attracts immune cells to the tumor microenvironment and creates a unique immune signature that synergizes with checkpoint blockade immunotherapy to further activate responding T cells. The prohealing macrophage immune signature is distinct from classical TAMs and requires CD4+ T cells that have an activated TH2 profile. When we compared the UBM immune gene signature to patients with melanoma, we found a positive association with survival, supporting the notion that prohealing UBM scaffold immune response is compatible with delaying tumor progression. As the clinical use and administration of checkpoint immunotherapies are evolving, prohealing biologic scaffolds may provide both a vehicle for tissue reconstruction and a mechanism to optimize drug efficacy.
MATERIALS AND METHODS
Study design
The primary objective of this study was to determine whether a prohealing biologic scaffold microenvironment influences tumor formation and response to cancer immunotherapy. To study tumor growth in the scaffold microenvironment directly, syngeneic cancer cells were coimplanted with particulate decellularized porcine UBM in mouse models. Animals that did not form tumors upon implantation with UBM and treatment with checkpoint inhibitors were rechallenged with the same cell line to evaluate long-term protection. Secondary objectives were to characterize the T cell and macrophage populations that we found were necessary for the UBM response and to determine whether the UBM immune signature in mice correlated with human melanoma patient survival using data from TCGA (see fig. S14 for the UBM dose optimization). Tumors were harvested from mice for immunophenotyping via histology (antibodies listed in table S3), flow cytometry (antibodies and panels listed in table S4; gating strategy in fig. S15), and gene expression analysis. Researchers could not be blinded to delivery with a biologic scaffold because of the obvious appearance of the material before and after injection. All experiments were performed using 7 to 8-week-old female mice (n = 3 to 10 as indicated in figure legends). At small volumes, control tumors were pooled from n = 3 to 5 mice to obtain sufficient immune cell events for flow cytometry.
Statistical analysis
All tumor volume, survival, and flow cytometry statistical analyses were conducted using Prism software (GraphPad Software Inc.) with significance defined as P < 0.05. All survival data were analyzed with the log-rank test compared to WT saline with the Sidak correction for multiple comparisons. All tumor volume growth curves were analyzed by two-way repeated measures ANOVA with post hoc Tukey test at each time point before sacrifice. Flow cytometry data were analyzed with Student’s t test comparing saline to UBM or using one-way ANOVA for comparing the effect of UBM in WT and Rag1−/− genetic backgrounds as indicated in figure legends. To obtain sufficient events from small saline control tumors in Rag1−/− mice, cells from five mice were pooled. The variance for pooled measurements was estimated as equivalent to the measurement value. NanoString differential expression was analyzed using nSolver software (version 3.0, NanoString). Only genes with a minimum of 20 counts (equivalent to three SDs over average background) in greater than 50% of samples were analyzed. False discovery rate-adjusted P values were determined for each gene using the Benjamini-Yekutieli method. Primary data are reported in table S5.
Supplementary Material
Acknowledgments:
We thank B. Smith and the Johns Hopkins Institute for Biomedical Sciences Microscope Facility for assistance with SEM; the Sidney Kimmel Comprehensive Cancer Center (SKCCC) Immune Monitoring Core for NanoString access; A. Tam, the SKCCC Flow Cytometry Core, S. Gogula, and Z. Buono for assistance with immunofluorescence staining; D. Maestas for 4get mouse breeding; A. Anderson and A. N. Peña for AAT ECM preparation; and T. Gilbert for helpful discussions during this study.
Funding: This work was supported by The Bloomberg~Kimmel Institute for Cancer Immunotherapy and ACell Inc. M.T.W. was supported by the Hartwell Foundation Postdoctoral Fellowship. F.P. was supported by the Melanoma Research Alliance, the U.S. Department of Defense (PC130767), and NIH (RO1AI099300 and RO1AI089830). D.M.P. was supported by the Cancer Center Support Grant (NCI P30CA006973). F.P., J.H.E., and D.M.P. were supported by The Bloomberg~Kimmel Institute for Cancer Immunotherapy. S.S. was supported by Department of Defense BCRP (award number W81XWH-15–1-0017), and G.W. was supported by a postdoctoral fellowship from The John Fetting Fund for Breast Cancer Prevention Research.
Footnotes
Competing interests: J.H.E. and M.T.W. are inventors on Provisional Application No.: 62/666,617, filed by Johns Hopkins University (JHU) related to this work. J.H.E. holds equity in Aegeria Soft Tissue, a company that has licensed JHU intellectual property for the AAT material used in this study. The conflict is being managed by the Johns Hopkins Office of Policy Coordination. J.H.E. is a member of the scientific advisory board for ACell Inc. All other authors declare that they have no competing interests in this study.
Data and materials availability: All data associated with this study are present in the paper or the Supplementary Materials. Multiplex gene expression data for sorted T cells and macrophages are provided in tables S1 and S2, respectively. Remaining primary data are provided in table S5, and all data and analyses related to this manuscript are available upon request.
REFERENCES AND NOTES
- 1.Donnenberg VS, Zimmerlin L, Rubin JP, Donnenberg AD, Regenerative therapy after cancer: What are the risks? Tissue Eng. Part B Rev 16, 567–575 (2010). [DOI] [PMC free article] [PubMed] [Google Scholar]
- 2.Polykandriotis E, Arkudas A, Horch RE, Kneser U, To matrigel or not to matrigel. Am. J. Pathol 172, 1441–1442 (2008). [DOI] [PMC free article] [PubMed] [Google Scholar]
- 3.Badylak SF, Freytes DO, Gilbert TW, Extracellular matrix as a biological scaffold material: Structure and function. Acta Biomater. 5, 1–13 (2009). [DOI] [PubMed] [Google Scholar]
- 4.Allman AJ, McPherson TB, Badylak SF, Merrill LC, Kallakury B, Sheehan C, Raeder RH, Metzger DW, Xenogeneic extracellular matrix grafts elicit a TH2-restricted immune response. Transplantation 71, 1631–1640 (2001). [DOI] [PubMed] [Google Scholar]
- 5.Badylak SF, Valentin JE, Ravindra AK, McCabe GP, Stewart-Akers AM, Macrophage phenotype as a determinant of biologic scaffold remodeling. Tissue Eng. Part A 14, 1835–1842 (2008). [DOI] [PubMed] [Google Scholar]
- 6.Sadtler K, Estrellas K, Allen BW, Wolf MT, Fan H, Tam AJ, Patel CH, Luber BS, Wang H, Wagner KR, Powell JD, Housseau F, Pardoll DM, Elisseeff JH, Developing a pro-regenerative biomaterial scaffold microenvironment requires T helper 2 cells. Science 352, 366–370 (2016). [DOI] [PMC free article] [PubMed] [Google Scholar]
- 7.Anderson JM, Rodriguez A, Chang DT, Foreign body reaction to biomaterials. Semin. Immunol 20, 86–100 (2008). [DOI] [PMC free article] [PubMed] [Google Scholar]
- 8.Badylak SF, Hoppo T, Nieponice A, Gilbert TW, Davison JM, Jobe BA, Esophageal preservation in five male patients after endoscopic inner-layer circumferential resection in the setting of superficial cancer: A regenerative medicine approach with a biologic scaffold. Tissue Eng. Part A 17, 1643–1650 (2011). [DOI] [PMC free article] [PubMed] [Google Scholar]
- 9.Puckett Y, Pham T, McReynolds S, Ronaghan CA, Porcine urinary bladder matrix for management of infected radiation mastectomy wound. Cureus 9, e1451 (2017). [DOI] [PMC free article] [PubMed] [Google Scholar]
- 10.Sbitany H, Serletti JM, Acellular dermis-assisted prosthetic breast reconstruction: A systematic and critical review of efficacy and associated morbidity. Plast. Reconstr. Surg 128, 1162–1169 (2011). [DOI] [PubMed] [Google Scholar]
- 11.Sade B, Oya S, Lee JH, Non-watertight dural reconstruction in meningioma surgery: Results in 439 consecutive patients and a review of the literature. Clinical article. J. Neurosurg 114, 714–718 (2011). [DOI] [PubMed] [Google Scholar]
- 12.Saleh W. K. Abu, Al Jabbari O, Ramlawi B, Bruckner BA, Loebe M, Reardon MJ, Case report: Cardiac tumor resection and repair with porcine xenograft. Methodist Debakey Cardiovasc. J 12, 116–118 (2016). [DOI] [PMC free article] [PubMed] [Google Scholar]
- 13.Dvorak HF, Tumors: Wounds that do not heal—Redux. Cancer Immunol. Res 3, 1–11 (2015). [DOI] [PMC free article] [PubMed] [Google Scholar]
- 14.Junttila MR, de Sauvage FJ, Influence of tumour micro-environment heterogeneity on therapeutic response. Nature 501, 346–354 (2013). [DOI] [PubMed] [Google Scholar]
- 15.Mellman I, Coukos G, Dranoff G, Cancer immunotherapy comes of age. Nature 480, 480–489 (2011). [DOI] [PMC free article] [PubMed] [Google Scholar]
- 16.Sadtler K, Allen BW, Estrellas K, Housseau F, Pardoll DM, Elisseeff JH, The scaffold immune microenvironment: Biomaterial-mediated immune polarization in traumatic and nontraumatic applications. Tissue Eng. Part A 23, 1044–1053 (2017). [DOI] [PMC free article] [PubMed] [Google Scholar]
- 17.DeNardo DG, Barreto JB, Andreu P, Vasquez L, Tawfik D, Kolhatkar N, Coussens LM, CD4+ T cells regulate pulmonary metastasis of mammary carcinomas by enhancing protumor properties of macrophages. Cancer Cell 16, 91–102 (2009). [DOI] [PMC free article] [PubMed] [Google Scholar]
- 18.Hodde JP, Suckow MA, Wolter WR, Hiles MC, Small intestinal submucosa does not promote PAIII tumor growth in Lobund-Wistar rats. J. Surg. Res 120, 189–194 (2004). [DOI] [PubMed] [Google Scholar]
- 19.Sadtler K, Sommerfeld SD, Wolf MT, Wang X, Majumdar S, Chung L, Kelkar DS, Pandey A, Elisseeff JH, Proteomic composition and immunomodulatory properties of urinary bladder matrix scaffolds in homeostasis and injury. Semin. Immunol 29, 14–23 (2017). [DOI] [PMC free article] [PubMed] [Google Scholar]
- 20.Brown B, Lindberg K, Reing J, Stolz DB, Badylak SF, The basement membrane component of biologic scaffolds derived from extracellular matrix. Tissue Eng. 12, 519–526 (2006). [DOI] [PubMed] [Google Scholar]
- 21.Sicari BM, Rubin JP, Dearth CL, Wolf MT, Ambrosio F, Boninger M, Turner NJ, Weber DJ, Simpson TW, Wyse A, Brown EHP, Dziki JL, Fisher LE, Brown S, Badylak SF, An acellular biologic scaffold promotes skeletal muscle formation in mice and humans with volumetric muscle loss. Sci. Transl. Med 6, 234ra58 (2014). [DOI] [PMC free article] [PubMed] [Google Scholar]
- 22.Alvarez OM, Smith T, Gilbert TW, Onumah NJ, Wendelken ME, Parker R, Markowitz L, Diabetic foot ulcers treated with porcine urinary bladder extracellular matrix and total contact cast: Interim analysis of a randomized, controlled trial. Wounds. 29, 140–146 (2017). [PubMed] [Google Scholar]
- 23.Wolf MT, Daly KA, Reing JE, Badylak SF, Biologic scaffold composed of skeletal muscle extracellular matrix. Biomaterials 33, 2916–2925 (2012). [DOI] [PMC free article] [PubMed] [Google Scholar]
- 24.Wu I, Nahas Z, Kimmerling KA, Rosson GD, Elisseeff JH, An injectable adipose matrix for soft-tissue reconstruction. Plast. Reconstr. Surg 129, 1247–1257 (2012). [DOI] [PMC free article] [PubMed] [Google Scholar]
- 25.Beachley VZ, Wolf MT, Sadtler K, Manda SS, Jacobs H, Blatchley MR, Bader JS, Pandey A, Pardoll D, Elisseeff JH, Tissue matrix arrays for high-throughput screening and systems analysis of cell function. Nat. Methods 12, 1197–1204 (2015). [DOI] [PMC free article] [PubMed] [Google Scholar]
- 26.Jenkins SJ, Ruckerl D, Thomas GD, Hewitson JP, Duncan S, Brombacher F, Maizels RM, Hume DA, Allen JE, IL-4 directly signals tissue-resident macrophages to proliferate beyond homeostatic levels controlled by CSF-1. J. Exp. Med 210, 2477–2491 (2013). [DOI] [PMC free article] [PubMed] [Google Scholar]
- 27.Brown BN, Londono R, Tottey S, Zhang L, Kukla KA, Wolf MT, Daly KA, Reing JE, Badylak SF, Macrophage phenotype as a predictor of constructive remodeling following the implantation of biologically derived surgical mesh materials. Acta Biomater. 8, 978–987 (2012). [DOI] [PMC free article] [PubMed] [Google Scholar]
- 28.Xue J, Schmidt SV, Sander J, Draffehn A, Krebs W, Quester I, De Nardo D, Gohel TD, Emde M, Schmidleithner L, Ganesan H, Nino-Castro A, Mallmann MR, Labzin L, Theis H, Kraut M, Beyer M, Latz E, Freeman TC, Ulas T, Schultze JL, Transcriptome- based network analysis reveals a spectrum model of human macrophage activation. Immunity 40, 274–288 (2014). [DOI] [PMC free article] [PubMed] [Google Scholar]
- 29.Flach TL, Ng G, Hari A, Desrosiers MD, Zhang P, Ward SM, Seamone ME, Vilaysane A, Mucsi AD, Fong Y, Prenner E, Ling CC, Tschopp J, Muruve DA, Amrein MW, Shi Y, Alum interaction with dendritic cell membrane lipids is essential for its adjuvanticity. Nat. Med 17, 479–487 (2011). [DOI] [PubMed] [Google Scholar]
- 30.Hornung V, Bauernfeind F, Halle A, Samstad EO, Kono H, Rock KL, Fitzgerald KA, Latz E, Silica crystals and aluminum salts activate the NALP3 inflammasome through phagosomal destabilization. Nat. Immunol 9, 847–856 (2008). [DOI] [PMC free article] [PubMed] [Google Scholar]
- 31.Marichal T, Ohata K, Bedoret D, Mesnil C, Sabatel C, Kobiyama K, Lekeux P, Coban C, Akira S, Ishii KJ, Bureau F, Desmet CJ, DNA released from dying host cells mediates aluminum adjuvant activity. Nat. Med 17, 996–1002 (2011). [DOI] [PubMed] [Google Scholar]
- 32.Kim J, Li WA, Choi Y, Lewin SA, Verbeke CS, Dranoff G, Mooney DJ, Injectable, spontaneously assembling, inorganic scaffolds modulate immune cells in vivo and increase vaccine efficacy. Nat. Biotechnol 33, 64–72 (2015). [DOI] [PMC free article] [PubMed] [Google Scholar]
- 33.Doloff JC, Veiseh O, Vegas AJ, Tam HH, Farah S, Ma M, Li J, Bader A, Chiu A, Sadraei A, Aresta-Dasilva S, Griffin M, Jhunjhunwala S, Webber M, Siebert S, Tang K, Chen M, Langan E, Dholokia N, Thakrar R, Qi M, Oberholzer J, Greiner DL, Langer R, Anderson DG, Colony stimulating factor-1 receptor is a central component of the foreign body response to biomaterial implants in rodents and non-human primates. Nat. Mater 16, 671–680 (2017). [DOI] [PMC free article] [PubMed] [Google Scholar]
- 34.Jhunjhunwala S, Aresta-DaSilva S, Tang K, Alvarez D, Webber MJ, Tang BC, Lavin DM, Veiseh O, Doloff JC, Bose S, Vegas A, Ma M, Sahay G, Chiu A, Bader A, Langan E, Siebert S, Li J, Greiner DL, Newburger PE, von Andrian UH, Langer R, Anderson DG, Neutrophil responses to sterile implant materials. PLOS ONE 10, e0137550 (2015). [DOI] [PMC free article] [PubMed] [Google Scholar]
- 35.Pardoll DM, The blockade of immune checkpoints in cancer immunotherapy. Nat. Rev. Cancer 12, 252–264 (2012). [DOI] [PMC free article] [PubMed] [Google Scholar]
- 36.Subramanian A, Tamayo P, Mootha VK, Mukherjee S, Ebert BL, Gillette MA, Paulovich A, Pomeroy SL, Golub TR, Lander ES, Mesirov JP, Gene set enrichment analysis: A knowledge-based approach for interpreting genome-wide expression profiles. Proc. Natl. Acad. Sci. U.S.A 102, 15545–15550 (2005). [DOI] [PMC free article] [PubMed] [Google Scholar]
- 37.Golumbek PT, Lazenby AJ, Levitsky HI, Jaffee LM, Karasuyama H, Baker M, Pardoll DM, Treatment of established renal cancer by tumor cells engineered to secrete interleukin-4. Science 254, 713–716 (1991). [DOI] [PubMed] [Google Scholar]
- 38.Tepper RI, Pattengale PK, Leder P, Murine interleukin-4 displays potent anti-tumor activity in vivo. Cell 57, 503–512 (1989). [DOI] [PubMed] [Google Scholar]
- 39.Bronte V, Brandau S, Chen S-H, Colombo MP, Frey AB, Greten TF, Mandruzzato S, Murray PJ, Ochoa A, Ostrand-Rosenberg S, Rodriguez PC, Sica A, Umansky V, Vonderheide RH, Gabrilovich DI, Recommendations for myeloid- derived suppressor cell nomenclature and characterization standards. Nat. Commun 7, 12150 (2016). [DOI] [PMC free article] [PubMed] [Google Scholar]
Associated Data
This section collects any data citations, data availability statements, or supplementary materials included in this article.