Abstract
Atherosclerosis is the process underlying heart attack and stroke. A characteristic feature of the atherosclerotic plaque is the accumulation of apoptotic cells in the necrotic core. Pro-phagocytic antibody-based therapies are currently being explored to stimulate the phagocytic clearance of apoptotic cells; however, these therapies can cause off-target clearance of healthy tissues, leading to toxicities such as anemia. Here, we developed a macrophage-specific nanotherapy based on single-walled carbon nanotubes (SWNTs) loaded with a chemical inhibitor of the anti-phagocytic CD47-SIRPαsignaling axis. We demonstrate that these SWNTs accumulate within the atherosclerotic plaque, reactivate lesional phagocytosis, and reduce plaque burden in atheroprone apoE−/− mice without compromising safety, thereby overcoming a key translational barrier for this class of drugs. Single-cell RNA sequencing analysis reveals that pro-phagocytic SWNTs decrease the expression of inflammatory genes linked to cytokine and chemokine pathways in lesional macrophages, demonstrating the potential of Trojan horse nanoparticles to prevent atherosclerotic cardiovascular disease.
The phagocytic clearance of apoptotic cells is a routine homeostatic process that protects tissues from exposure to the inflammatory contents of dying cells.1–3 To remove these cells, the body engages in a process known as efferocytosis (Latin: “to take to the grave”). Efferocytosis is a highly conserved process triggered by “eat me” ligands which signal to phagocytes to induce engulfment.1 Conversely, cells may overexpress “don’t eat me” ligands to avoid removal.4
By delivering an anti-phagocytic signal that enables immune evasion, the upregulation of the “don’t eat me” molecule, CD47, is a major mechanism by which cancers establish and propagate disease.4,5 We recently discovered that CD47 signaling also has a critical role in atherosclerosis.6 Atherosclerosis is the process underlying heart attack and stroke and has remained the leading cause of death in the United States for nearly the past century.7,8 While pursuing the mechanism by which apoptotic vascular cells escape clearance from the diseased artery, we found that CD47 is markedly upregulated in the atherosclerotic plaque.6
CD47 functions as a ligand for the signal regulatory protein-α (SIRPα) on macrophages.9 Following this interaction, SIRPα activates the SH2 domain-containing phosphatase-1 (SHP-1) to mediate the intracellular signaling that suppresses phagocytic function.10 This signaling cascade renders diseased vascular cells resistant to removal and promotes plaque expansion. In hyperlipidemic mice, CD47-blocking antibodies (Ab) normalize the defect in efferocytosis, prevent the progression of established lesions, and protect against plaque rupture.6 However, antibody-mediated blockade of CD47 also accelerates the off-target removal of certain healthy tissue, including Fc-mediated elimination of red blood cells (RBCs) in the spleen.6,11,12 The resulting anemia and reduced oxygen-carrying capacity may exacerbate ischemia in individuals with atherosclerotic disease, thus limiting the translational potential of systemic, pro-efferocytic therapies currently in development.
To develop a method that more specifically and safely restores impaired efferocytic activity, we precision-engineered nanoparticles (NPs) that interrupt CD47-SIRPα signaling in monocytes and macrophages. The system, termed SWNT-SHP1i, involves a backbone of polyethylene glycol (PEG)-functionalized single-walled carbon nanotubes (SWNTs) loaded with (1) a fluorescent probe Cy5.5 and (2) a small-molecule inhibitor of CD47’s downstream effector molecule, SHP-1 (Fig. 1a). PEG-functionalized SWNTs were chosen because of their ultrahigh loading capacity13, favorable toxicology14,15, and ability to accumulate within a specific leukocyte subset, Ly-6Chi monocytes (inflammatory monocytes).16 The selectivity for this cell type is important, as Ly-6Chi monocytes are the primary circulating cells recruited to the diseased artery, where they differentiate into lesional macrophages.17–19 In addition to regulating the inflammatory response, macrophages have a homeostatic role as phagocytes that scavenge lipids and apoptotic debris.20 Because their phagocytic capacity becomes impaired in advanced atherosclerosis, strategies which restore the “appetite” of macrophages have the potential to both combat plaque expansion and prevent the inflammation which results from post-apoptotic necrosis. We hypothesized that leveraging SWNTs as a “Trojan horse” would enable us to achieve plaque-specific modulation of the CD47-SIRPα-SHP1 axis, thereby promoting the clearance of diseased cells in the lesion, while minimizing toxicities elsewhere in the body.
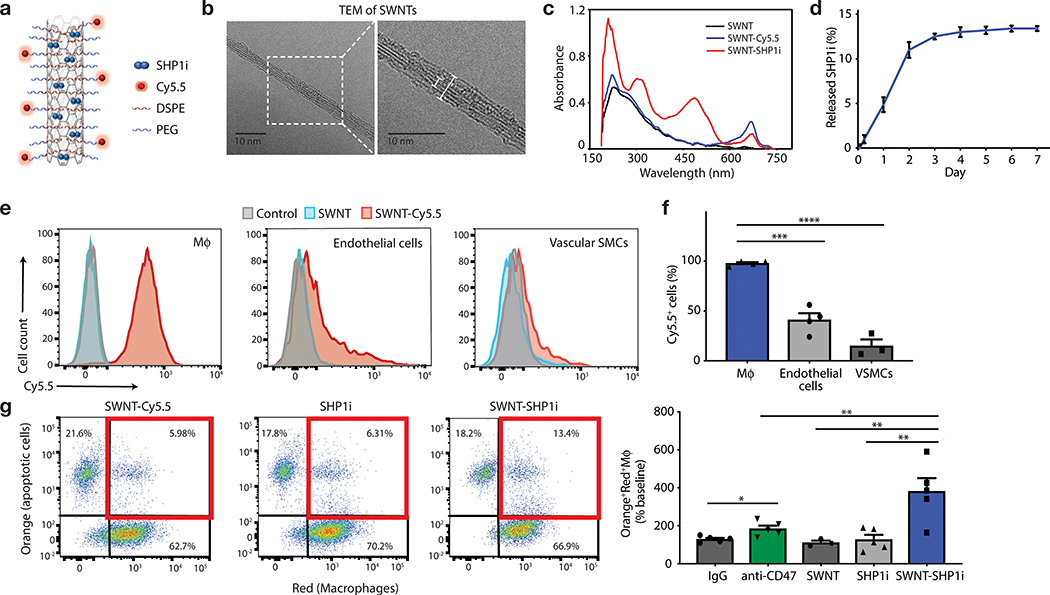
Figure 1: SWNT-SHP1i promotes the phagocytosis of apoptotic cells by macrophages.
a, Schematic of SWNT-SHP1i, comprised of a backbone of single-walled carbon nanotubes (SWNTs) which are functionalized with phospholipid-PEG (DSPE-PEG; 1,2-distearoyl-sn-glycero-3-phosphoethanolamine-N-[amino(polyethylene glycol)]) to form biocompatible nanotubes, Cy5.5 fluorophore for tracking in vivo delivery, and small-molecule inhibitors of SHP-1 (SHP1i) via π-π stacking and hydrophobic interactions with the nanotube surface. b, Negative staining transmission electron micrographs (TEM) show the cylindrical morphology of SWNTs with their surrounding PEG phospholipid layer. Bare SWNTs apparently have a diameter of ~2–3 nm (inner white line). The adsorbed PEG chains result in an increased SWNT diameter to ~5–6 nm (outer white line). c, UV-vis spectrum of SWNTs (black), SWNT-Cy5.5 (blue), and SWNT-SHP1i (red). d, Release curve of SHP1i from SWNT-Cy5.5 in serum, demonstrating controlled release over 7 days (n = 3 biologically independent experiments). e,f, Cellular uptake assays demonstrate the propensity of SWNTs to specifically accumulate in murine macrophages (RAW264.7) compared to endothelial cells and VSMCs (n = minimum 3 biologically independent experiments). Flow cytometry histograms of cells from uptake studies with SWNT-Cy5.5, plain SWNTs (not adorned with Cy5.5), and PBS controls. Mϕ, macrophages (e). ***p = 0.0001, ****p < 0.0001 by one-way ANOVA with a Tukey post-hoc test. g, In vitro phagocytosis assays confirm that SWNT-SHP1i augments the clearance of apoptotic vascular cells by macrophages at least as potently as gold standard anti-CD47 antibodies, compared with SHP1i and SWNT controls (n = 5 biologically independent experiments). *p < 0.05 by unpaired two-tailed t-test. **p < 0.01 by one-way ANOVA with a Tukey post-hoc test. For all graphs, data are expressed as the mean and standard error of the mean (s.e.m.).
Preparation and characterization of SWNT-SHP1i
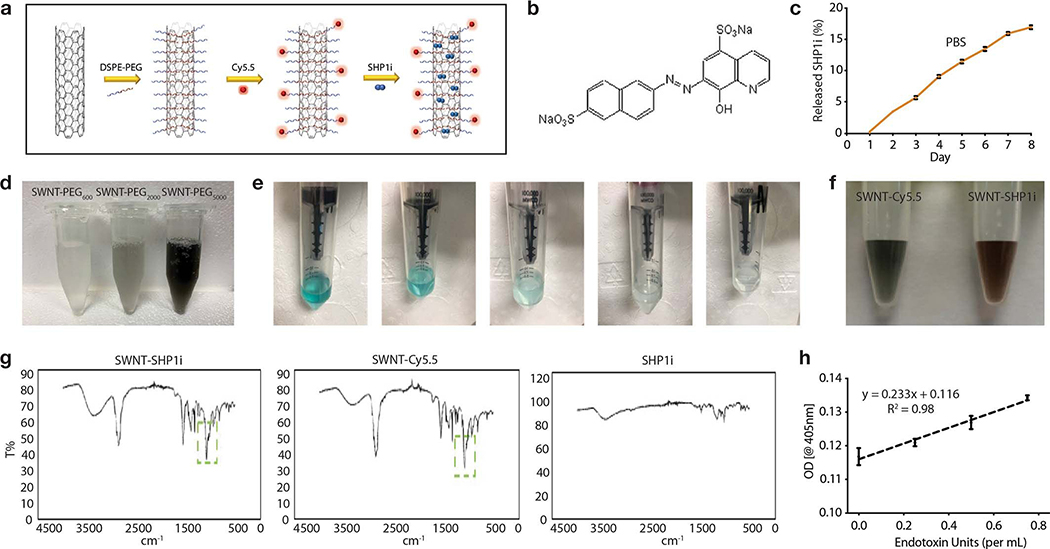
After fabricating SWNT-PEG-Cy5.5 (SWNT-Cy5.5) as previously described16, we loaded them with a SHP1 inhibitor (SHP1i) (Fig. 1a, Extended Data Fig. 1). PEG was used to disperse SWNTs in aqueous solutions, endow biocompatibility, and prolong in vivo circulation times.16 As shown by transmission electron microscopy (TEM) with negative staining, PEG-functionalization resulted in well-dispersed cylindrical nanoparticles with a PEGylated diameter of 5–6 nm, including a 2–3 nm core nanotube structure (Fig. 1b). We employed fluorescent Cy5.5 dye for flow cytometric characterization and loaded SHP1i onto SWNTs through π-π stacking and hydrophobic interactions.13 UV-visible spectroscopy validated the presence of Cy5.5 (sharp peak at 674nm) and SHP1i loading (absorption peaks at 230, 320, 490 nm over the characteristic SWNT absorption spectrum) (Fig. 1c). The presence of Cy5.5 and SHP1i on SWNTs was further confirmed by 1) the visible color change in the SWNT-SHP1i solution upon SHP1i adsorption; 2) attenuated total reflectance (ATR) infrared spectroscopy (Extended Data Fig. 1); and 3) the shift in ζ-potential of SWNT-Cy5.5 from −6.69±2.11 mV to −7.19±2.53 mV upon SHP1i loading. No endotoxin was detectable in the synthesized SWNT-SHP1i (<0.01 ngmL−1).
To mimic in vivo biological conditions and simulate in vivo release, we studied the release profile of SHP1i from SWNT-Cy5.5 in serum (Fig. 1d). Similar to the release profile in PBS (Extended Data Fig. 1), SWNT-Cy5.5 demonstrated sustained release of SHP1i through 7 days (nearly linear until day two; diminishing rates through day seven). The ability of this system to gradually offload substantial amounts of drug over a week suggest it may be suitable for delivering a sustained payload in vivo.
SWNTs are taken up by macrophages and enhance apoptotic cell phagocytosis in vitro
While we have demonstrated the exquisite selectivity of SWNTs for circulating Ly-6Chi monocytes, their uptake by macrophages and other vascular cells has not yet been determined. Therefore, the propensity of SWNTs to be taken up by phagocytic cells was first examined in murine (RAW264.7) and human (THP-1) macrophages and compared to other vascular cells, such as endothelial and vascular smooth muscle cells (VSMCs). Using Cy5.5-positivity as a surrogate for uptake, flow cytometry revealed that SWNTs were robustly and preferentially taken up by >95% of macrophages, relative to non-phagocytic cells (Fig. 1e–f, Extended Data Fig. 2).
To confirm their ability to inhibit CD47-induced signaling, we next studied the physiologic properties of SWNT-SHP1i. In vitro phagocytosis assays confirmed that SHP1i-conjugated SWNTs potently stimulated the clearance of diseased vascular cells exposed to the pro-atherosclerotic factor TNF-α (Fig. 1g, Extended Data Fig. 2). Interestingly, when compared to anti-CD47 antibodies, SWNT-SHP1i yielded the highest degree of apoptotic-cell clearance. Further, SWNT-SHP1i did not alter the cell viability, proliferation rates, or apoptosis of macrophages (Extended Data Fig. 2). Together, these data indicate that SWNTs stably facilitate the delivery of pro-efferocytic SHP1i specifically to macrophages, enhance their ability to clear apoptotic cells, and do so without altering cell physiology in other ways.
SWNTs accumulate in atherosclerotic lesions in vivo
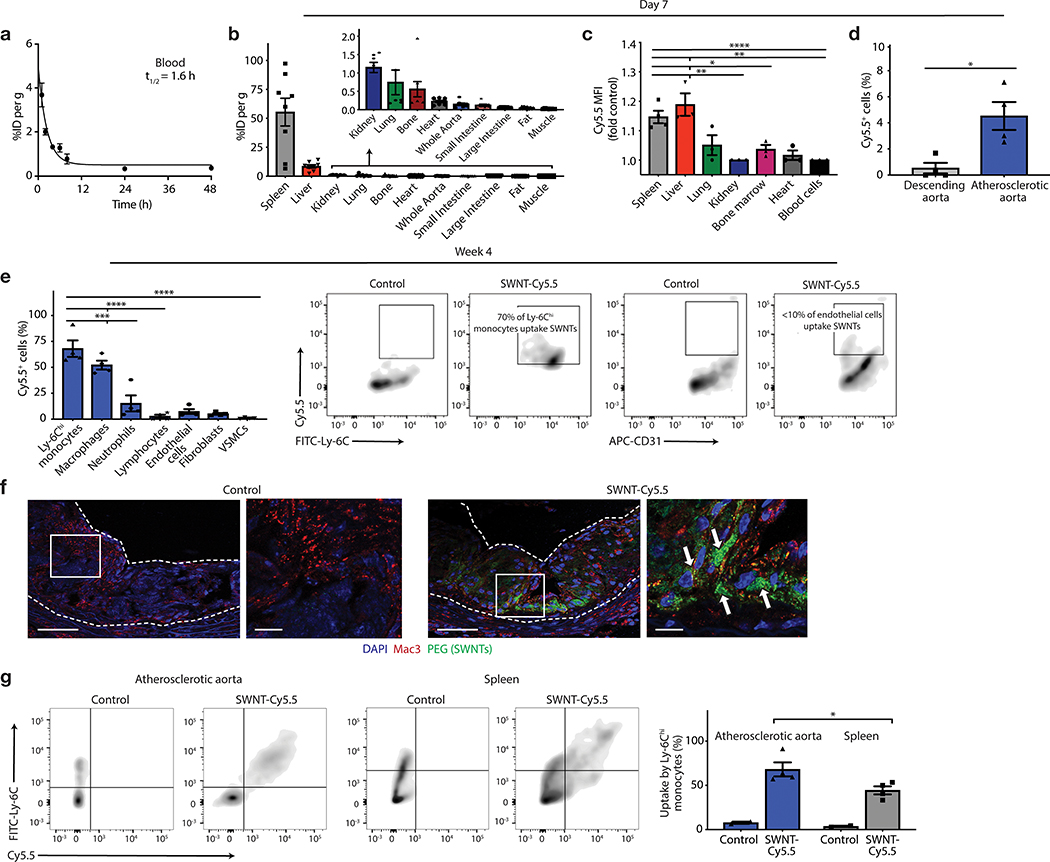
Because we desire an agent that is not only taken up by phagocytes, but also delivers the pro-efferocytic payload to the atherosclerotic lesion, the biodistribution properties of SWNTs were next assessed. These studies were performed using a combination of radiochemical, flow cytometric, and histological approaches in apolipoprotein-E-deficient (apoE−/−) mice with established plaques after a single systemic infusion of SWNTs labeled with Cy5.5 and/or 89Zr. Pharmacokinetic analysis of 89Zr-radiolabeled SWNTs demonstrated excellent serum stability and a blood half-life (t1/2) of 1.64hr (Fig. 2a, Extended Data Fig. 3). Consistent with prior reports demonstrating SWNT distribution to organs of the reticuloendothelial system15,21,22, we observed high initial uptake of radiolabeled SWNTs in macrophage-rich clearance organs, such as the spleen and liver 7 days post-injection (Fig. 2b). Flow cytometry analyses of homogenized organs confirmed this distribution pattern, and demonstrated the specific accumulation of SWNTs locally within the microdissected plaque, relative to the surrounding non-atherosclerotic aorta one week after treatment (Fig. 2c–d). Confocal microscopy further revealed significant SWNT accumulation within the atherosclerotic aortic sinus, with minimal to no accumulation in other non-clearance organs or the healthy aorta (Extended Data Fig. 3). No significant uptake was observed in bone marrow, heart, lung, gut, fat, muscle or kidney (Fig. 2b–c).
Figure 2: SWNTs accumulate within phagocytes in the atherosclerotic plaque.
a, Blood decay curve of 89Zr-radiolabelled-SWNTs. The mean t1/2 was calculated as 1.64hr (R2 = 0.96; n = minimum 4 biologically independent animals per time point). b, Quantitative biodistribution studies 7 days after intravenous administration of 89Zr-SWNTs reveal that SWNTs primarily accumulate in organs with high macrophage content, such as the spleen and liver (n = 8 biologically independent animals). c,d, Flow cytometry analyses of homogenized organs confirm the trend for enhanced uptake by organs of the reticuloendothelial system (c), and reveals that SWNT accumulation is largely restricted to the macrophage-rich plaque, as compared to the less disease-prone descending aorta (n = minimum 3 biologically independent animals) (d). *p < 0.05 by unpaired two-tailed t-test in (c). *p < 0.05, **p < 0.01, ****p < 0.0001 by one-way ANOVA with a Tukey post-hoc test in (d). e-g, Following 4 weeks of weekly SWNT administration, SWNTs specifically accumulate within Ly-6Chi monocytes and macrophages in the atherosclerotic aorta, while SWNT detection is low in other vascular cells (n = 4 biologically independent animals) (e). ***p < 0.001, ****p < 0.0001 one-way ANOVA with a Tukey post-hoc test. Lesional macrophage (red) and SWNT (green) co-localization is confirmed by confocal images of the aortic sinus (co-localized regions indicated by arrows). Scale bar, 50 μm (right panel, 25 μm). (f). Enhanced uptake is observed by Ly-6Chi monocytes in the aorta compared to the spleen, suggesting that SWNTs may be efficiently delivered to the diseased artery by inflammatory monocytes (n = 4 biologically independent animals) (g). *p < 0.05 by unpaired two-tailed t-test. Data in f are representative of 4 independent experiments. For all graphs, data are expressed as the mean and s.e.m.
SWNTs are taken up by lesional macrophages
Prior studies in non-vascular mouse models revealed that >99% of inflammatory Ly-6Chi monocytes (but <3% of other circulating immune cells) internalize SWNTs within 2hrs of administration.16,23 To identify the specific vascular cell type(s) in which SWNTs chronically accumulate in vivo, we next performed high-dimensional 9-color flow cytometry of digested atherosclerotic aortae after a course of serial SWNT injections. After four weekly SWNT injections, ~70% of lesional Ly-6Chi monocytes and ~60% of macrophages had taken up SWNTs (versus only ~15% of neutrophils, ~5% of endothelial cells, and ~5% of fibroblasts). Negligible amounts of SWNTs were detected in lymphocytes or VSMCs (Fig. 2e, Extended Data Fig. 4). Confocal microscopy confirmed that SWNTs co-localize with lesional macrophages (Fig. 2f, Extended Data Fig. 4). Flow cytometry showed that a greater percentage of Ly-6Chi monocytes had taken up SWNTs in the atherosclerotic aorta than the spleen after 4 weeks of therapy (Fig. 2g). There are two major mechanisms that likely explain this pattern of uptake and robust plaque accumulation. First, SWNTs are taken up by circulating monocytes and traffic to the site of vascular inflammation, as occurs during atherogenesis.17 Second, SWNTs passively target lesional macrophages (e.g. extravasation through disrupted plaque vessels). Altogether, these data indicate that SWNTs chronically accumulate in the desired plaque-resident phagocytes.
Pro-efferocytic SWNTs prevent atherosclerosis
To assess the therapeutic effect of SWNT-SHP1i on atherosclerosis, we employed two independent murine models of vascular disease (Extended Data Fig. 5). These included an accelerated inflammation model (dyslipidemic apoE−/− mice implanted with subcutaneous angiotensin II-infusing minipumps24), and a chronic atherosclerosis model (apoE−/− mice fed high-fat ‘Western’ diet for 11 weeks). Compared to control treatment (SWNT-Cy5.5), treatment with SWNT-SHP1i via weekly injections resulted in a significant anti-atherosclerotic effect in both models and both sexes (Fig. 3a, Extended Data Fig. 5–6). Analysis of intraplaque SHP-1 phosphorylation (activity) confirmed that SWNT-SHP1i interrupts the key effector of anti-phagocytic signaling downstream of CD47-SIRPα (Fig. 3b).25 To explore efferocytosis in vivo, lesions were assessed for their phagocytic index, or the number of apoptotic cells that were either “free” or associated with macrophages due to efferocytosis.6,26 Consistent with findings from in vitro phagocytosis assays, the ratio of free vs. macrophage-associated apoptotic cells was lower in lesions from SWNT-SHP1i animals, indicating enhanced efferocytic activity in the vascular bed (Fig. 3c). As expected, lesions from SWNT-SHP1i treated mice also displayed smaller necrotic cores (Fig. 3d) and reduced accumulation of apoptotic bodies (Fig. 3e). These therapeutic benefits occurred independently of any changes in traditional cardiovascular risk factors, including blood pressure, lipid, and glucose levels (Extended Data Fig. 5).
Figure 3: Pro-efferocytic SWNTs prevent atherosclerosis.
a, Mice treated with SWNT-SHP1i (n = 19) develop significantly reduced plaque content in the aortic sinus, relative to SWNT-Cy5.5 controls (n = 17). These findings were confirmed in a second atherosclerosis model (see Extended Data Fig. 5). **p < 0.01 by two-sided Mann-Whitney U test. Scale bar, 250 μm. b, Compared to control (n = 8), SWNT-SHP1i (n = 9) decreases phosphorylation of SHP-1, indicating silencing of the anti-phagocytic CD47-SIRPα signal. *p < 0.05 by unpaired two-tailed t-test. Scale bar, 100 μm. c-e, Lesions from mice treated with pro-efferocytic SWNTs are more likely to have apoptotic cells (indicated by arrows) that have been ingested by lesional macrophages (n = 9 biologically independent animals per group; scale bar, 25 μm) (c), develop smaller necrotic cores (indicated by dotted lines, n = 16 biologically independent animals per group; scale bar, 50 μm) (d), and accumulate less apoptotic debris (as assessed by percentage of cleaved caspase-3+ area in the plaque, indicated by stars, n = 9 biologically independent animals per group; scale bar, 50 μm) (e). **p < 0.01 by unpaired two-tailed t-test in c and by two-sided Mann-Whitney U test in d and e. f, 18F-FDG PET/CT imaging demonstrates that SWNT-SHP1i significantly reduces vascular inflammation (see Supplementary Video 1). SUVmean, mean standardized uptake value. For all graphs, data are expressed as the mean and s.e.m.
Efficient efferocytosis also acts to resolve inflammation and prevent the secondary necrosis of dead cells.2,27 To assess whether SWNT-SHP1i prevented the inflammatory consequences of defective efferocytosis, we next performed in vivo 18F-fluorodeoxyglucose positron emission tomography/computed tomography (18F-FDG PET/CT) imaging (Supplementary Video 1).28 Mice treated with SWNT-SHP1i displayed reduced aortic uptake of 18F-FDG after treatment compared to controls (Fig. 3f), indicating decreased arterial inflammation. Because persistent inflammation is known to promote plaque vulnerability and the risk for acute cardiovascular events, the apparent ability of pro-efferocytic SWNTs to combat inflammation is particularly intriguing.
Single-cell RNA-sequencing reveals an anti-inflammatory signature of macrophages exposed to pro-efferocytic SWNTs
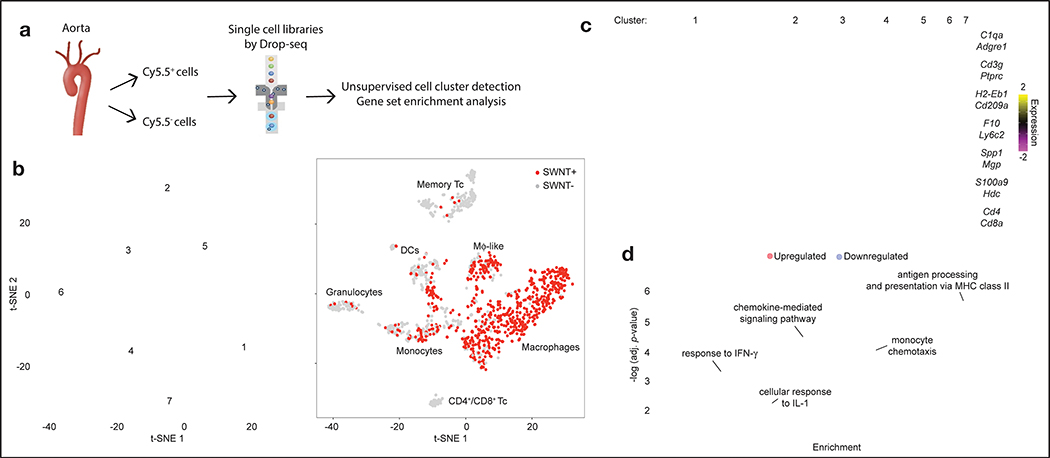
To assess the impact of chronic efferocytosis stimulation on lesional macrophages, large-scale single-cell RNA sequencing (scRNA-seq) was performed on leukocytes from the aortae of SWNT-Cy5.5 and SWNT-SHP1i treated mice. Following fluorescence-activated cell sorting (FACS) for Cy5.5+ vs. Cy5.5− cells, single-cell transcriptional profiles were obtained using droplet-based sequencing (Fig. 4a, Extended Data Fig. 7). After quality control and filtering, we analyzed ~1,500 immune cells with a mean of~90,000 sequencing reads per cell and expression quantified across 15,309 genes (Extended Data Fig. 7). Unsupervised clustering grouped cells according to their expression pattern and detected 7 distinct leukocyte clusters in the combined datasets from the aortae of SWNT-Cy5.5 and SWNT-SHP1i treated mice (Fig. 4b–c). The major cell types were defined according to established immune cell markers and cluster-specific marker genes (Supplementary Table 1, Extended Data Fig. 7), which identified macrophages (Cluster 1), memory T cells (Cluster 2), dendritic cells (DCs, Cluster 3), monocytes (Cluster 4), granulocytes (Cluster 6), and a mix of CD4+/CD8+ cells (Cluster 7). Cluster 5 contained a “macrophage-like” cell type that expressed myeloid-macrophage markers (Cd68, Lgals3, Trem2) and genes associated with SMCs and adventitial cells (Spp1, Acta2, Mgp).29
Figure 4: Single-cell transcriptomics reveal genes and key molecular pathways modulated by chronic CD47-SIRPα blockade in lesional macrophages.
a, Workflow for scRNA-seq including aortic cell isolation, drop-sequencing, and downstream analyses. b, Unsupervised dimensionality reduction identifies 7 major cell types with similar gene expression from the combined SWNT-Cy5.5 control and SWNT-SHP1i datasets (n = 4 biologically independent animals per group). Data is visualized using t-distributed stochastic neighbor embedding (t-SNE) plots, showing the 7 distinct cell clusters (left), and SWNT detection in each cell (right). SWNT-positive cells are the most prevalent in lesional macrophages (Cluster 1) and macrophage-like cells (Cluster 5, Extended Data Fig. 7). Memory Tc, memory T cells; DCs, dendritic cells; Mϕ-like, macrophage-like; CD4+/CD8+ Tc, CD4+/CD8+ T cells. c, Heatmap showing gene expression of 10 cluster-defining genes and leukocyte markers (see Supplementary Table 1 for full list of cluster markers). d, Single-cell differential gene expression analysis identify the genes regulated by SWNT-SHP1i specifically in lesional macrophages (n = 4 biologically independent animals per group). Gene Ontology (GO) enrichment and pathway analyses reveal that CD47-SIRPα blockade results in an increase in expression of genes related to antigen processing and presentation, and the downregulation of genes associated with monocyte chemotaxis, chemokine signaling, and the cellular response to the pro-inflammatory cytokines, interleukin-1 (IL-1) and interferon-γ (IFN-γ). The subclasses of the top GO biological processes (fold enrichment > 10, adjusted p-value < 10−2) are shown. Size of circles are proportional to the enrichment of each biological process. Functional enrichment was assessed using two-sided Fisher’s exact test with p-value adjustment by Bonferroni correction.
Following validation of SWNT selectivity for macrophages by assessing the frequency of Cy5.5+ cells in each cluster (Fig. 4b, Extended Data Fig. 7), differential expression (DE) analysis was performed to investigate the SWNT-SHP1i-dependent transcriptional response. Gene expression changes in FACS-sorted SWNT-positive cells were compared between treatment groups. We found that SWNT-SHP1i elicited numerous changes in lesional macrophages, including a decrease in pro-inflammatory transcripts (Ccl2, Ccl7, Ccl8, Pf4), and upregulation of genes linked to inflammation resolution (Socs3, Zfp36)30,31 (Supplementary Table 2). Using the identified DE genes, we then applied a bioinformatics approach to explore the upstream regulators and functional significance of such alterations. As expected, both SIRPA (p=3.26×10⁻³) and the SHP-1 encoding gene, PTPN6 (p=4.05×10⁻²) were predicted to mediate the observed transcriptional changes. Lesional SWNT-SHP1i treated macrophages were enriched for genes associated with phagocytosis (p=1.78×10⁻⁷) and antigen presentation (p=1.63×10⁻⁷), a process known to be upregulated in macrophages engaged in necrotic cell clearance32 (Supplementary Tables 3–4).
Pathway analyses also revealed that SWNT-SHP1i induced an expression signature in macrophages that reflects a decreased inflammatory response (p=5.5×10⁻¹³) and reduced chemotaxis of mononuclear leukocytes (p=2.6×10⁻⁶). Interestingly, Gene Ontology (GO) enrichment analysis further showed that macrophages downregulated genes implicated in the response to interleukin-1 (IL-1, p=8.1×10⁻³) and interferon-gamma (IFN-γ, p=7.85×10⁻⁴) (Fig. 4d, Supplementary Tables 5–6). In accordance with our observations from PET/CT imaging, it appears that targeted efferocytosis stimulation may reduce vascular inflammation without resulting in serious complications like immunosuppression, as described below.
Pro-efferocytic SWNTs have a favorable safety profile in vivo
Lastly, given that pro-efferocytic antibodies are compromised by adverse effects such as anemia, the safety profile of SWNT-SHP1i was formally assessed. Previous studies have shown that similarly PEG-functionalized SWNTs do not cause acute or chronic toxicities in mice, encouraging further exploration of their applications in medicine.14,15 SHP1i-conjugated SWNTs also appeared to be biocompatible and well-tolerated (Extended Data Fig. 8). Clinical hematology and chemistry results from SWNT-SHP1i treated mice demonstrated no significant alterations, although there was a decrease in the platelet indices platelet:large cell ratio and mean platelet volume (Extended Data Fig. 8–9). These indices are generally interpreted clinically in the context of thrombocytopenia or thrombocytosis.33 Platelet levels of SWNT-SHP1i treated animals, however, were in the normal range and there was no difference in bleeding or clotting events observed between treatment groups. SWNT-SHP1i treatment was also not associated with an increase in leukopenia, neutropenia, or clinical infections. In addition, SWNT-SHP1i therapy was associated with a reduction in high-sensitivity C-reactive protein (hs-CRP) levels, a marker of inflammation and cardiovascular risk.34
Importantly, SWNT-SHP1i treatment was not associated with anemia, the major complication impeding the translation of pro-efferocytic antibodies (Fig. 5a). Mice did not develop a compensatory reticulocytosis or splenomegaly (Fig. 5b–c), as occurs in response to indiscriminate (systemic) CD47 blockade and the erythrophagocytosis of opsonized red blood cells.5,6,35 Of note, SHP-1 is primarily expressed in hematopoietic cells, where it negatively regulates multiple pathways in the immune response.36 Global SHP-1 deficiency is known to cause defects in hematopoiesis and early mortality due to severe interstitial pneumonitis and glomerulonephritis.37 Given that SWNT-SHP1i treatment did not demonstrate any of these potential toxicities (Extended Data Fig. 8–9), these data are consistent with the ability of SWNTs to avoid off-target effects due to their specific accumulation within monocytes and macrophages.
Figure 5: Pro-efferocytic SWNTs do not induce clearance of healthy tissue.
a,b, Mice treated with SWNT-SHP1i (n = 22 biologically independent animals) do not develop anemia (a) or a compensatory reticulocytosis (b), which occurs in response to anti-CD47-antibody treatment due to the off-target elimination of opsonized red blood cells. **p < 0.01, ****p < 0.0001 by unpaired two-tailed t-test. c, No significant difference is observed for the weight of the spleen between groups, suggestive of the lack of red blood cell clearance due to Fc-dependent erythrophagocytosis (n = 23 biologically independent animals per group, p = 0.065). IgG and anti-CD47 antibody data in a and b are previously reported (n = 11 biologically independent animals per group).6 For all graphs, data are expressed as the mean and s.e.m.
Conclusions
Cardiovascular disease remains the world’s leading killer. Most currently-available therapies only target traditional risk factors (such as hypertension and hyperlipidemia) and do not specifically inhibit the intrinsic, disease-causing pathways known to be active in the vessel wall. Because the “inflammatory hypothesis” of atherosclerosis has now been definitively established34, and because robust genetic causation studies have implicated defective efferocytosis as a key driver of plaque expansion38, new orthogonal therapies for these risk factor-independent pathways are sought. While major progress has been made in developing agents which can suppress lesional inflammation (e.g. anti-IL-1β antibodies) and/or reactivate engulfment of apoptotic debris in the necrotic core (e.g. anti-CD47 antibodies), each of these approaches has an Achilles heel which may limit its translational relevance. For example, the CANTOS trial revealed that systemic inhibition of the IL-1β pathway potently reduced inflammation and recurrent major cardiovascular events (without altering lipid levels), but unfortunately these benefits were offset by a concomitant increase in fatal infections.34 Similarly, the first human trial of a pro-efferocytic therapy recently provided tantalizing evidence that anti-CD47 antibody might slow the progression of Hodgkin’s lymphoma, but also came at a cost of increased anemia, as expected.35 Accordingly, more precise targeting of these processes is required if such cutting-edge therapies are to be broadly translated to the cardiovascular realm.
The advent of modifiable, macrophage-specific NPs therefore represents a significant advance in the fight against atherosclerosis. While NPs have been developed for imaging and treatment of atherosclerosis, the lack of sufficient selectivity of the NP to the target cell (e.g. inflammatory monocytes) and desired end organ has hampered their efficacy and utility.39,40 By combining innovations in vascular biology and nanotechnology, we engineered a “Trojan horse” system which accumulates in the lesional phagocyte, reactivates efferocytosis locally, and reduces plaque burden, without inducing significant off-target toxicity. SWNTs have also proven to be safe and non-immunogenic in non-human primates41, and mechanistic studies have revealed that SWNTs undergo elimination by immune cell peroxidases such as myeloperoxidase in a matter of weeks.42,43 This biocompatibility is of crucial importance for the safety of SWNTs. Moreover, our scRNA-seq data indicate that pro-efferocytic SWNTs have the unexpected benefit of suppressing cytokine-dependent vascular inflammation (without the undesirable immunosuppression associated with systemic anti-IL-1β therapy).
While our current and previous studies16 demonstrate the remarkable selectivity of SWNTs for monocytes and macrophages, further understanding of the mechanism of SWNT selectivity and incorporation of molecular targeting ligands may enable more efficient delivery to the diseased site, or even specific macrophage subsets. Because the SWNT backbone can be modified to deliver multiple therapeutic agents into the same cell, future studies should determine whether bi-specific nanoimmunotherapies that simultaneously target efferocytosis and other aspects of macrophage biology (e.g. cholesterol efflux, macrophage skewing) might have a synergistic effect. In addition, unchecked inflammation in atherosclerosis results from the defective clearance of cells that have undergone multiple forms of cell death, such as necroptosis and pyroptosis.44 Targeting the CD47-SHP1i pathway could thus restore the phagocytosis of apoptotic and non-apoptotic cell debris that contribute to inflamed and unstable lesions. Future studies should address whether such pro-efferocytic nanotherapies may promote plaque stabilization in advanced disease. Indeed, nanotherapeutics that promote local inflammation resolution have been shown to improve fibrous cap thickness and have a potent atheroprotective effect.45 Given the parallels between plaque-resident and tumor-associated macrophages, it will be interesting to determine whether this platform could also be adapted as a precision therapeutic for the field of immuno-oncology.
Methods
Preparation and characterization of SWNT-SHP1i
The functionalized SWNTs were prepared as previously reported16, with slight modifications as follows. Raw HiPco (high-pressure catalytic decomposition of carbon) SWNTs (Unidym; diameter 0.8–1.2 nm) were added in an aqueous solution of DSPE–PEG5000–amine (1,2-distearoyl-sn-glycero-3-phosphoethanolamine-N-[amino(polyethylene glycol)-5000], NOF Corp) and sonicated for at least 1hr, then centrifuged at 100,000g for 1hr to obtain PEGylated SWNTs. Unbound surfactant was washed by repeated filtration through 100kDa filters (Millipore). For conjugation of Cy5.5 Mono NHS Ester (GE Healthcare) to SWNT-PEG, Cy5.5 Mono NHS Ester was incubated with SWNT-PEG solution (10:1 mole ratio) for 2hr. Excess Cy5.5 dye was removed by five to six rounds of centrifugal filtration until the filtrate became clear (Extended Data Fig. 1). SWNT concentrations were determined spectrophotometrically with an extinction coefficient of 7.9×10⁶M−1cm−1 at 808 nm.46,47 For SHP1i loading, the SHP1i solution was added to stirred SWNT-PEG-Cy5.5 (SWNT-Cy5.5) at 4°C at pH=7.4 overnight to form SWNT-PEG-Cy5.5-SHP1i (SWNT-SHP1i). After 24hr of stirring, SWNT-SHP1i was dialyzed for another 24hr next to PBS to remove unbound SHP1i molecules. The concentration of loaded SHP1i were measured using nanodrop (Thermo Scientific, Nanodrop2000) at its absorption of 320 nm.
To verify the synthesis of SWNT-SHP1i, after each step of synthesis, UV-vis spectroscopy and ATR infrared spectroscopy in the 4,000–500 cm−1 region (Nicolet iS50 FT/IR Spectrometer) were performed for PEGylated-SWNTs, SWNT-Cy5.5, SWNT -SHP1i, and SHP1i. The surface charge of SWNT-Cy5.5 and SWNT-SHP1i were recorded in deionized water using a ZetaSizer Nano ZS (Malvern Instruments). Further SWNT characterization methods may be found in the Supplementary Information.
Preparation and characterization of 89Zr-SWNTs
20 μL of Sulfo-SMCC solution (2mgmL−1) was added to 0.5 mL of SWNT-Cy5.5 (1μM) and stirred at room temperature for 2hr. Afterward, excess Sulfo-SMCC was removed by multiple washes using centrifugal filtration (100 kDa). 200 μL of p-SCN-Bn-DFO (2mgmL−1) solution in DMSO were then added to SWNT-Cy5.5-Sulfo-SMCC and incubated for 24hr. Extra chelators were washed by repeating the washing steps using centrifugal filtration (100 kDa). 89Zr-oxalate (Stanford Cyclotron & Radiochemistry Facility) was diluted with PBS (pH=7.4) and a fraction of this solution was added to 0.5 mL of DFO-conjugated SWNT-Cy5.5 and incubated for 1h at 37° with constant shaking. Excess 89Zr was removed by centrifugal filtration (100 kDa) for 6–8 min at 4,000G. Instant thin-layer chromatography (ITLC) was used to determine radiolabeling yield. A Capintec (CRC®−15R) Dose Calibrator and Hidex Gamma Counter were used to measure radioactivity of 89Zr-SWNT-Cy5.5. The radiochemical purity was 100%. Serum stability experiments were performed at 37 °C in fresh mice serum (Extended Data Fig. 3).
Transmission electron microscopy of SWNTs
For SWNT-PEG negative staining, 10 μL of 10 nM SWNT-PEG were drop casted onto ultrathin lacey carbon 400 mesh TEM grids (Ted Pella. Inc.) and incubated for 10 minutes. The grids were then washed with ultrapure water and negatively stained with 1% uranyl acetate for 30 seconds and subsequently dried on Whatman grade 1 filter paper. A Cs-corrected Titan transmission electron microscope (Thermo Fisher Scientific) was operated with an acceleration voltage of 80 kV and monochromator excitation value of 1. High resolution TEM images were taken on a Gatan OneView camera via digital micrograph.
Cell culture
Mouse macrophages (RAW264.7, ATCC TIB-71) and mouse yolk sac endothelial cells (C166, ATCC CRL-2581) were grown in Dulbecco’s Modified Eagle Medium (DMEM) with 10% fetal bovine serum (FBS), while human monocyte cell line (THP-1, ATCC TIB-202) were grown in RPMI-1640 medium containing 10% FBS and 0.05 mM 2-mercaptoethanol. Primary vascular SMCs were harvested from the aortae of C57Bl/6 mice and propagated in DMEM with 10% FBS.38 Human coronary artery SMCs (HCASMCs, Lonza CC-2583) and human aortic endothelial cells (HAECs, Lonza CC-2535) were cultured and maintained according to the manufacturer’s (Lonza) instructions. All cells were cultured in a humidified 5% CO2 incubator at 37°C. The cell lines were authenticated by the supplier. None of the cell lines were tested for mycoplasma contamination.
SWNT in vitro uptake assay
Cells were plated in 24-well plates (Corning) until approximately 70% confluent and then incubated with SWNT-Cy5.5 (4 nM) for 3hr in serum-free media at 37°C. SWNT-PEG and PBS-treated cells served as negative controls. After washing cells with PBS, cells were collected and analyzed by flow cytometry (Scanford cell analyzer, Stanford Shared FACS facility). Dead cells were excluded using SYTOX Blue stain (Invitrogen, S34837). The rate of SWNT uptake was evaluated by quantifying the percentage of Cy5.5+ cells using FlowJo10.1.r5 (Tree Star, Inc.).
Efferocytosis assay
In vitro phagocytosis assays were performed as previously described.6,38 Briefly, RAW264.7 macrophages were labelled with CellTracker Red (1 μM, Life Technologies) and pre-treated with SWNT (4 nM), SWNT-Cy5.5 (4 nM), SWNT-SHP1 (4 nM), or SHP1i (300 nM) for 30 minutes. For target cells, RAW246.7 cells or primary vascular SMCs were labelled with CellTracker Orange (1.25μM, Life Technologies) and incubated with TNF-α (50 ngmL−1, R&D) for 24hr to induce apoptosis. Apoptotic cells were plated in 24-well dishes at a density of 1.5×10⁵ cells per well. RAW264.7 cells were added to cultured apoptotic cells at 3×10⁵ cells per well and co-incubated for 2hr in serum-free media. Anti-CD47 antibody (10 μgmL−1, MIAP410, BioXcell) was also tested as a positive control.6 Cells were washed with PBS, dissociated from wells, and analyzed by flow cytometry (Scanford cell analyzer). Efferocytic activity was evaluated as the percentage of phagocytes that were double-positive cells using FlowJo10.1.r5.
Experimental animals
Apolipoprotein-E-deficient (apoE−/−) mice on a C57BL/6 background (Jackson Laboratory) were used in the following studies. A total of 136 male and female apoE−/− mice were included. All animals were randomly assigned to the experimental groups. Animal studies were approved by the Stanford University Administrative Panel on Laboratory Animal Care (protocol 27279) and conformed to the NIH guidelines for the use of laboratory animals.
For biodistribution studies, male apoE−/− mice were initiated on high-fat Western diet (21% anhydrous milk fat, 19% casein, and 0.15% cholesterol, Dyets Inc.) at 20–24 weeks of age and maintained on this for 4 weeks.
In the main atherosclerosis intervention studies, 8–10 week old apoE−/− mice were implanted with subcutaneous osmotic minipumps (Alzet, model 2004) containing Angiotensin II (angII, VWR, 1000 ng/kg/min) and initiated on a high-fat Western for the ensuing 4 weeks, as previously described (Extended Data Fig. 5).24 SWNT therapy began one day before osmotic pump implantation and continued weekly for the duration of the study. Both male and female animals were included as per recent NIH policy (Consideration of Sex as a biological variable, NOD-15–102). The “angiotensin infusion” model was also used in the cellular specificity studies, 18F-FDG PET/CT imaging, and scRNA-seq.
In the chronic atherosclerosis studies, 8-week old male apoE−/− mice were initiated on a high fat diet and continued on this for the ensuing 11 weeks (without angiotensin II infusion). At 10 weeks of age, mice were injected as described above for a total of 9 weeks, and were euthanized at the age of 19 weeks.
Flow cytometry of organs
ApoE−/− mice were injected a single dose of SWNT-SHP1i, SWNT-Cy5.5, or plain SWNTs (PEGylated but without Cy5.5) via tail vein, at a dose previously studied (0.068 mgmL−1 SWNTs, 200 μL).16 Mice were euthanized after 7 days, and the peripheral blood, bone marrow, aortae, and visceral organs were collected. Red blood cells were removed from the peripheral blood with ammonium-chloride-potassium (ACK) lysis buffer (Life Technologies). The aortae and visceral organs were homogenized and digested with Liberase TM (Roche, 2UmL−1) and Elastase (Worthington, 2UmL−1) in Hank’s balanced salt solution (HBSS) at 37°C for 1hr. Digested tissue was passed through a 70-μm strainer to obtain single cell suspensions in 1% BSA/PBS and stained with SYTOX Blue. Fluorescence was detected by flow cytometry (Scanford cell analyzer) and analyzed using FlowJo10.1.r5. Cell populations were first gated for non-debris (FSC vs. SSC), then gated for singlets (FSC vs. FSC-W) and viable cells (SYTOX Bluenegative) (Extended Data Fig. 3). The viable, single cells were analyzed for Cy5.5 median fluorescence intensity (MFI), as well as Cy5.5-positivity to determine the percentage of Cy5.5+ cells in each sample. The Cy5.5 MFI was normalized to the autofluorescence of each tissue type, as determined using samples from plain SWNT-injected mice.
Pharmacokinetics and biodistribution studies
The biodistribution studies were carried out at the treatment dose described above with 5–6 MBq of 89Zr-labelled SWNTs. ApoE−/− animals were sacrificed 7 days post-injection (n = 8). The organs were collected into a pre-weighed vial and wet-weighed. The blood half-life was measured by drawing 10 μl of blood from the retro-orbital plexus at pre-specified time points (1hr, 2hr, 4hr, 6hr, 8hr, 24hr, and 48hr; n = 4–5 per time point). Pharmacokinetic analyses were performed by first-order exponential decay fitting. All blood half-life and biodistribution samples were analyzed for 89Zr activity using a gamma counter (Hidex Automatic Gamma Counter) and then background- and decay-corrected to the injection time, converted to MBq using calibrated standards, and the percent injected dose per gram (%ID/g) was determined by normalization to the total activity injected. A SpectraMax iD3 (Molecular Devices, USA) was used for the fluorescence-based blood half-life study (excitation/emission: 678 nm/718 nm).
SWNT cellular uptake profile
Single cell suspensions from the aortae and spleen were obtained as described above and incubated with anti-CD16/32 (BD Biosciences, 553142) and stained on ice for 30 minutes with the following antibodies: Alexa Fluor 594-anti-Vimentin (clone EPR3776, Abcam, ab154207), APC-anti-CD31 (clone 390, Invitrogen, 17–0311-80), FITC-anti-Ly-6C (clone AL-21, BD Biosciences, 553104), PE-Cy5-labeled anti-CD5 (clone 53–7.3, BioLegend, 100609), PE-Cy7-anti-Gr-1 (clone RB6–8C5, Invitrogen, 25–5931-81), APC-Cy7-anti-CD11b (clone M1/70, BioLegend, 101225), and Pacific Blue-anti-F4/80 (clone BM8, BioLegend, 123123). For intracellular staining, cells were fixed and permeabilized with buffers (BD Phosflow Fix Buffer I and Perm Buffer III) according to the manufacturer’s instructions, then stained with Alexa Fluor 488-anti-alpha-smooth muscle actin (α-SMA, clone 1A4, eBioscience, 50–112-4644). Cell suspensions were subjected to flow cytometry (Becton Dickinson LSR II) and analyzed using FlowJo10.1.r5. Macrophages were identified as CD11b+/Ly-6Clow/F4/80+ cells. Ly-6Chi monocytes were identified as CD11b+/Ly-6Chi/F4/80low cells. Neutrophils were identified as CD11b+/Gr-hi cells.
Atherosclerosis intervention studies
To evaluate the therapeutic effect of pro-efferocytic SWNTs, apoE−/− mice were treated with either SWNT-Cy5.5 or SWNT-SHP1i. Mice were treated weekly for 4 weeks in the angiotensin infusion model, and for 9 weeks in the chronic atherosclerosis studies (see timeline in Extended Data Fig. 5). Body weights were evaluated before and after treatment. Animals were observed daily, and in the case of premature sudden death, necropsy was performed to determine the cause of death. Blood pressure was measured in conscious mice at baseline and on a weekly basis throughout the study period (Visitech Systems). Following treatment, mice were sacrificed after an overnight fast, with their aortae, peripheral blood, and visceral organs collected. The weights of the spleen, heart, and kidney were recorded, as well as those of any unusually-sized organs. Complete blood count, metabolic panel, hs-CRP, and lipid profile determinations were performed by the Animal Diagnostic Laboratory in the Stanford Veterinary Service Center.
Tissue preparation and immunohistochemical analysis
For aortic root analysis, mice were perfused with PBS via cardiac puncture in the left ventricle and then perfusion fixed with phosphate-buffered PFA (4%). Aortic roots and visceral organs were collected, embedded in OCT, and sectioned at 7-μm thickness, starting from the base of the aortic root and covering the entire aortic sinus area. Four tissue sections at 100-μm intervals were collected from each mouse and stained with ORO (Sigma Aldrich, O1516). Lesion area was quantified from the luminal aspect of the blood vessel through the plaque to the internal elastic lamina (e.g. lipid in the neointima was quantified) and was normalized to the total vessel area by encircling the external elastic lamina of the aortic wall. Necrotic core size and lesional collagen content was assessed with Masson’s trichrome (Sigma Aldrich). The necrotic core was quantified by measuring the total acellular area within each plaque. Immunohistochemical staining for α-SMA (Abcam, ab5694, 1:300) was performed for analysis of SMC content in the fibrous cap, with detection by the Vulcan Fast Red Chromogen kit (Biocare Medical). To assess lesional SHP-1 activity, sections were co-stained with phospho-SHP1 (Abcam, ab131500, 1:50) and Mac-3 (BD Sciences, BD 550292, 1:100), followed by Alexa Flour 488 and 594 (Life technologies, 1:250), respectively. Phospho-SHP1 area was quantified and normalized to Mac-3 area.6 To assess apoptotic cells (ACs) in lesions, sections were stained for cleaved caspase-3 (Cell Signaling, 9661, 1:200) staining followed by Alexa Fluor 488 goat anti-rabbit (Life technologies, 1:250). The percentage of cleaved caspase-3+ area was calculated and divided by the total atherosclerotic plaque area measured by ORO in serial sections. To study the phagocytosis of ACs by macrophages, the in vivo phagocytic index was calculated.6,26 Sections were co-stained with cleaved caspase-3 and Mac-3, followed by Alexa Flour. The phagocytic index was determined by manually counting the number of free ACs versus phagocytosed (macrophage-associated) ACs. For detection of SWNTs, sections were stained with anti-PEG (Abcam, PEG-B-47, ab51257, 1:100). Frozen lung sections were stained with hematoxylin and eosin (H&E, Richard-Allan). C3 deposition in the kidney was assessed by staining sections with anti-mouse C3 (Abcam, ab11862, 1:100). Lesional SWNT co-localization images were taken on an inverted Zeiss LSM 880 laser scanning confocal microscope. All other images were taken with a Nikon digital camera mounted on a fluorescent microscope and analyzed using Adobe Photoshop CS6 in a blinded fashion.
In vivo PET/CT imaging
18F-FDG-PET/CT imaging was used to assess changes in atherosclerotic inflammation in response to treatment with SWNT-SHP1i or control SWNT-Cy5.5 (n = 8 per group).28 The mice were fasted overnight prior to the scan. Special precautions were taken during isoflurane-induced anesthesia to maintain body temperature (before injection, after injection and during the scan). The radiotracer (15–20 MBq of 18F-FDG; Stanford Cyclotron & Radiochemistry Facility) was administered intravenously to the mice. In addition, a long circulating formulation of iodinated triglyceride (Fenestra VC, MediLumine) was used as contrast agent. 3hr after 18F-FDG administration, the mice were placed on the bed of a dedicated small animal PET-CT scanner (Inveon PET/CT, Siemens Medical Solution), and a 30-min static PET scan was obtained. All images were reconstructed using OSEM. The same acquisition bed was used for the CT scan. The CT system was calibrated to acquire 360 projections (voltage 80 kV; current 500 μA). The voxel size was 0.206 × 0.206 × 0.206 mm3. Region-of-interest (ROI) analysis was performed using IRW software (Inveon Research Workplace, Siemens). 18F-FDG uptake in the thoracic aorta was quantified by drawing 3D ROIs on the axial slices from the CT scan. The standardized uptake values (SUVs) were calculated and the mean value was used.
Aortic single cell preparation for single-cell RNA sequencing
Aortae (including the aortic sinus and aortic arch) were carefully dissected free from the perivascular adipose tissue and cardiac muscle, and then digested into single cell suspensions as described above. Cells were pooled from mice treated with SWNT-SHP1i (n = 4) and SWNT-Cy5.5 (n = 4), and stained with SYTOX Blue to discriminate and exclude non-viable cells. Viable cells (SYTBOX Blue−) were sorted with a 100-μm nozzle into populations that were Cy5.5+ and Cy5.5− using a BD Aria II and collected in PBS + 0.04% BSA.
Single-cell RNA sequencing and data analysis
Samples were resuspended to a concentration of 600–1000 cellsμl−1 in PBS + 0.04% BSA and loaded into the 10X Chromium system to generate single-cell barcoded droplets using the10X Single Cell 3’ reagent kit v2 (10X Genomics), according to the manufacturer’s protocol. The resulting libraries were sequenced on an Illumina HiSeq4000 platform. Detailed methods on library preparation and sequencing may be found in the Supplementary Information.
Single cell RNA-sequencing data was pre-processed using 10x Cell Ranger software (Cell Ranger v3.0.2), including data de-multiplexing, barcode processing, alignment, and single cell 3’ gene counting, as previously described.48 Reads that were confidently mapped to the reference mouse genome (UCSC mm10) were used to generate a gene-barcode matrix for downstream analysis. The filtered gene-barcode matrices containing only cell-associated barcodes were merged into a combined matrix from the above control (SWNT-Cy5.5) and treated (SWNT-SHP1i) datasets. Genes expressed in <5 cells, cells with <200 or >4,000 detected genes, and cells with a percentage of mitochondrial genes >6% were filtered. After additionally filtering adventitial cells, 1,274 immune cells were included to assess the effect of chronic inhibition of the CD47-SIRPα-SHP1 axis. The resulting data was log-normalized, scaled, and regressed on the number of UMIs per cell and the percentage of mitochondrial gene content. Principle component analysis (PCA) was performed for dimensionality reduction using the top 1,000 variable genes ranked by their dispersion from the combined datasets, followed by unbiased clustering analysis based on the identified PCs and t-Distributed Stochastic Neighbor Embedding (t-SNE) for data visualization. To identify cell-type specific responses to SWNT-SHP1i treatment, differential expression tests were performed for cell clusters comparing samples from mice treated with SWNT-SHP1i and SWNT-Cy5.5. DE-genes with p < 0.05 based on the Wilcoxon rank sum test were considered statistically significant. All downstream analyses were performed with the Seurat R package v3.0.49
Pathway analysis
Pathway analysis was performed using significantly up-regulated and down-regulated genes between SWNT-SHP1i and SWNT datasets. Genes were input for pathway analysis by Qiagen Ingenuity Pathway Analysis for upstream regulator analysis and assessment of enriched canonical pathways, diseases, and functions; and PANTHER Pathway for GO term enrichment analysis50 (PANTHER Overrepresentation Test released 2018–11-13, GO Ontology database released 2019–01-01). GOPlot 1.0.2 was used for visualization of results from GO enrichment analysis.
Statistical analysis
Categorical data was compared using the Fisher’s Exact Test. Continuous data are presented as mean ± standard error of the mean and were tested for normality using the D’Agostino Pearson or Shapiro-Wilk test. Groups were compared using the two-tailed Student’s t-test for parametric data and the Mann-Whitney U test for non-parametric data. When comparing more than two groups, data were analyzed using ANOVA followed by Tukey post-hoc tests. Measurements were taken from distinct samples. For atherosclerosis intervention studies, survival analysis was performed using the Kaplan-Meier method, with the log rank test used to compare time-to-mortality curves. A p-value < 0.05 was considered to indicate statistical significance. Statistical analyses were performed using GraphPad Prism 7 (GraphPad Inc.).
Extended Data
Extended Data Fig. 1.
a, Schematic illustrating steps of SWNT-SHP1i preparation. Following SWNT-PEG-Cy5.5 (SWNT-Cy5.5) fabrication, SHP1i is loaded onto SWNT-Cy5.5 by adding SHP1i to a stirred solution of SWNT-Cy5.5 overnight at 4°C and removing free SHP1i molecules by dialyzing with PBS for 24h at 4°C. DSPE-PEG: 1,2-distearoyl-sn-glycero-3-phosphoethanolamine-N-[amino(polyethylene glycol)]. b, Chemical structure of the small-molecule inhibitor of SHP-1. c, Release rates of SHP1i from SWNT-Cy5.5 in PBS (pH=7.4). d, Of the various PEG lengths tested, PEG5000 provided the highest yield (3.5x higher than PEG2000). SWNTs were thus functionalized with PEG5000 for in vitro and in vivo studies. e-f, Photos depicting color change in the SWNT-Cy5.5 filtrate demonstrating removal of excess Cy5.5 (blue color) after each washing step (e), and after loading SWNT-Cy5.5 with SHP1i (red-tinted solution on right) (f). g, Attenuated total reflectance (ATR) infrared spectra for SWNT-SHP1i, SWNT-Cy5.5, and SHP1i. The major spectral features of SHP1i are located in the fingerprint region, containing a complex set of absorptions. The S-O stretch from SO3− in the SHP1i molecule observed at 1034 cm−1 in SHP1i spectra is recapitulated in the SWNT-SHP1i spectrum as an additional spike at 1034cm−1 in comparison with the SWNT spectrum (highlighted in square). These data confirm loading of SHP1i on SWNTs together with UV-vis spectra and the color change of the solution. Data in c-g were repeated 3 times with similar results. h, Quantification of endotoxin levels reveals that SWNT-PEG, SWNT-Cy5.5, and SWNT-SHP1i each have endotoxin levels <0.01 ng/mL (approximately 0.1 endotoxin units per mL; standard curve provided). The assay was performed once with 3 biological replicates. Mean and standard error of the mean (s.e.m.) are shown.
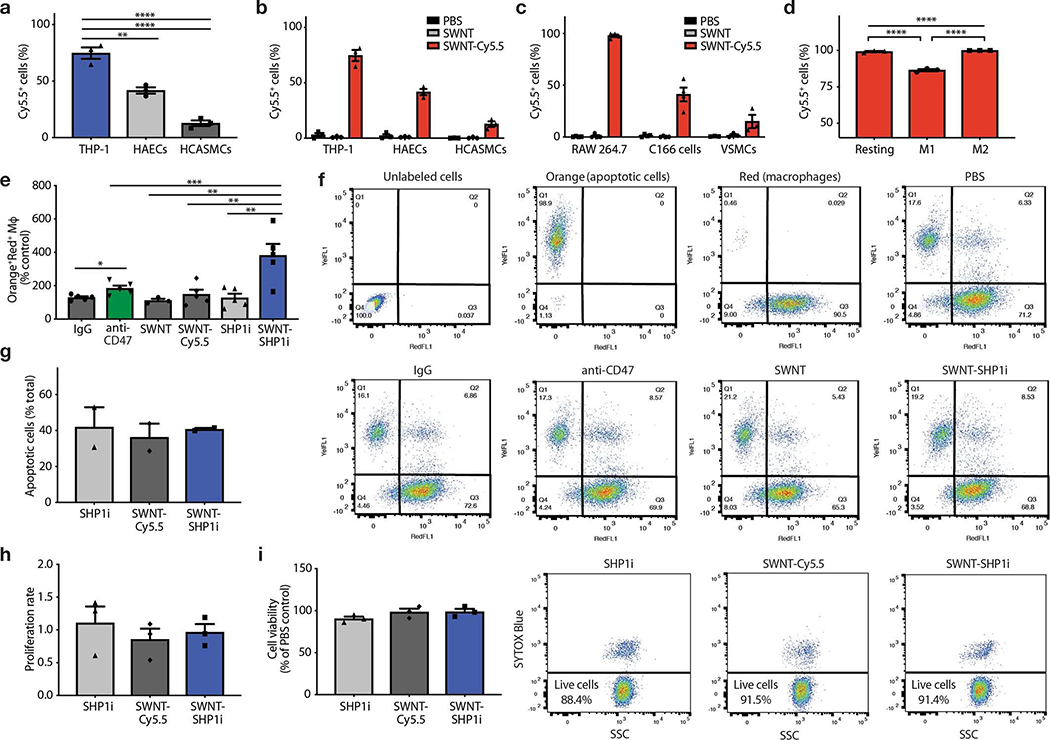
Extended Data Fig. 2.
a-c, In vitro uptake studies show that SWNTs are preferentially taken up by human and mouse macrophages after 3hr incubation. Uptake studies are shown in human macrophages (PMA-differentiated THP-1 cells), human aortic endothelial cells (HAECs), and human coronary artery smooth muscle cells (HCASMCs) (a-b, n = 3), as well as murine macrophages (RAW264.7), endothelial cells (C166), and primary aortic vascular smooth muscle cells (VSMCs) (c, n = minimum 3 per cell type). ***p < 0.001, ****p < 0.0001 by one-way ANOVA with a Tukey post-hoc test. d, SWNTs are taken up by ~100% of basal (M0) and IL-4-polarized (M2) RAW264.7 macrophages, and ~85% of macrophages skewed towards the M1 state with LPS and IFN-γ (n = 3). ****p < 0.0001 by one-way ANOVA with a Tukey post-hoc test. e, The phagocytosis efficiency of macrophages (CellTracker Red+) against apoptotic vascular cells (CellTracker Orange+) is enhanced by SWNT-SHP1i nanoparticles, relative to SWNTs, SWNT-Cy5.5 and SHP1i controls (n = 5). *p < 0.05 by unpaired two-tailed t-test. **p < 0.01, ***p < 0.001 by one-way ANOVA with a Tukey post-hoc test. f, Representative flow cytometry plots and staining controls for the conditions of the in vitro phagocytosis assays. Double-positive cells in the right upper quadrant represent macrophages that have ingested a target apoptotic cell. g, SWNT-SHP1i treatment does not alter the rates of programmed cell death of RAW264.7 macrophages in vitro, as shown by the lack of a difference in TUNEL (terminal deoxynucleotidyl transferase [TdT] dUTP nick-end labeling) staining (n = 2). h, MTT assays show that SWNT-SHP1i has no effect on the proliferation rates of RAW264.7 macrophages in the presence of 10% serum (n = 3). i, Cell viability assays indicate that SWNTs do not affect the viability of RAW264.7 cells, suggesting the absence of a toxic effect on macrophages (n = 3). PBS served as control. Data in f are representative of 5 independent experiments. For all graphs, data are expressed as the mean and s.e.m.
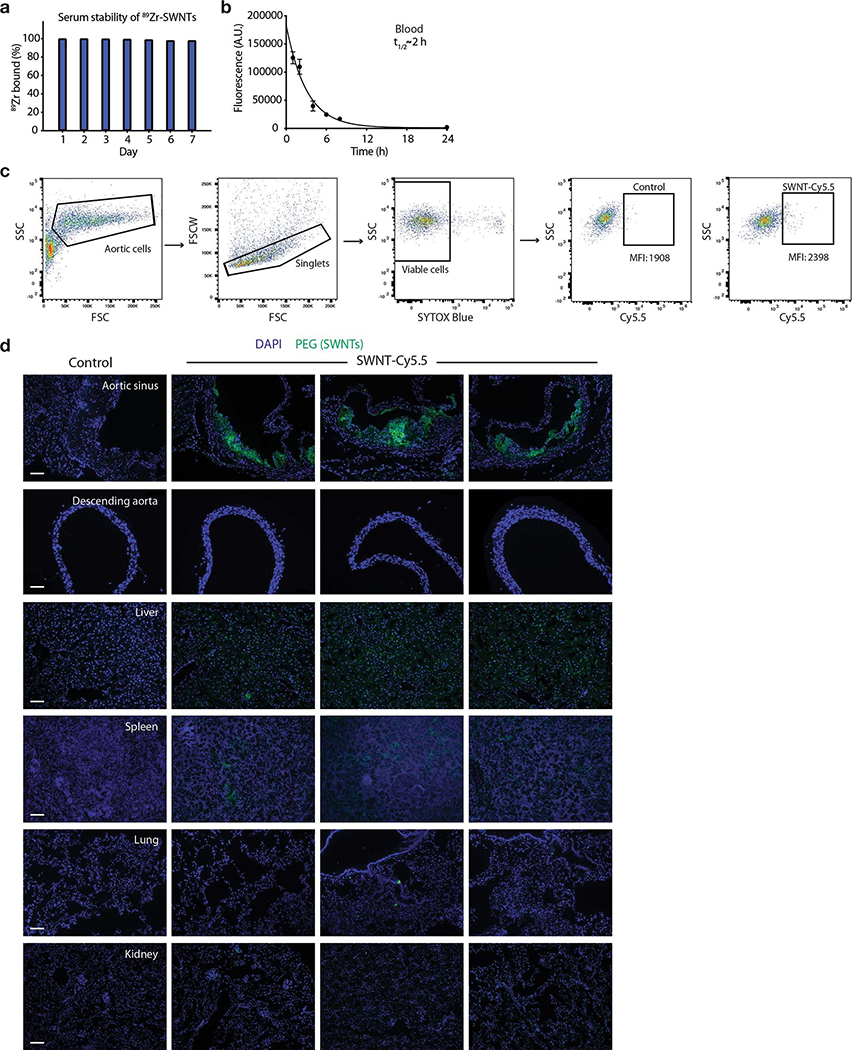
Extended Data Fig. 3.
a, Assessment of serum stability of 89Zr-radiolabeled SWNTs demonstrates no signs of instability for up to 7 days at 37°C in fresh mouse serum. Data are representative of 3 independent experiments. b, Fluorescence-based studies show that the blood half-life (t1/2) of SWNT-Cy5.5 measures ~2hr, indicating that desferrioxamine chelation of 89Zr to SWNT-Cy5.5 does not significantly alter the circulation time of the nanoparticles used in the formal biodistribution studies (n = minimum 4 biologically independent animals per time point). Mean and s.e.m. are shown. c, Representation flow cytometry plots and gating strategy for analysis of SWNT uptake in homogenized organs. d, Immunofluorescence imaging shows SWNT (immunostained for PEG) accumulation in the aortic sinus, with lesser amounts in the spleen and liver, and little-to-no accumulation in other organs such as healthy aorta, lung, and kidney after 4 weeks of weekly serial injections. Data are representative of a minimum of 3 independent experiments. Scale bars, 100 μm.
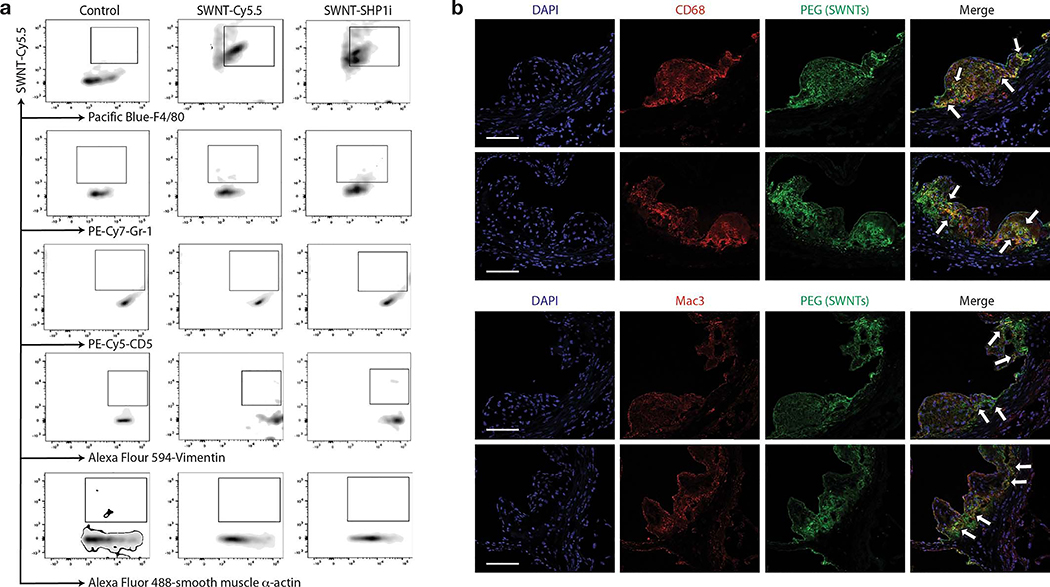
Extended Data Fig. 4.
a, Representative flow cytometry plots from in vivo cellular uptake studies after 4 weeks of serial injections show significant SWNT accumulation in atherosclerotic Ly-6Chi monocytes and macrophages, but low uptake by other vascular cells (n = 4 biologically independent animals). b, Additional confocal images demonstrate co-localization (indicated by arrows) of SWNTs (green) with macrophages (red) in the atherosclerotic aortic sinus. Macrophages were identified by immunostaining for both CD68 (top) and Mac-3 (bottom). Data are representative of 4 independent experiments. Scale bars, 50 μm.
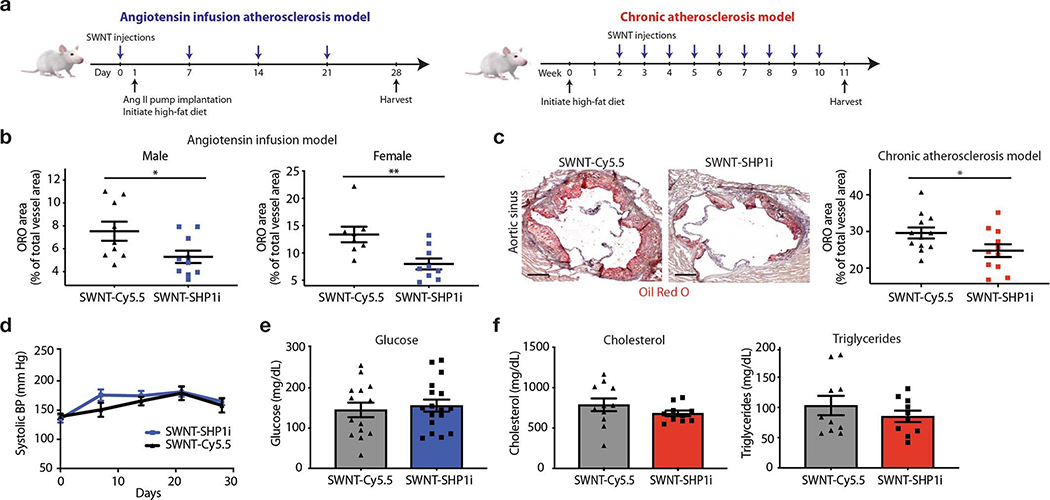
Extended Data Fig. 5.
a, Study timeline detailing the “angiotensin infusion” (which includes 4 weeks of high-fat diet and weekly SWNT injections) and “chronic atherosclerosis” models (which includes 2 weeks of high-fat diet, followed by 9 weeks of SWNT treatment without angiotensin II infusion). The beneficial effect of pro-efferocytic SWNT-SHP1i was confirmed in both models of vascular disease. b, In the main angiotensin infusion model, histological analysis of lesions in the aortic sinus area show that SWNT-SHP1i results in a significant reduction in plaque area in both male (n = 9 biologically independent animals for control group, n = 10 biologically independent animals for SWNT-SHP1i group) and female mice (n = 8 biologically independent animals for control group, n = 9 biologically independent animals for SWNT-SHP1i group), as measured by Oil Red O (ORO) staining. This finding is particularly important given the widely reported sex-dependent effects on atherosclerosis mouse models that is also relevant to human disease.1 *p < 0.05, **p < 0.01 by unpaired two-tailed t-test. c, Similar therapeutic efficacy was observed in the chronic atherosclerosis models (n = 12 biologically independent animals for control group, n = 11 biologically independent animals for SWNT-SHP1i group). *p < 0.05 by unpaired two-tailed t-test. Scale bar, 250 μm. d-f, The benefits of pro-efferocytic SWNT-SHP1i on atherosclerosis occur independently of blood pressure (n = 6 biologically independent animals per group) (d), glucose (n = 14 biologically independent animals for control group, n = 17 biologically independent animals for SWNT-SHP1i group) (d), and cholesterol levels (n = 11 biologically independent animals for control group, n = 10 biologically independent animals for SWNT-SHP1i group) (f). Blue graphs indicate results from the angiotensin infusion model, while red graphs indicated results from the chronic atherosclerosis studies. For all graphs, data are expressed as the mean and s.e.m.
Extended Data Fig. 6.
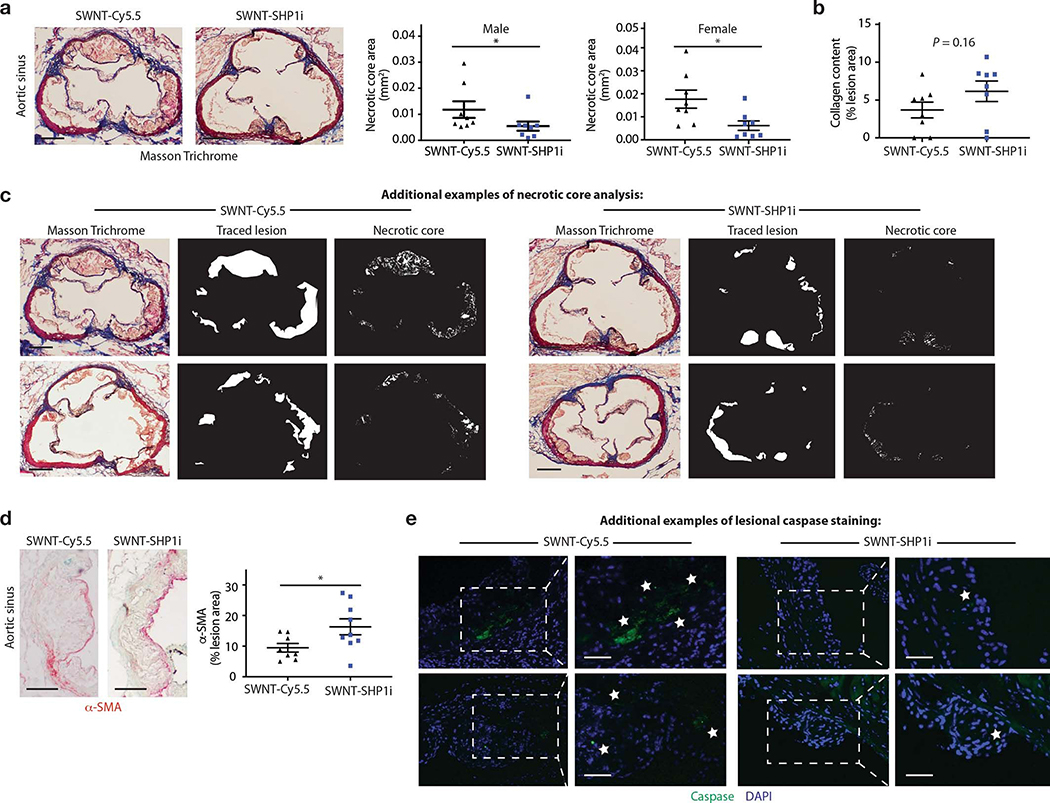
Additional histological analyses confirm that SWNT-SHP1i induces a plaque-stabilizing phenotype. a, Masson Trichrome staining indicates that SWNT-SHP1i reduces the necrotic core in both male (n = 8 biologically independent animals per group) and female mice (n = 8 biologically independent animals per group). *p < 0.05 by two-sided Mann-Whitney U test in left panel, by unpaired two-tailed t-test in right panel. Scale bar, 250 μm. b, A trend towards increased collagen content was also observed after treatment (n = 8 biologically independent animals per group). c, Additional examples of lesion tracing and necrotic core analyses indicating reduced accumulation of apoptotic and necrotic debris after treatment. Data are representative of 16 independent experiments. Scale bar, 250 μm. d, α-SMA staining indicates enhanced smooth muscle cell content in the cap, suggesting a reduction in plaque vulnerability after therapy (n = 8 biologically independent animals for control group, n = 9 biologically independent animals for SWNT-SHP1i group). *p < 0.05 by unpaired two-tailed t-test. Scale bar, 250μm. e, Additional examples of lesional caspase staining (indicated with stars) highlighting a reduction in apoptotic cell content in treated animals. Data are representative of 9 independent experiments. Scale bar, 50 μm. For all graphs, data are expressed as the mean and s.e.m.
Extended Data Fig. 7.
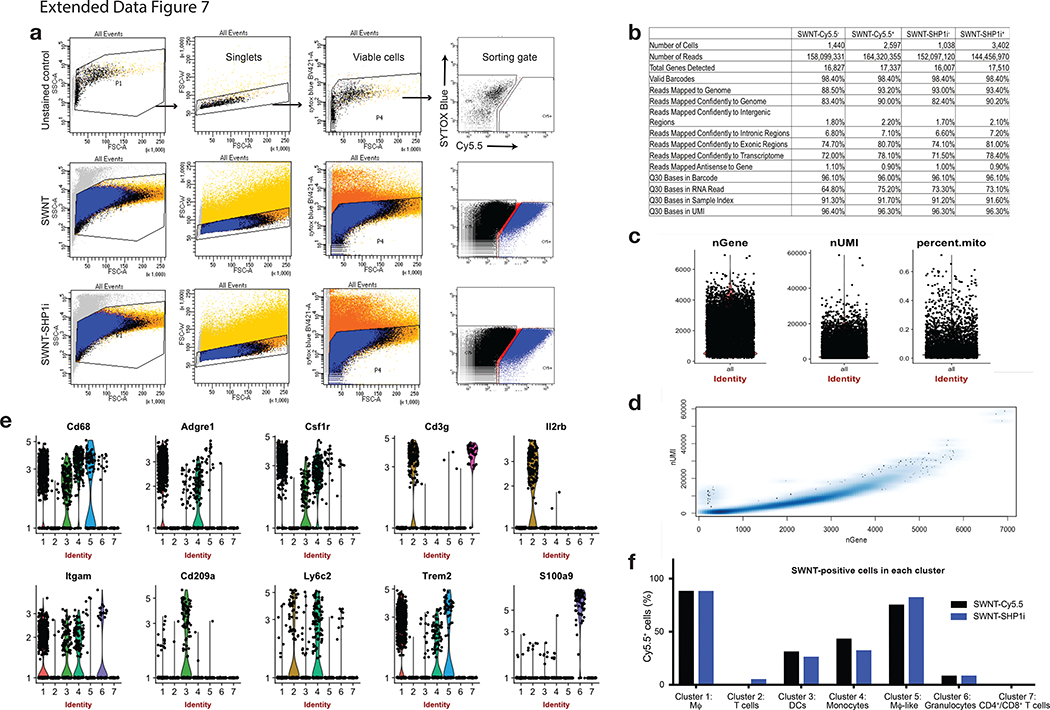
a, Flow cytometry gating strategy for selection of viable (SYTOX Blue−) cells that had taken up SWNTs (Cy5.5+). b, Sequencing data quality metrics for cells isolated from aortae of mice following treatment with SWNT-Cy5.5 or SWNT-SHP1i. c, Violin plots showing number of genes (nGene), unique molecular identifier (nUMI), and percentage of mitochondrial gene reads (percent.mito) for cells in the full dataset (n = 8 biologically independent animals). Each point represents the given value from a single cell. d, Scatterplot of nGene and nUMI across the combined dataset used to identify and exclude outliers (e.g. cell doublets). e, Representative violin plots showing the distribution of gene expression of immune cell markers in the 7 identified leukocyte clusters (n = 8 biologically independent animals). The identity of clusters was defined according to canonical hematopoietic-lineage and immune cell markers: macrophages (Adgre1 encoding F4/80, Cd68, Csf1r), memory T cells (Cd3g, Il2r, Ptprc and Il7r encoding memory markers CD45RO and CD127), dendritic cells (Cd209a, Flt3, Itgax encoding CD11c), monocytes (Ccr2, Ly6c2, Itgam encoding CD11b), granulocytes (Csf3r, S100a9), and CD4+/CD8+ T cell subsets (Cd3e, Cd4, Cd8a). Each point represents log-normalized single cell expression levels. f, Analysis of SWNT-positive (Cy5.5+) cells in each cluster confirms that SWNTs specifically target macrophages in the atherosclerotic aorta. Detection of SWNT uptake was greater in macrophages when characterizing cells by their whole-transcriptome, rather than the traditional limited markers used in flow cytometry above (Fig. 2e, Supplementary Fig. 4). ~90% of lesional macrophages took up SWNTs in both SWNT-Cy5.5 and SWNT-SHP1i treated animals as compared to <30% of dendritic cells and <10% of T cells and granulocytes with SWNT detection. Similarly high SWNT uptake (>75%) was detected in “macrophage-like” cells.
Extended Data Fig. 8.
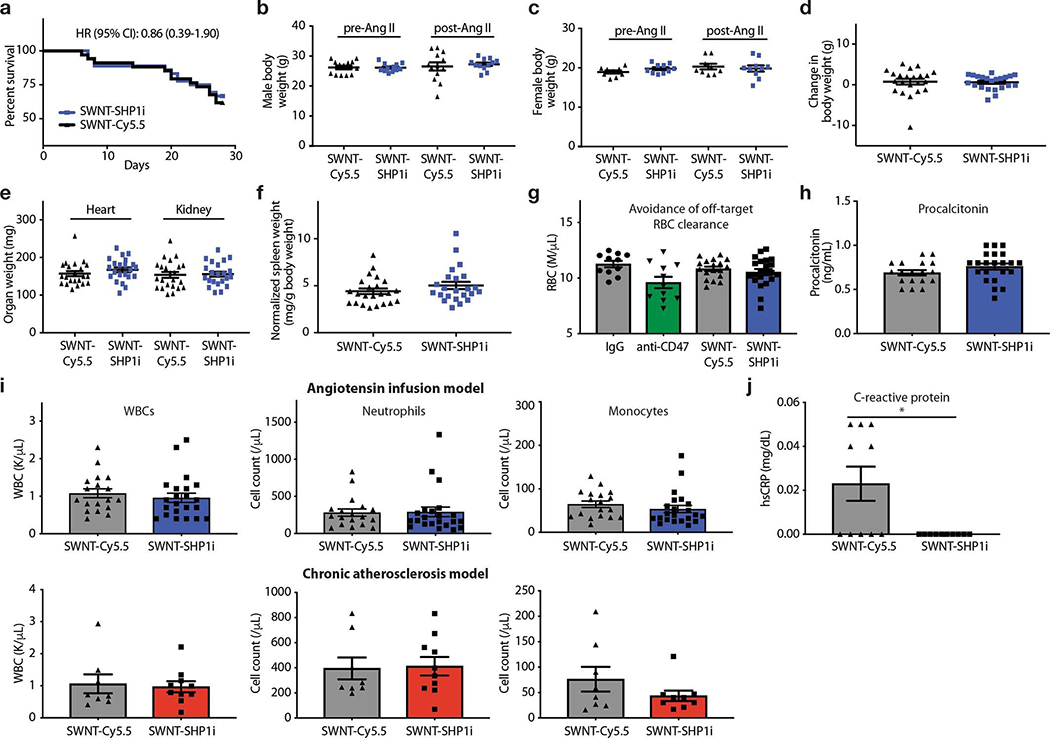
a, Survival analysis indicate no change in mortality with SWNT-SHP1i treatment (n = 34 biologically independent animals for control group, n = 36 biologically independent animals for SWNT-SHP1i group). b-d, The in vivo safety of pro-efferocytic SWNTs is further supported by the stable body weight in apoE−/− mice treated with SWNT-SHP1i compared to SWNT-Cy5.5 controls (n = 22 biologically independent animals per group). e,f. Similarly, there were no differences in the weight of any organ between groups (n = 22 biologically independent animals per group). g-j, SWNT-SHP1i does not induce any major hematopoietic toxicities, such as the reduction in the red blood cell (RBC) count that is observed in anti-CD47 antibody treated mice (g). Procalcitonin levels are also unchanged between treatment groups, indicating a low likelihood for increased bacterial infections in SWNT-SHP1i-treated mice (h). There is also no effect of SWNT-SHP1i on total leukocytes, neutrophils, or monocytes (n = 18 biologically independent animals for control group, n = 22 biologically independent animals for SWNT-SHP1i group) (i). Lastly, without inducing immunosuppression, SWNT-SHP1i reduced hs-CRP levels, suggesting reduced inflammation after treatment (n = 10 biologically independent animals per group). *p = 0.03 by two-sided Mann-Whitney U test (j). Blue graphs indicate results from the angiotensin infusion model, while red graphs indicate results from the chronic atherosclerosis studies. Data from anti-CD47 and IgG-treated mice in (g) are previously reported (n = 11 biologically independent animals per group).2 For all graphs, data are expressed as the mean and s.e.m.
Extended Data Fig. 9.
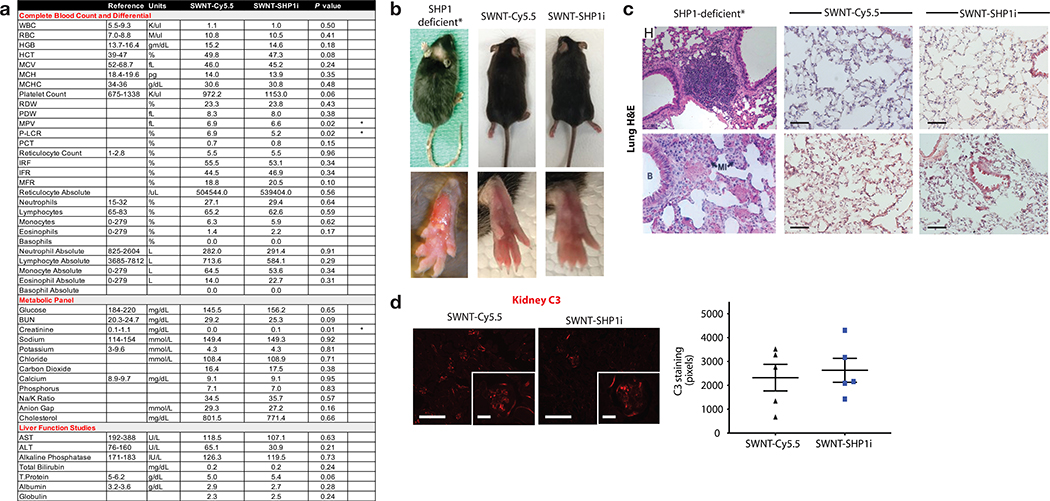
a, Hematology assessment demonstrate that SWNT-SHP1i treatment results in a significant decrease in the mean platelet volume (MPV) and platelet-large cell ratio (P-LCR), but has no effect on major parameters of the complete blood count or metabolic panel that would indicate organ or hematopoietic toxicity (n = minimum 9 biologically independent animals per group). *p < 0.05 by unpaired two-tailed t-test. b-d, In contrast to prior publications indicating that global knockout of SHP-1 can have a variety of harmful effects including dermatitis, pneumonitis, and renal complement deposition (images adapted from 3–5), we observed none of these toxicities in mice treated with macrophage-specific SWNT-SHP1i.6 This favorable safety profile was evidenced by a lack of hair loss or suppurative skin lesions (b), an absence of pulmonary inflammation and alveolar hemorrhage (c), and the absence of elevated renal C3 immunofluorescence staining (n = 5 per group, 4 sections analyzed per animal) (d). Scale bar in c, 100μm. Scale bars in d, 200 μm and 50 μm (insets). SHP1-deficient image in 9c reprinted with permission from 4; Copyright (2008) National Academy of Sciences, U.S.A. For all graphs, data are expressed as the mean and s.e.m.
Supplementary Material
Acknowledgments
A.M. Flores is a Howard Hughes Medical Institute Research Fellow. K.-U. Jarr and P. Tsantilas are supported by Deutsche Forschungsgemeinschaft grant JA 2869/1-1:1 and TS 385/1-1. This study was funded by NIH R35 HL144475, R01 HL123370, a 2018 Fondation Leducq Award (to N.J. Leeper), K99 CA160764 (to B.R. Smith), a Catalyst Award from the Dr. Ralph and Marian Falk Medical Research Trust, the Johnson Family Foundation (to N.J. Leeper), and the American Heart Association Transformational Project grant (to B.R. Smith and N.J. Leeper). We acknowledge the Stanford Small Animal Imaging Facility, the Stanford Cyclotron & Radiochemistry Facility, the Stanford Nano Shared Facilities/Stanford Nanofabrication Facility (National Science Foundation award ECCS-1542152), and the Stanford Shared FACS facility used for sorting (NIH S10 S10RR025518-01). The sequencing data was generated on an Illumina HiSeq 4000 that was purchased with funds from NIH S10OD018220. The authors wish to acknowledge Stefan Gustafsson for help with bioinformatics analyses, Irina Kalashnikova for technical assistance in nanocharacterization, Travis Shaffer for radiochemistry assistance, Dong-Hua Chen for help with the TEM imaging, Meredith Weglarz of the Stanford FACS facility for technical support, Dhananjay Wagh of the Stanford Functional Genomics Facility for assistance with single-cell RNA sequencing, and Timothy Doyle for valuable input on small animal imaging.
Footnotes
Competing financial interests
Drs. Leeper and Weissman are co-founders and hold equity interest in 47 Incorporated.
Code availability
Code used on R package for analysis of single-cell RNA sequencing data can be accessed via contacting A.M.F. at atflores@stanford.edu.
Data availability
The data that support the findings of this study are available from the corresponding author upon reasonable request.
Additional information
Supplementary information is available in the online version of the paper.
References
- 1.Arandjelovic S & Ravichandran KS Phagocytosis of apoptotic cells in homeostasis. Nat Immunol 16, 907–917, doi: 10.1038/ni.3253 (2015). [DOI] [PMC free article] [PubMed] [Google Scholar]
- 2.Huynh ML, Fadok VA & Henson PM Phosphatidylserine-dependent ingestion of apoptotic cells promotes TGF-beta1 secretion and the resolution of inflammation. J Clin Invest 109, 41–50, doi: 10.1172/JCI11638 (2002). [DOI] [PMC free article] [PubMed] [Google Scholar]
- 3.Yurdagul A Jr., Doran AC, Cai B, Fredman G & Tabas IA Mechanisms and Consequences of Defective Efferocytosis in Atherosclerosis. Front Cardiovasc Med 4, 86, doi: 10.3389/fcvm.2017.00086 (2017). [DOI] [PMC free article] [PubMed] [Google Scholar]
- 4.Jaiswal S et al. CD47 is upregulated on circulating hematopoietic stem cells and leukemia cells to avoid phagocytosis. Cell 138, 271–285, doi: 10.1016/j.cell.2009.05.046S0092-8674(09)00651-5 [pii] (2009). [DOI] [PMC free article] [PubMed] [Google Scholar]
- 5.Willingham SB et al. The CD47-signal regulatory protein alpha (SIRPa) interaction is a therapeutic target for human solid tumors. Proc Natl Acad Sci U S A 109, 6662–6667, doi: 10.1073/pnas.11216231091121623109 [pii] (2012). [DOI] [PMC free article] [PubMed] [Google Scholar]
- 6.Kojima Y et al. CD47-blocking antibodies restore phagocytosis and prevent atherosclerosis. Nature 536, 86–90, doi: 10.1038/nature18935 (2016). [DOI] [PMC free article] [PubMed] [Google Scholar]
- 7.Maller J et al. Common variation in three genes, including a noncoding variant in CFH, strongly influences risk of age-related macular degeneration. Nat Genet 38, 1055–1059, doi:ng1873 [pii] 10.1038/ng1873 (2006). [DOI] [PubMed] [Google Scholar]
- 8.Pe’er I et al. Evaluating and improving power in whole-genome association studies using fixed marker sets. Nat Genet 38, 663–667, doi:ng1816 [pii] 10.1038/ng1816 (2006). [DOI] [PubMed] [Google Scholar]
- 9.Brown EJ & Frazier WA Integrin-associated protein (CD47) and its ligands. Trends in cell biology 11, 130–135 (2001). [DOI] [PubMed] [Google Scholar]
- 10.Gresham HD et al. Negative regulation of phagocytosis in murine macrophages by the Src kinase family member, Fgr. J Exp Med 191, 515–528 (2000). [DOI] [PMC free article] [PubMed] [Google Scholar]
- 11.Liu J et al. Pre-Clinical Development of a Humanized Anti-CD47 Antibody with Anti-Cancer Therapeutic Potential. PLoS One 10, e0137345, doi: 10.1371/journal.pone.0137345 (2015). [DOI] [PMC free article] [PubMed] [Google Scholar]
- 12.Weiskopf K et al. Engineered SIRPalpha variants as immunotherapeutic adjuvants to anticancer antibodies. Science 341, 88–91, doi: 10.1126/science.1238856 [pii] (2013). [DOI] [PMC free article] [PubMed] [Google Scholar]
- 13.Liu Z, Sun X, Nakayama-Ratchford N & Dai H Supramolecular chemistry on water-soluble carbon nanotubes for drug loading and delivery. ACS Nano 1, 50–56, doi: 10.1021/nn700040t (2007). [DOI] [PubMed] [Google Scholar]
- 14.Schipper ML et al. A pilot toxicology study of single-walled carbon nanotubes in a small sample of mice. Nat Nanotechnol 3, 216–221, doi: 10.1038/nnano.2008.68 (2008). [DOI] [PubMed] [Google Scholar]
- 15.Liu Z et al. Circulation and long-term fate of functionalized, biocompatible single-walled carbon nanotubes in mice probed by Raman spectroscopy. Proc Natl Acad Sci U S A 105, 1410–1415, doi: 10.1073/pnas.0707654105 (2008). [DOI] [PMC free article] [PubMed] [Google Scholar]
- 16.Smith BR et al. Selective uptake of single-walled carbon nanotubes by circulating monocytes for enhanced tumour delivery. Nature nanotechnology 9, 481–487, doi: 10.1038/nnano.2014.62 (2014). [DOI] [PMC free article] [PubMed] [Google Scholar]
- 17.Swirski FK et al. Ly-6Chi monocytes dominate hypercholesterolemia-associated monocytosis and give rise to macrophages in atheromata. J Clin Invest 117, 195–205, doi: 10.1172/JCI29950 (2007). [DOI] [PMC free article] [PubMed] [Google Scholar]
- 18.Robbins CS et al. Extramedullary hematopoiesis generates Ly-6C(high) monocytes that infiltrate atherosclerotic lesions. Circulation 125, 364–374, doi: 10.1161/CIRCULATIONAHA.111.061986 (2012). [DOI] [PMC free article] [PubMed] [Google Scholar]
- 19.Swirski FK et al. Monocyte accumulation in mouse atherogenesis is progressive and proportional to extent of disease. Proc Natl Acad Sci U S A 103, 10340–10345, doi: 10.1073/pnas.0604260103 (2006). [DOI] [PMC free article] [PubMed] [Google Scholar]
- 20.Moore KJ & Tabas I Macrophages in the pathogenesis of atherosclerosis. Cell 145, 341–355, doi: 10.1016/j.cell.2011.04.005S0092-8674(11)00422-3 [pii] (2011). [DOI] [PMC free article] [PubMed] [Google Scholar]
- 21.Liu Z et al. In vivo biodistribution and highly efficient tumour targeting of carbon nanotubes in mice. Nat Nanotechnol 2, 47–52, doi: 10.1038/nnano.2006.170 (2007). [DOI] [PubMed] [Google Scholar]
- 22.Campagnolo L et al. Biodistribution and toxicity of pegylated single wall carbon nanotubes in pregnant mice. Part Fibre Toxicol 10, 21, doi: 10.1186/1743-8977-10-21 (2013). [DOI] [PMC free article] [PubMed] [Google Scholar]
- 23.Shu-Chen Hung NR, Zhu Shoujun, Ma Zhuoran, Ghosn Eliver and Mellins Elizabeth D.. Single-walled carbon nanotubes target neutrophils and Ly-6Chi monocytes and localize to joints in murine models of arthritis. The Journal of Immunology (2018). [Google Scholar]
- 24.Daugherty A, Manning MW & Cassis LA Angiotensin II promotes atherosclerotic lesions and aneurysms in apolipoprotein E-deficient mice. J Clin Invest 105, 1605–1612, doi: 10.1172/JCI7818 (2000). [DOI] [PMC free article] [PubMed] [Google Scholar]
- 25.Zhang Z, Shen K, Lu W & Cole PA The role of C-terminal tyrosine phosphorylation in the regulation of SHP-1 explored via expressed protein ligation. J Biol Chem 278, 4668–4674, doi: 10.1074/jbc.M210028200 (2003). [DOI] [PubMed] [Google Scholar]
- 26.Schrijvers DM, De Meyer GR, Kockx MM, Herman AG & Martinet W Phagocytosis of apoptotic cells by macrophages is impaired in atherosclerosis. Arterioscler Thromb Vasc Biol 25, 1256–1261, doi:01.ATV.0000166517.18801.a7 [pii] 10.1161/01.ATV.0000166517.18801.a7 (2005). [DOI] [PubMed] [Google Scholar]
- 27.Poon IK, Lucas CD, Rossi AG & Ravichandran KS Apoptotic cell clearance: basic biology and therapeutic potential. Nat Rev Immunol 14, 166–180, doi: 10.1038/nri3607 (2014). [DOI] [PMC free article] [PubMed] [Google Scholar]
- 28.Rudd JH et al. Imaging atherosclerotic plaque inflammation by fluorodeoxyglucose with positron emission tomography: ready for prime time? J Am Coll Cardiol 55, 2527–2535, doi: 10.1016/j.jacc.2009.12.061 (2010). [DOI] [PubMed] [Google Scholar]
- 29.Luo G et al. Spontaneous calcification of arteries and cartilage in mice lacking matrix GLA protein. Nature 386, 78–81, doi: 10.1038/386078a0 (1997). [DOI] [PubMed] [Google Scholar]
- 30.Carballo E, Gilkeson GS & Blackshear PJ Bone marrow transplantation reproduces the tristetraprolin-deficiency syndrome in recombination activating gene-2 (−/−) mice. Evidence that monocyte/macrophage progenitors may be responsible for TNFalpha overproduction. J Clin Invest 100, 986–995, doi: 10.1172/JCI119649 (1997). [DOI] [PMC free article] [PubMed] [Google Scholar]
- 31.Yoshimura A, Naka T & Kubo M SOCS proteins, cytokine signalling and immune regulation. Nat Rev Immunol 7, 454–465, doi: 10.1038/nri2093 (2007). [DOI] [PubMed] [Google Scholar]
- 32.Barker RN et al. Antigen presentation by macrophages is enhanced by the uptake of necrotic, but not apoptotic, cells. Clin Exp Immunol 127, 220–225 (2002). [DOI] [PMC free article] [PubMed] [Google Scholar]
- 33.George TI in Automated hematology instrumentation (UptoDate Inc, 2018). [Google Scholar]
- 34.Ridker PM et al. Antiinflammatory Therapy with Canakinumab for Atherosclerotic Disease. N Engl J Med 377, 1119–1131, doi: 10.1056/NEJMoa1707914 (2017). [DOI] [PubMed] [Google Scholar]
- 35.Advani R et al. CD47 Blockade by Hu5F9-G4 and Rituximab in Non-Hodgkin’s Lymphoma. N Engl J Med 379, 1711–1721, doi: 10.1056/NEJMoa1807315 (2018). [DOI] [PMC free article] [PubMed] [Google Scholar]
- 36.Plutzky J, Neel BG & Rosenberg RD Isolation of a src homology 2-containing tyrosine phosphatase. Proc Natl Acad Sci U S A 89, 1123–1127 (1992). [DOI] [PMC free article] [PubMed] [Google Scholar]
- 37.Green MC & Shultz LD Motheaten, an immunodeficient mutant of the mouse. I. Genetics and pathology. J Hered 66, 250–258, doi: 10.1093/oxfordjournals.jhered.a108625 (1975). [DOI] [PubMed] [Google Scholar]
- 38.Kojima Y et al. Cyclin-dependent kinase inhibitor 2B regulates efferocytosis and atherosclerosis. J Clin Invest 124, 1083–1097, doi: 10.1172/JCI7039170391 [pii] (2014). [DOI] [PMC free article] [PubMed] [Google Scholar]
- 39.Smith BR & Gambhir SS Nanomaterials for In Vivo Imaging. Chem Rev 117, 901–986, doi: 10.1021/acs.chemrev.6b00073 (2017). [DOI] [PubMed] [Google Scholar]
- 40.Flores AM et al. Nanoparticle Therapy for Vascular Diseases. Arterioscler Thromb Vasc Biol 39, 635–646, doi: 10.1161/ATVBAHA.118.311569 (2019). [DOI] [PMC free article] [PubMed] [Google Scholar]
- 41.Alidori S et al. Targeted fibrillar nanocarbon RNAi treatment of acute kidney injury. Sci Transl Med 8, 331ra339, doi: 10.1126/scitranslmed.aac9647 (2016). [DOI] [PMC free article] [PubMed] [Google Scholar]
- 42.Kagan VE et al. Carbon nanotubes degraded by neutrophil myeloperoxidase induce less pulmonary inflammation. Nat Nanotechnol 5, 354–359, doi: 10.1038/nnano.2010.44 (2010). [DOI] [PMC free article] [PubMed] [Google Scholar]
- 43.Elgrabli D et al. Carbon Nanotube Degradation in Macrophages: Live Nanoscale Monitoring and Understanding of Biological Pathway. ACS Nano 9, 10113–10124, doi: 10.1021/acsnano.5b03708 (2015). [DOI] [PubMed] [Google Scholar]
- 44.Green DR, Oguin TH & Martinez J The clearance of dying cells: table for two. Cell Death Differ 23, 915–926, doi: 10.1038/cdd.2015.172 (2016). [DOI] [PMC free article] [PubMed] [Google Scholar]
- 45.Fredman G et al. Targeted nanoparticles containing the proresolving peptide Ac2–26 protect against advanced atherosclerosis in hypercholesterolemic mice. Sci Transl Med 7, 275ra220, doi: 10.1126/scitranslmed.aaa1065 (2015). [DOI] [PMC free article] [PubMed] [Google Scholar]
- 46.Liu Z, Tabakman SM, Chen Z & Dai H Preparation of carbon nanotube bioconjugates for biomedical applications. Nat Protoc 4, 1372–1382, doi: 10.1038/nprot.2009.146 (2009). [DOI] [PMC free article] [PubMed] [Google Scholar]
- 47.Smith BR et al. Shape matters: intravital microscopy reveals surprising geometrical dependence for nanoparticles in tumor models of extravasation. Nano letters 12, 3369–3377, doi: 10.1021/nl204175t (2012). [DOI] [PMC free article] [PubMed] [Google Scholar]
- 48.Zheng GX et al. Massively parallel digital transcriptional profiling of single cells. Nat Commun 8, 14049, doi: 10.1038/ncomms14049 (2017). [DOI] [PMC free article] [PubMed] [Google Scholar]
- 49.Butler A, Hoffman P, Smibert P, Papalexi E & Satija R Integrating single-cell transcriptomic data across different conditions, technologies, and species. Nat Biotechnol 36, 411–420, doi: 10.1038/nbt.4096 (2018). [DOI] [PMC free article] [PubMed] [Google Scholar]
- 50.Ashburner M et al. Gene ontology: tool for the unification of biology. The Gene Ontology Consortium. Nat Genet 25, 25–29, doi: 10.1038/75556 (2000). [DOI] [PMC free article] [PubMed] [Google Scholar]
Associated Data
This section collects any data citations, data availability statements, or supplementary materials included in this article.


